


Gamma frequency activity (30–150 Hz) is induced in cognitive tasks and is thought to reflect underlying neural processes. Gamma frequency activity can be recorded directly from the human brain using intracranial electrodes implanted in patients undergoing treatment for drug-resistant epilepsy. Previous studies have independently explored narrowband oscillations in the local field potential and broadband power increases. It is not clear, however, which processes contribute to human brain gamma frequency activity, or their dynamics and roles during memory processing. Here a large dataset of intracranial recordings obtained during encoding of words from 101 patients was used to detect, characterize and compare induced gamma frequency activity events. Individual bursts of gamma frequency activity were isolated in the time-frequency domain to determine their spectral features, including peak frequency, amplitude, frequency span, and duration. We found two distinct types of gamma frequency activity events that showed either narrowband or broadband frequency spans revealing characteristic spectral properties. Narrowband events, the predominant type, were induced by word presentations following an initial induction of broadband events, which were temporally separated and selectively correlated with evoked response potentials, suggesting that they reflect different neural activities and play different roles during memory encoding. The two gamma frequency activity types were differentially modulated during encoding of subsequently recalled and forgotten words. In conclusion, we found evidence for two distinct activity types induced in the gamma frequency range during cognitive processing. Separating these two gamma frequency activity components contributes to the current understanding of electrophysiological biomarkers, and may prove useful for emerging neurotechnologies targeting, mapping and modulating distinct neurophysiological processes in normal and epileptogenic brain.
Introduction
Intracranial electroencephalography (iEEG) during cognitive task performance provides a valuable window into the neuronal activities underlying mental processes. Perceiving an object, paying attention to it, and encoding its memory trace is accompanied by changes in the local field potential recorded with iEEG. The iEEG signal represents superposition from various sources of neuronal activities—predominantly oscillations in postsynaptic membrane potential (Nunez and Srinivasan, 2006; Buzsáki et al., 2012; Haider et al., 2016), but for higher gamma frequencies also synchronized neuronal action potentials (Ray et al., 2008; Miller et al., 2009). Separating different sources of neuronal activity contributing to the iEEG signal poses a major challenge to analysing and understanding brain electrophysiology, especially in gamma and higher frequency ranges (Buzsáki and Silva, 2012; Worrell et al., 2012; Burke et al., 2015; Cimbalnik et al., 2016).
Gamma frequency oscillations in the local field have been extensively studied in cognitive processes engaged in perception, attention and memory (Hughes, 1964; Singer, 1993; Tallon-Baudry and Bertrand, 1999; Jensen et al., 2007; Fries, 2009; Düzel et al., 2010). Oscillations spanning a 30 to 150 Hz range, corresponding to a period of ∼6 to 30 ms, were proposed to set an ideal time frame for neuronal interactions underlying synaptic plasticity and memory consolidation (Jensen et al., 2007; Düzel et al., 2010; Buzsáki and Wang, 2012). Hence, these oscillations were hypothesized to play a fundamental role in synchronizing neuronal processes within the timeframe of a gamma oscillation cycle (Fries, 2009), setting a temporal window, or a ‘clock’, for cognitive processes. This was proposed to be the mechanism for binding of coherent object representations, selecting out attended objects, and consolidating their memory traces. In this view, a specific group of neurons involved in processing information of an object, i.e. a neuronal assembly, coordinates its activities into coherent oscillations and thus selectively engages synaptic interactions. Detecting these local field potential oscillations in iEEG recordings has therefore been proposed to index coordinated activity of neuronal assemblies (Lachaux et al., 2012).
An alternative view proposes that gamma frequency activity (GA, ∼70 Hz and above) simply reflects activation of neural populations, which does not underlie any specific functional role in memory processing (reviewed recently in Burke et al., 2015). These fundamental questions are complicated by the fact that GA can be decomposed into true gamma oscillations and broadband power changes that closely track multi-unit neuronal activity (Ray and Maunsell, 2011; Scheffer-Teixeira et al., 2013; Self et al., 2016). Unfortunately, studies of human memory have not specifically separated and characterized the induced GA, i.e. increases in gamma frequency spectral power and discrete gamma band oscillations, associated with stimulus presentation, encoding and recall. Similarly, high frequency biomarkers of epileptiform brain networks have not been dissected into different contributing processes (Stacey, 2015; Cimbalnik et al., 2016).
Here, we test a hypothesis that GA comprises a population of heterogeneous electrophysiological events reflecting different neural processes engaged during memory encoding. A large dataset of human iEEG recordings acquired during memory tasks was used to isolate different types of GAs in the human brain. GAs were assessed by detecting discrete events induced during word encoding in three physiologically relevant frequency bands (Colgin et al., 2009; Belluscio et al., 2012; Buzsáki and Silva, 2012; Schomburg et al., 2012)—low gamma (30 to <60 Hz), high gamma (>60 to 100 Hz) and epsilon (100–150 Hz) and separating them using an unsupervised clustering approach into different classes of activities. One hypothesis tested here is that the different classes of activities can be separated based on their characteristic frequency within specific spectral bands. An alternative possibility is that different GA types co-occur within the same spectral bands and thus have to be separated based on other qualitative differences, such as duration, amplitude, spectral content, or temporal relation to stimulus presentation, to isolate specific neurophysiological processes.
Materials and methods
Patients with epilepsy (n = 101) who were implanted with intracranial subdural and depth electrodes for surgical evaluation of drug-resistant epilepsy were recorded with iEEG during free recall memory tasks. The free recall tasks used lists of 12 words presented individually on a laptop computer screen for subsequent recall. Individual bursts of GA (Kucewicz et al., 2014; Lundqvist et al., 2016) were detected trial-by-trial in low gamma (30–60 Hz), high gamma (60–100 Hz) and epsilon (100–150 Hz) frequency ranges to build a library of GA detections from all patients and electrodes. The spectral and time domain properties of every detection were determined, including peak frequency, frequency span, duration, latency from word onset and peak amplitude. The detected bursts of GAs were treated as point processes at the time of peak amplitude of a given burst (Kucewicz et al., 2014, 2016). Frequency span values of the detected GA events were then classified into those that showed narrow or broad frequency span (i.e. bandwidth) by an unsupervised k-means clustering algorithm and compared with Gaussian Mixture Models (Supplementary Fig. 4). Properties of the narrowband and broadband detections, as well as their relative proportions and distributions, were compared on active electrode contacts that showed induced GA responses in the tasks. The correlates of the two GA types with memory function were investigated by looking at the latencies of the induced response to word presentations, phase-locking and correlation to evoked response potentials, and contribution to subsequent memory effect, i.e. relative detection rates during presentations of words that were subsequently recalled and forgotten. GA phase-locking to evoked response potentials was quantified using Chronux—a multi-taper spectral analysis toolbox (Bokil et al., 2010) (www.chronux.org). All data processing and analysis was performed in Matlab (MathWorks Inc.) using in-built and custom-made codes. All results are presented as mean ± SEM (standard error of the mean) unless stated otherwise.
Study participants
Patients undergoing iEEG monitoring as part of clinical treatment for drug-resistant epilepsy were recruited to participate in this multi-centre collaborative study. Data were collected from the following eight clinical centres: Thomas Jefferson, University Hospital (Philadelphia, PA), Mayo Clinic (Rochester, MN), Hospital of the University of Pennsylvania (Philadelphia, PA), Dartmouth Medical Center (Lebanon, NH), Emory Hospital (Atlanta, GA), University of Texas Southwestern Medical Center (Dallas, TX) and Columbia University Medical Center (New York, NY). The research protocol was approved by the IRB at each hospital and informed consent was obtained from each participant. Electrophysiological data were collected from standard clinical subdural and penetrating electrodes (AdTech Inc., PMT Inc.) implanted on the cortical surface and into the brain parenchyma, respectively. The subdural electrode contacts were arranged in either grid or strip arrays, with recording contacts separated by 10 mm, whereas the spacing of contacts on the penetrating electrodes was either 5 or 10 mm. In each case, the number and placement of the electrodes was determined by a clinical team with sole purpose of localizing epileptogenic brain regions.
Anatomical localization
Whole brain cortical surface of each participant was obtained from volumetric T1-weighted sequences of pre-implant MRI scan using Freesurfer Matlab toolbox (www.surfer.nmr.mgh.harvard.edu/). Electrode contact localization was determined through co-registration of the pre-implant MRI sequences and post-implant CT scan images to provide Talairach coordinates. The corresponding anatomical locations were labelled according to the Talairach daemon (www.talairach.org) to assign specific Brodmann area, cortical gyrus, lobe and hemisphere to each contact.
Electrophysiological recordings
Intracranial data were recorded using one of the following clinical electrophysiological acquisition systems (depending on the site of data collection): Nihon Kohden EEG-1200, Natus XLTek EMU 128 or Grass Aura-LTM64. Depending on the acquisition system and the preference of the clinical team, the iEEG signals were sampled at either 500, 1000 or 1600 Hz and were referenced to a common contact placed either intracranially, on the scalp, or on mastoid process. A bipolar montage was calculated post hoc for each subject by subtracting the measured voltage time series on all electrode pair combinations of spatially adjacent contacts. This resulted in N − 1 bipolar signals in case of the penetrating depth and strip electrodes, and N = (i − 1) x j + (j − 1) x i bipolar signals on the grid electrodes, where i and j are the numbers of electrodes in the two dimensions of the grid. All bipolar derivations with higher than 500 Hz sampling frequency were then downsampled to 500 Hz—the minimum sampling frequency used in all measurements.
Memory tasks
Following implantation each subject participated in delayed free-recall memory tasks, in which they were instructed to study lists of words presented on a laptop computer screen for a later memory test. Lists were composed of 12 words chosen at random and without replacement from a pool of high frequency nouns (either English or Spanish, depending on the participant’s native language; http://memory.psych.upenn.edu/WordPools memory.psych.upenn.edu/WordPools). The words on each list were either sampled from specific categories (categorized free recall task) like vehicles, music instruments and vegetables, or they were sampled randomly (free recall task). Each word remained on the screen for 1600 ms, followed by a randomly jittered 750–1000 ms blank inter-stimulus interval. Immediately following the final word in each list, participants performed a distractor task (20 s) consisting of a series of arithmetic problems of the form ‘A + B + C = ??’, where A, B and C were randomly chosen integers ranging from 1–9. Following the distractor task participants were given 30 s to verbally recall as many words as possible from the list in any order. The patients’ vocal responses were digitally recorded by the laptop computer and later manually scored for analysis. Each session consisted of 25 lists of this encoding-distractor-recall procedure. Task events and responses, including stimulus appearance on the screen, were synchronized with the electrophysiological recordings through an electric pulse generator operated by the task laptop to send pulses to a designated event channel in the clinical acquisition system. The events were timestamped after the recording session using custom-written Matlab codes, and were used to extract specific epochs of interest. The 3000 ms recording epochs of word presentation were analysed in this study, which comprised 1600 ms of word viewing on the screen and 700 ms interstimulus interval before and following the word presentation.
Detection of individual bursts of gamma frequency activity
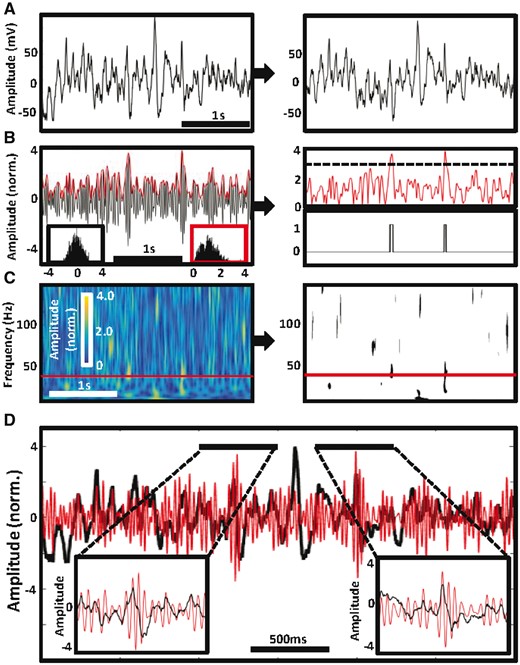
Method for detecting gamma frequency activities. Two detections of gamma frequency activity in frequency band 40–41 Hz are presented in one example of 3000 ms recording epoch from an occipital cortical electrode contact. (A) Raw data epoch (left) was first corrected for shifts in direct current and slow oscillations (<1 Hz) and notch filtered to remove power from line noise (right). (B) The signal was then band-pass filtered in a 1 Hz step from 40 to 41 Hz (left) and the amplitude was normalized using z-score before calculating Hilbert spectral envelope (red trace above the filtered signal) because the amplitude values are normally distributed (lower left black inset histogram) in contrast to the spectral envelope values (lower right red insert histogram). Hence the spectral envelope trace was thresholded at 3 SD (dashed line) determined from the population of amplitude values (right). Two threshold crossings corresponding to two detections are presented in binary format. (C) Coloured spectrogram matrix visualizes the normalized Hilbert amplitude values across all filtered frequency bands from 1 to 150 Hz (left) including the 40–41 Hz example from B (red rectangle). The matrix was transformed into the binary format as in B to identify discrete islands of significant gamma frequency activity above z-score threshold > 3 (right). (D) Two detections at the 40 to 41 Hz band are shown in the enlarged inset plots of the raw data epoch from A (black trace), which is superimposed on 40 to 41 Hz band-pass filtered signal (red trace).
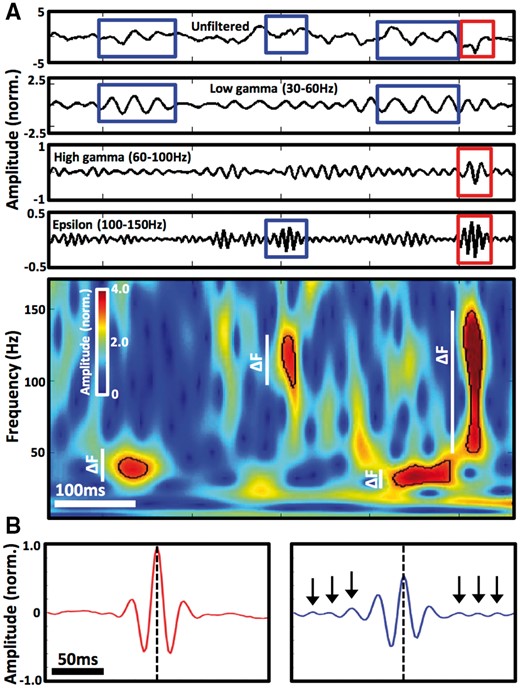
Discrete detections of gamma frequency activity showing narrow and broad frequency spans. (A) Top panel shows raw data epoch together with its band-pass filtered signals in the low gamma, high gamma and epsilon frequency ranges. Detections of GA events showing narrow and broad frequency spans are highlighted in blue and red rectangles, respectively, as outlined in the corresponding spectrogram below (Supplementary material). The bottom panel spectrogram delineates spectral boundaries of each of the four detections (black line), showing their frequency span (i.e. bandwidth) in white vertical bars (ΔF) that was used to classify them into broadband and narrowband events. (B) Average amplitude changes of 922 broadband (left, red) and 1578 narrowband (right, blue) detections with peak amplitude at frequency band 43–47 Hz aligned to the time of peak amplitude (dashed line). Detections were taken from all active occipital cortical contacts in one patient implanted with subdural electrode grid. Notice nine consistent cycles of oscillation in the 200 ms window of the narrowband detections (black arrows point to cycles extending beyond the central waveform), in contrast to the broadband detections.
Clustering narrowband and broadband gamma frequency activity bursts
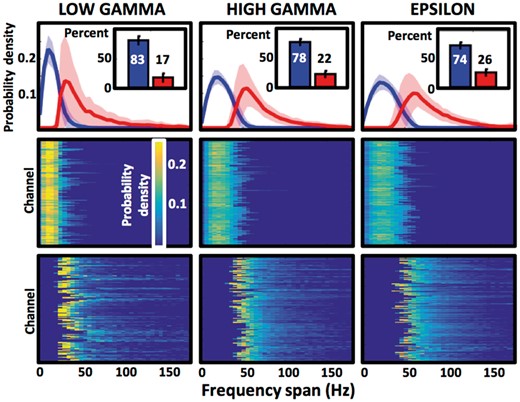
GA detections cluster into two consistent populations. Distributions of frequency spans of two GA detection types (top), as separated by unsupervised, automated clustering algorithm for every electrode contact, are presented as relative proportion of all detections of a given type (probability density). Inset plots summarize the average percentage of the narrowband (blue) and the broadband (red) types. The frequency span distributions are broken down into individual electrode channels and separated into narrowband and broadband types in the middle and bottom row, respectively (148 low gamma, 214 high gamma, and 229 epsilon band channels). Colour scale matrices are used to visualize the probability density distributions of each channel that contributed to the average plots in the top row. Notice the regularity of the peak frequency span values of the narrowband GAs distribution, compared to variability and skewness of the broadband distribution.
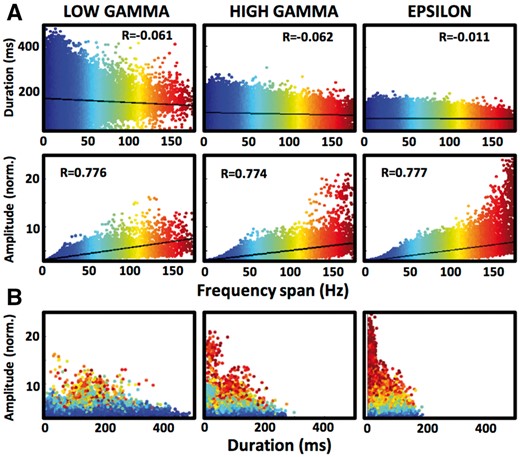
Duration and amplitude of GA bursts is correlated with their frequency span. (A) Scatterplots of all low gamma (211 070), high gamma (398 571), and epsilon (534 595) GA detections show decreasing duration (top) and increasing amplitude (bottom) of events with increasing frequency span (graded with the colour scale). Least-squares lines are drawn in black. (B) Scatterplots of the GA detections from A are plotted in the amplitude-duration space with the same graded colour scale of the frequency span. Notice that the hot colour points of the broadband events cluster in the high amplitude-low duration space.
The average amplitudes of the two different classes of GA detections determined from the automated clustering algorithm were obtained from raw data epochs of all detections for a given peak amplitude frequency estimated at a chosen example frequency. For example, in Fig. 2B the filtered signals of epochs for frequency window 43–47 Hz of all GA detections were aligned to the time of peak normalized amplitude determined to be between−50 and +50 ms from the detection onset time (i.e. crossing of the 3.0 z-score threshold), and 100 ms before and after the amplitude peak were utilized from the raw data epoch of each detection and averaged across all detections to produce the amplitude plots.
Identification of active electrode contacts and subsequent memory effect
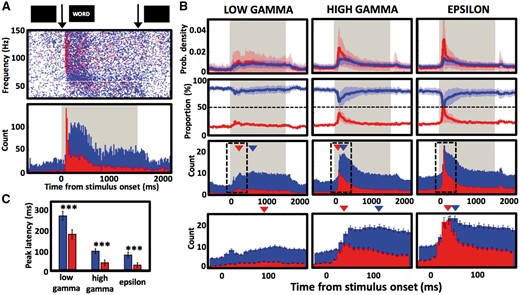
Stimulus presentation induces early broadband and late narrowband responses. (A) Narrowband (blue) and broadband (red) GA detections from one occipital cortical electrode contact are plotted at their peak amplitude frequency and latency as single points (top) and summarized as histogram counts (bottom) in response to word presentation (arrows mark the word onset and offset; grey background marks the entire word presentation interval). (B) Latency distribution of low gamma, high gamma and epsilon GAs averaged across all active contacts are plotted as: relative proportion (probability density) of all detections of a given type (top row), as percentage proportion of all GA detections (middle row), and as sum histogram count (bottom row). Dashed line indicates the 50% proportion point of equal chance of detecting a narrowband or a broadband event. Arrowheads point to the peak values of detection counts, and the dashed black rectangles mark windows for the bottom magnified views of the histogram counts. (C) Average values of latencies from word onset of peaks in narrowband and broadband detection counts, as in B (148 low gamma, 214 high gamma, and 229 epsilon band contacts; ***P < 0.001). Note the early sharp peak of broadband GAs response (especially in the epsilon band), which results in equal proportion of the two GA types and precedes subsequent narrowband response peak in all frequency bands.
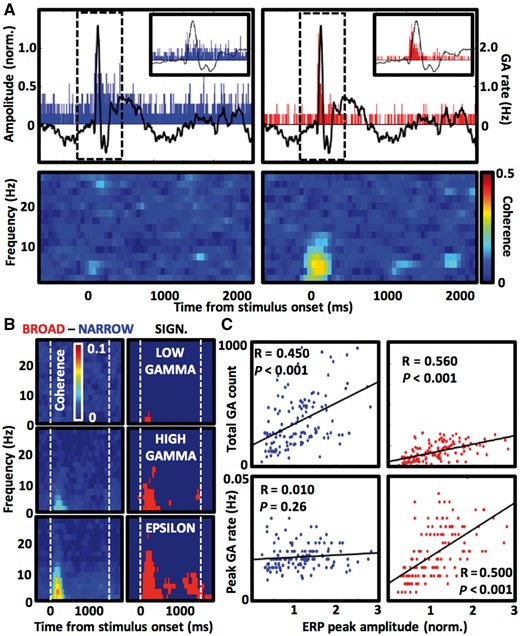
Broadband GAs are phase-locked to ERP. (A) Example of a single electrode contact showing selective phase-locking of broadband epsilon GA detections to rising edge of the ERP waveform—top row summarizes mean detection rates of narrowband (blue on the left) and broadband (red on the right) GAs superimposed on ERP trace from the same contact (black dashed boxes delineate windows for the enlarged inset views). Lower coherograms visualize trial-averaged phase coherence of the GA detections to low frequency oscillations from the same contact. Notice increased coherence to 4–8 Hz oscillation corresponding to the timing of ERP waveform (from ∼50 to 250 ms post-stimulus). (B) Difference between the broadband and narrowband phase-locking is presented as subtraction of coherograms for the two GA types as in A averaged across all active contacts (left side; 148 electrode contacts in the low gamma, 214 in the high gamma and 229 in the epsilon frequency bands), and as P-values of Wilcoxon signed rank test run for each pixel of the coherograms (red indicates P < 6.25 × 10⁻⁵ after multiple comparison correction). (C) Scatterplots and least-squares lines show correlations of ERP size with total and peak GA counts (narrowband and broadband in blue and red, respectively) during first 400 ms after word presentation. Notice that broadband but not narrowband peak GA responses are correlated with ERP amplitude.
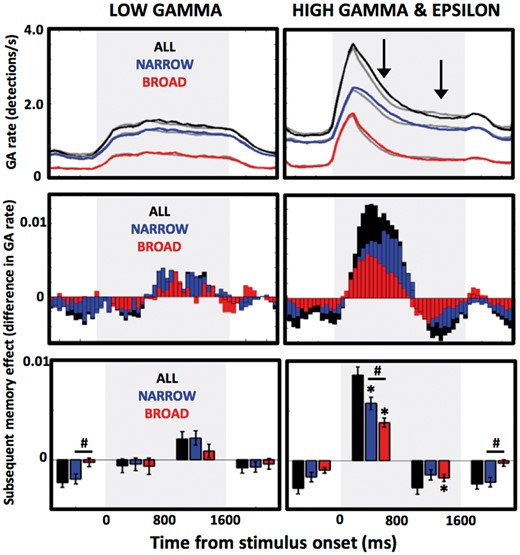
Contribution of narrowband and broadband GAs to SME. Contribution of all (black), only narrowband (blue), and only broadband (red) GA detections to subsequent memory effect is presented as mean detection rates on trials with subsequently recalled (solid lines) and forgotten (grey lines) words. Electrode contacts with GA responses in the low gamma band (left column) were grouped separately from the high gamma or epsilon bands (right column) to provide a total of 282 and 420 active electrodes in each group. Top row summarizes mean detection counts smoothed across the 50 ms bins, middle row bar plots show difference scores from the top row plots between recalled and forgotten words (i.e. positive or negative SME), and the bottom row bar plots provide average values of the middle row plot scores across four epochs of word encoding (−750 to 0, 0 to +750, +750 to +1500, +1500 to +2250 ms relative to word onset time) for statistical comparisons. Grey area indicates word presentation interval. *Bins with significant subsequent memory effect (Wilcoxon Signed Rank test, P < 0.0125 after correction for multiple comparisons); #significant difference between narrowband and broadband SME scores (Wilcoxon Rank Sum test, P < 0.05). Notice that only high gamma/epsilon band shows the memory effect, which is greater and peaks later (black arrows) for narrowband than broadband GAs.
The subsequent memory effect, i.e. the ability to recall previously encoded words and its association with GAs, was tested using the mean bin counts calculated separately for the data epochs with words that were subsequently recalled and those that were forgotten. These mean bin counts were compared between the two conditions (recalled versus forgotten) by averaging across four 750 ms epochs of word encoding (−750 to 0, 0 to +750, +750 to +1500, +1500 to +2250 ms relative to word onset time) and running a Wilcoxon Signed Rank test with Bonferroni correction for multiple comparisons in the four epochs. Sample size for the test was therefore equal to the number of all active electrodes in a given band for a given GA type. Magnitudes of the subsequent memory effect (SME) for narrowband and broadband GA type were compared using Wilcoxon Rank Sum test.
Phase locking of gamma frequency activities to evoked response potentials
GA detection rates per second were calculated using mean counts from all word presentation epochs for every 50 ms bin (Fig. 6A) to evaluate detection rate (Hz) in each 50 ms bin. The evoked response potentials (ERPs) were generated by averaging over all raw data epochs for a given contact (Fig. 5A).
Multi-taper spectral analysis (Bokil et al., 2010) (www.chronux.org), was used to estimate phase relationship between GA detections in the three frequency bands and oscillations in 1–30 Hz lower frequency range. Each detection was treated as point process data point occurring at its peak amplitude, like spikes in single unit analysis (Kucewicz et al., 2016). Phase coherence of these point processes to the low frequency oscillations was calculated using Chronux toolbox (taper parameters: 2.5 Hz frequency width, 0.4 s time width) in 400 ms sliding time windows (50 ms steps) averaged across the entire 3000 ms data epochs. This method calculates the magnitude of coherency between the GA detections and the low frequency oscillations, and their cross-spectrum and individual spectra from which the coherence is computed. Phase coherence estimate is sensitive to a trial-bias problem (Winck et al., 2010), which was addressed here by matching the number of the narrowband and broadband event trials for every electrode—‘n’ randomly selected narrowband events were used in the analysis, where ‘n’ equals the total number of broadband events. As a result, the Chronux function produced a matrix of trial-averaged coherogram pixel values (each data epoch is one trial) with rows and columns as frequency and time bins, respectively (Fig. 6A). Difference between phase locking of narrowband and broadband GAs was tested with Wilcoxon signed rank comparison of coherogram values from all electrode contacts for every pixel of the matrix (Fig. 6B and Supplementary Fig. 6), with Bonferroni correction for multiple comparisons.
ERP amplitudes were estimated by calculating the absolute value of maximum amplitude in first 600 ms post-stimulus of the ERP trace. Total induced GA count and peak GA rate were calculated for every electrode contact from all patients by taking the sum of all counts and the maximum mean count value, respectively, from the first 400 ms post-stimulus. Correlations between the ERP amplitude and the GA count and rate were tested with Pearson’s correlation coefficient and visualized with least-squares lines.
Results
Data were collected from 101 patients implanted with intracranial electrodes as part of their evaluation for epilepsy surgery who performed a free recall verbal memory task. In total, 41 100 epochs of word presentation (mean of 415 ± 28 words per patient) were recorded from 10 533 electrode contacts (mean of 108 ± 4 contacts per patient) in various cortical and subcortical locations. This study focused on a subset of electrode contacts that were active in the task and showed clear visually evoked potentials and induced gamma responses, similar to the responses studied in animals (Singer, 1993; Fries, 2009; Ray and Maunsell, 2011) and in humans (Tallon-Baudry and Bertrand, 1999; Jensen et al., 2007). Out of 459 occipital cortical contacts, from 37 patients, 148 showed induced responses to word presentation in the low gamma (32.2%), 214 in the high gamma (46.6%), and 229 in the epsilon (49.9%) frequency band. The electrode contacts in the occipital lobe had the highest proportion of active electrodes compared to all other brain lobes. These active occipital contacts comprised 19.3%, 15.9%, and 17.3% of all active brain electrode contacts showing induced task responses. The majority of the active contacts were localized in Brodmann areas 18 and 19 of the middle occipital gyrus (Table 1), corresponding to the extrastriate or associative portions of the visual cortex responsible for processing higher order stimuli including words and images.
Anatomical localization of the active electrode contacts by Brodmann area and cortical gyri
| BA 17 | BA 18 | BA 19 | BA 30 | BA 31 | BA 37 | Middle occipital | Lingual | Cuneus | Fusiform | Middle temporal | Inferior occipital | Inferior temporal | Superior occipital | Precuneus | |
|---|---|---|---|---|---|---|---|---|---|---|---|---|---|---|---|
| LG | 7 | 55 | 72 | 3 | 2 | 9 | 66 | 28 | 24 | 13 | 1 | 9 | 4 | 1 | 2 |
| HG | 9 | 71 | 112 | 3 | 5 | 14 | 89 | 39 | 27 | 22 | 10 | 8 | 8 | 6 | 5 |
| EP | 9 | 82 | 114 | 2 | 6 | 15 | 93 | 42 | 30 | 26 | 10 | 9 | 7 | 6 | 6 |
Total number of electrode contacts that showed induced responses to word presentation in a given frequency band are summarized for specific areas arranged in the sequence of visual information processing, and for specific gyri arranged from the highest to the lowest counts. Notice that most of the active contacts were localized in the Brodmann areas (BA) 19 and 18 of the extrastriate cortex, and most of the active contacts were localized in the extrastriate portion of the middle occipital gyrus. EP = epsilon; HG = high gamma; LG = low gamma.
Overall, these active occipital cortical contacts yielded a total of 211 070 low gamma, 398 571 high gamma, and 534 595 epsilon GA detections (average detection rates: 1.1 Hz, 1.6 Hz, and 2.0 Hz, respectively) that were analysed in this study. Individual GA were detected as discrete bursts of power in the frequency-time space as shown in humans and non-human primates (Kucewicz et al., 2014; Lundqvist et al., 2016). Based on previously published methodology (Canolty et al., 2006; Matsumoto et al., 2013; Kucewicz et al., 2014) we constructed frequency-time plots for every data epoch by band-pass filtering the iEEG signal in narrow frequency bands and calculating the normalized Hilbert spectral amplitude (Kucewicz et al., 2014, Fig. 1). These plots were then used to estimate the frequency span of each GA detection (Fig. 2 and Supplementary Fig. 1) as well as other properties.
GA detections were classified into narrowband or broadband categories based on their frequency span values independently for every electrode. Classification of GA events into narrow or broad frequency span was remarkably consistent, separating regular narrowband events from broadband events (Fig. 3). For any of the studied electrode contacts, narrowband events comprised on average 83% of low gamma, 78% of high gamma, and 74% of epsilon detections, leaving 17%, 22% and 26% broadband GA events, respectively. The distribution of the narrowband frequency spans showed a central peak with a frequency span between 10–20 Hz (Fig. 3), which was consistent across all electrode channels and subjects (Supplementary Fig. 2). The distribution of the frequency span values of the broadband events was more varied and skewed with a long tail extending toward high frequency span values (Fig. 3).
This profile of distributions of the frequency span values and relative proportions of the two GA types was also observed in other cortical structures (Supplementary Fig. 3) and was confirmed with another clustering algorithm approach (Supplementary Fig. 4). The same pattern was also reflected in the distributions of centroids used for clustering the frequency spans into narrowband and broadband detections (Supplementary Fig. 5). Narrowband GA centroids had their range confined to 10–30 Hz with few outliers, contrasted to ∼30–100 Hz range of broadband GA centroids with numerous outliers beyond the 100 Hz range (Supplementary Fig. 5). Ranges of the centroid distributions did not overlap. To summarize, narrowband GAs showed a regular frequency span as compared to the broadband events, which were more variable. Specific values of the frequency span, as well as the relative proportions of the broadband GAs, were observed to increase with increasing GA frequencies of the low gamma, high gamma and epsilon bands.
Consistent separation of GA bursts with low and high frequency span does not necessarily mean, however, that they are qualitatively different. Therefore, we assessed the effect of the frequency span on duration and amplitude of every low gamma, high gamma and epsilon band detection (Fig. 4). The durations of GA bursts were very weakly correlated (R < 0.1) with frequency span in all three bands (P < 0.001; R = −0.061, −0.062, −0.011 for low gamma, high gamma and epsilon bands, respectively). Amplitude, on the other hand, was positively correlated with the frequency span (Pearson correlation coefficient, P < 0.001, R = 0.776, 0.774, 0.777 for low gamma, high gamma and epsilon bands, respectively). Within each frequency band, GA detections with low frequency span had longer duration and shorter amplitude than the ones with high frequency span (Wilcoxon rank sum test, P < 0.001). Narrowband as well as broadband detections had significantly different duration and amplitude when compared across the three frequency bands (P < 0.001), e.g. duration of low gamma narrowband events was longer than high gamma and epsilon narrowband events, or amplitude of epsilon broadband events was higher than high gamma and low gamma broadband events. These results show that GAs of narrow and broad frequency spans are qualitatively different both within and across the three studied frequency ranges.
Having established that the narrowband and broadband GA events had different properties, we investigated their physiological origins and association with memory tasks. Presentation of words induced different responses of the two GA types. Broadband GAs were primarily induced immediately after word onset exhibiting a sharp peak in the detection count, in contrast to a later and more gradual induction of narrowband GAs (Fig. 5). This pattern of GAs was most prominent in the high gamma and epsilon band—the latter showed a 10-fold increase from baseline in probability of a broadband GA detection 30 ms after word onset, compared to only a 2-fold increase in the subsequent narrowband detection peak (Fig. 5B). At that time in the task, the relative proportion of the broadband events increased from a baseline of ∼20% to 50% of all detected GAs, meaning that vice versa the proportion of narrowband detections dropped from baseline of 80% to 50% and that the two types contributed equally to this peak of induced gamma response. Latencies of the peak broadband responses to word presentation were consistently shorter than the narrowband in all three frequency bands (Wilcoxon rank sum test, P < 0.001 for all comparisons) and followed a time course analogous to multi-unit activity spiking reported in humans (Self et al., 2016). There was also a general relationship between the peak latencies and frequency bands (Fig. 5C), with the higher the frequency, the shorter the latency (Wilcoxon rank sum test, P < 0.001 for all comparisons), as reported in our previous study (Kucewicz et al., 2014). This trend across the three bands was also holding for latencies of all GA detections of narrowband as well as broadband type (Wilcoxon rank sum test, P < 0.001) with exception of high gamma and epsilon broadband GAs (P = 0.22).
Given that the latencies of the sharp broadband epsilon response were in the range of ERP in the occipital cortex, we tested whether the two phenomena are related. We first checked if GA detections of a given type consistently occur on any specific phase of the ERP waveforms by calculating coherence of the detections with the slow frequency oscillations. Active electrode contacts revealed selective phase-locking of broadband GAs to 4–8 Hz oscillation at the time of ERP and word presentation (Fig. 6A), which was highest for the broadband GAs in the epsilon frequency band (Wilcoxon signed rank test, P < 0.001; Fig. 6B and Supplementary Fig. 6). The size of the ERP was positively correlated with counts of both narrowband and broadband GA responses (Pearson correlation coefficient, P < 0.001, R = 0.450 and 0.560, respectively). On the other hand, only the peak response values of the broadband GAs were correlated with the ERP size (Pearson correlation coefficient, P < 0.001, R = 0.010 and P = 0.26, 0.500, respectively), suggesting that the sharp broadband GA response may be causally related and thus phase-locked to ERP.
Changes in gamma power have previously been shown to predict successful memory encoding (Sederberg et al., 2003, 2007) and bursts of GAs shown to be associated with working and recognition memory (Kucewicz et al., 2014; Lundqvist et al., 2016). To assess involvement of the two GA types in memory processing, we looked at their relative contribution to subsequent memory effect (SME) by comparing GA counts during encoding epochs of words that were subsequently recalled compared to those that were not recalled. There was no SME in the low gamma band either for the narrowband, or broadband, or both GA types combined (Fig. 7). In the higher frequency bands (high gamma, epsilon, and both combined), we observed a positive SME, i.e. significantly more GA detections during epochs with subsequently remembered versus forgotten words, for both narrowband and broadband GAs detected in the first 800 ms of word presentation (Wilcoxon Rank Sum test, P = 0.0098 and P = 0.0078, respectively). The magnitude of this effect was higher for the narrowband GAs (Wilcoxon Rank Sum test, P = 0.0429) and peaked later than the broadband SME (broadband: +400 ms, narrowband: +600 ms; Fig. 7). There was a consistent pattern of initial negative trend in SME, i.e. less GA detections during epochs with subsequently recalled words, followed by a positive SME trend in response to word presentation, and a switch back to negative SME toward the end of word encoding period (Fig. 7). This pattern was present in both low gamma and the higher frequency bands, despite different timelines for the switching of SME direction.
Discussion
In this multi-centre collaborative study we took advantage of a large dataset of human intracranial recordings to quantify and characterize gamma frequency neural activities induced during word presentation and memory encoding. Over one million detections were collected from short word presentation epochs in the occipital cortex to test the hypothesis about different spectral characteristics of GAs. Our results reveal a heterogenous population of discrete bursts of power in low gamma, high gamma and epsilon frequency ranges. The GA events have different spectral properties, which cluster into two distinct subpopulations—one with a narrow frequency span centred on a specific frequency peak, consistent with a discrete oscillation in the local field potential, and the other population with a broad frequency span extending over a wide range of gamma frequencies. There was no clear frequency boundary separating the narrowband and the broadband GAs—both were present in all three gamma bands but their relative proportions showed marked differences across the frequency bands. The two GA types have previously been reported in human intracranial recordings—the former was associated with coordinated oscillations in synaptic field potential, and the latter with synchronized multi-unit firing (Manning et al., 2009; Miller et al., 2009, 2014; Ray and Maunsell, 2011; Waldert et al., 2013). It has remained unclear, however, to what extent each GA type contributes to gamma frequency power in the iEEG signal and the significance, if any, to underlying processes engaged during memory encoding.
Electrophysiology of gamma frequency activities
The subpopulation of narrowband GAs was remarkably consistent across different electrodes and brain structures in each of the three frequency bands. These narrowband GAs comprised the majority of all detections with the highest proportion in the low gamma band, which was gradually decreasing in the high gamma and epsilon bands while the other broadband GAs subpopulation was increasing (from 17% low gamma to 26% epsilon GAs, Fig. 3). This trend is in agreement with a prevailing view that power in low gamma frequency bands (<60 Hz) reflects mainly oscillatory activity, whereas higher frequencies in the epsilon bands and above (>100 Hz) are contaminated with spiking activity from populations of neurons (Ray and Maunsell, 2011; Belluscio et al., 2012; Schomburg et al., 2012). Spectral analysis of extracellular spike waveforms can produce broadband power in frequencies down to 100 Hz (Zanos et al., 2012), but the exact frequency ranges affected by spiking activity will depend on the waveform of a particular neuron type—sharp waveforms have higher frequency components compared to broader waveforms. Moreover, increased spike synchrony and firing rates can shift this boundary even into gamma frequency bands (Ray et al., 2008; Ray and Maunsell, 2011; Waldert et al., 2013) if the narrowband oscillatory activity is weak or absent. Therefore, our observed proportions of broadband GAs gradually rising with the frequency ranges could be explained by increasing contribution from spiking activity. Frequency bands higher than those studied here are predicted to carry proportionally more spiking activity and fewer oscillations with the latter detected up to 600 Hz in a similar task (Kucewicz et al., 2014), which is a standard lower boundary for detecting ‘pure’ neuronal spiking activity (600–6000 Hz).
There are also other non-oscillatory sources of gamma frequency power in human intracranial recordings. Band-pass filtering of any sharp transition in the signal will produce broadband power increase with a frequency span dependent on the transition’s gradient. For instance, myogenic activity from oculomotor and cranium foramen muscles was shown to generate biphasic sharp potential transients at the onset of a saccade generating a broadband power increase in 20–200 Hz range (Jerbi et al., 2009; Kovach et al., 2011). Interictal epileptiform discharges (also known as epileptiform spikes) also produce broadband power in this patient population, in addition to all other sources of extracranial muscle activity associated with blinking, grimacing or chewing (for review see Worrell et al., 2012), or artefacts related to, for example, visual display (Williams et al., 2004). In this study, we were careful to remove these non-specific activities from the analysis using methods described previously (Ball et al., 2009; Worrell et al., 2012; Kucewicz et al., 2014). The detected events showed consistent trends in their duration and amplitude as a function of frequency (Fig. 4), unlike what would be predicted for the non-specific sources of gamma frequency power.
To summarize, it is possible to separate GAs from other non-specific extra- and intra-cranial sources of gamma frequency power, as well as the specific narrowband and broadband neuronal activities (Buzsáki and Wang, 2012; Cimbalnik et al., 2016). So far the two GA types have been predominantly separated into disparate frequency ranges, e.g. 30–70 Hz for what mostly composes of gamma oscillations, and 70–200 Hz for mostly non-oscillatory high gamma and epsilon activities (Burke et al., 2015). Data from our study and others (Zanos et al., 2011; Belluscio et al., 2012; Schomburg et al., 2012) show that the two frequency ranges overlap and cannot be separated into distinct bands (Scheffer-Teixeira et al., 2013; Waldert et al., 2013). Separating different types of GAs may prove crucial for electrophysiological biomarker applications, including mapping and modulation of specific electrophysiological processes that underlie particular brain functions in health and disease (Stacey, 2015; Cimbalnik et al., 2016).
Roles of narrowband and broadband gamma frequency activities
If the narrowband and broadband GAs have different physiological origins, they may play specific roles in stimulus processing in the tasks. Both were induced by stimulus presentation in extrastriate areas of the middle occipital and lingual gyrus, which are associated with processing of higher order visual stimuli, including words and images. Both GA types exhibited an initial peak response followed by maintained elevated counts throughout the whole period of word encoding (Fig. 4). The latencies of these induced responses were different, however. Broadband activities peaked earlier with latencies of multi-unit spiking response (Self et al., 2016), suggesting that stimulus-induced non-oscillatory neural activities precede coordinated oscillations of neuronal networks. GAs in the highest epsilon frequencies were the first to be induced followed by the lower frequencies as previously reported (Kucewicz et al., 2014). The broadband epsilon GAs were also tightly coupled to evoked response potentials—they were phase-locked to the ERP waveform and their rate was correlated with the ERP amplitude, unlike the narrowband GA counterparts (Fig. 6). We observed that the higher the rate of induced GA detections, the greater the ERP amplitude, which may indicate how close a given electrode contact was to neuronal networks generating the ERP. Selective correlation and phase-locking of the peak broadband GA response with the ERP could reflect a common generating source, like synchronized spiking of large neuronal populations (David et al., 2006). Our data thus support a view that stimulus presentation first induces a surge of multi-unit spiking activity, which is subsequently followed by coordinated activity of synchronized neuronal assemblies, giving rise to oscillations in the local field potential. This proposed sequence of events is consistent with recent microelectrode recordings in humans (Self et al., 2016) and can be tested with combined micro- and macroelectrode recordings of spiking activity and local field potential (Kucewicz et al., 2016).
A recent study using microelectrode recordings in rats found that GAs in the epsilon frequency ranges (>100 Hz) reflect both neuronal spiking and network oscillations, which were separated based on their preferred coupling to theta rhythm in the hippocampus (Scheffer-Teixeira et al., 2013). The authors have also separated them based on their frequency span. Our data reveal analogous phase-locking of broadband GAs recorded with clinical subdural and penetrating macro-electrodes, and differences in ERP phase-locking at theta frequencies (4–8 Hz). In contrast, we observed much weaker theta phase-locking of narrowband GAs (Fig. 6). Thus the two GA types appear to be engaged in different network processes both in humans and rodents. But the exact functions they serve, e.g. sensory perception, attention or memory, remain unclear.
In this study, we have also looked at the relative contribution of the two GA types to the SME. Instead of comparing different stimulus patterns, we compared counts of narrowband and broadband GA detections induced on trials with words that were subsequently recalled and those that were not. Both GA types showed the memory effect in the high gamma and epsilon band during the critical epoch of induced response to word presentation. SME for the narrowband GAs was greater than for broadband GAs and peaked later ∼600 ms after word onset (Fig. 6). The relevance of these differences in successful memory encoding remains to be further investigated. This pattern of differential SME modulation confirms the same temporal profile of broadband GAs preceding narrowband GAs, and presumably reflecting different neural processes supporting memory encoding.
Gamma frequency activities as a biomarker of neuronal assemblies
Most of the low gamma, high gamma and epsilon GA detections were composed of narrowband oscillations, which have been associated with various cognitive functions including perception, attention and memory (Singer, 1993; Tallon-Baudry and Bertrand, 1999; Jensen et al., 2007). Gamma frequency oscillations have been proposed to reflect the coordinated activity of neuronal assemblies that effectively acts as a ‘clocking’ mechanism to time information processing on the phase of a given oscillation (Fries, 2009). This hypothesis has been disputed based on arguments that gamma oscillations exhibit low and inconsistent power and phase (Burns et al., 2011; Xing et al., 2012; Ray and Maunsell, 2015) and can be better explained with stochastic spiking activity and not a coordinated oscillation. Others have argued that gamma oscillations should not work like a perfect clock or metronome as it would limit their adaptive phase-coding flexibility (Nikolić et al., 2013). The narrowband induced GA oscillations that we detected agree with this general picture with lower amplitude than the broadband GAs, but longer duration and a specific centre frequency. The duration and frequency of the narrowband GAs satisfy the requirements for proposed roles of gamma oscillations in mechanisms of synaptic plasticity and memory formation (Fries, 2009; Düzel et al., 2010; Buzsáki and Wang, 2012), and have been shown to be modulated by cognitive processes engaged in a recognition memory task in humans (Kucewicz et al., 2014) and in spatial working memory in monkeys (Lundqvist et al., 2016). So even though their role in timing of information processing in the brain is unclear, narrowband GAs are likely to reflect coordinated activity of neuronal assemblies supporting cognitive processes.
Hence, GAs provide a potential biomarker for mapping, targeting, and modulating neuronal assemblies at high temporal resolution during memory and cognition (Lachaux et al., 2012; Burke et al., 2015; Johnson and Knight, 2015). Both narrowband and broadband GAs can be used to track different neuronal assembly activities: the former network oscillations, the latter synchronized multi-unit neuronal firing. It is important though to separate them from each other and from other non-specific activities generating high-frequency power (Stacey et al., 2009), if they are to be used as effective biomarkers of specific physiological processes. One potential application is in localization of neuronal networks generating epileptiform discharges and seizures (Worrell et al., 2012; Cimbalnik et al., 2016) that should benefit from separating physiological GA activities induced in cognitive tasks from pathological activities (Stacey, 2015). Another application is to use GAs for mapping networks forming declarative memories, and modulating their activities through therapeutic stimulation. In summary, emerging neurotechnologies may benefit from sampling and targeting specific GA types to map both physiological and pathological networks, and could ultimately improve therapies directed at memory and epilepsy.
Abbreviations
- ERP
evoked response potential
- GA
gamma frequency activity
- iEEG
intracranial electroencephalography
- SME
subsequent memory effect
Acknowledgements
We would like to thank: Cindy Nelson and Karla Crockett (Mayo Clinic) for their help in recruiting patients, organizing the study, and technical assistance in data acquisition; Dr Mehraneh Khadjevand and Laura Miller (Mayo Clinic) for their contribution to data collection and processing; Isaac Pedisisch, Anastasia Lyalenko and Deborah Levy (University of Pennsylvania) for their assistance in transferring, storing and processing data; Dr Youssef Ezzyat (University of Pennsylvania) and Dr John Wittig (National Institute for Neurological Disorders and Stroke) for providing Matlab code and their suggestions for data analysis. This work is dedicated to work and memory of Anastasia Lyalenko (http://memory.psych.upenn.edu/Anastasia_Lyalenko_Memorial_Fund).
Funding
This work was supported by the Defense Advanced Research Project Agency Restoring Active Memory (RAM) program (Cooperative Agreement N66001-14-2-4032), as part of the BRAIN initiative (Brain Research through Advancing Innovative Neurothechnologies). The views, opinions, and/or findings contained in this material are those of the authors and should not be interpreted as representing the official views or policies of the Department of Defense or the U.S. Government. V.K. was additionally supported by institutional resources for research by the Czech Technical University in Prague, Czech Republic, and the Czech Science Foundation: grant No. 17-20480S.
Supplementary material
Supplementary material is available at Brain online.

