


There are no generally accepted protocols for post-mortem assessment in cases of suspected vascular cognitive impairment. Neuropathologists from seven UK centres have collaborated in the development of a set of vascular cognitive impairment neuropathology guidelines (VCING), representing a validated consensus approach to the post-mortem assessment and scoring of cerebrovascular disease in relation to vascular cognitive impairment. The development had three stages: (i) agreement on a sampling protocol and scoring criteria, through a series of Delphi method surveys; (ii) determination of inter-rater reliability for each type of pathology in each region sampled (Gwet’s AC2 coefficient); and (iii) empirical testing and validation of the criteria, by blinded post-mortem assessment of brain tissue from 113 individuals (55 to 100 years) without significant neurodegenerative disease who had had formal cognitive assessments within 12 months of death. Fourteen different vessel and parenchymal pathologies were assessed in 13 brain regions. Almost perfect agreement (AC2 > 0.8) was found when the agreed criteria were used for assessment of leptomeningeal, cortical and capillary cerebral amyloid angiopathy, large infarcts, lacunar infarcts, microhaemorrhage, larger haemorrhage, fibrinoid necrosis, microaneurysms, perivascular space dilation, perivascular haemosiderin leakage, and myelin loss. There was more variability (but still reasonably good agreement) in assessment of the severity of arteriolosclerosis (0.45–0.91) and microinfarcts (0.52–0.84). Regression analyses were undertaken to identify the best predictors of cognitive impairment. Seven pathologies—leptomeningeal cerebral amyloid angiopathy, large infarcts, lacunar infarcts, microinfarcts, arteriolosclerosis, perivascular space dilation and myelin loss—predicted cognitive impairment. Multivariable logistic regression determined the best predictive models of cognitive impairment. The preferred model included moderate/severe occipital leptomeningeal cerebral amyloid angiopathy, moderate/severe arteriolosclerosis in occipital white matter, and at least one large infarct (area under the receiver operating characteristic curve 77%). The presence of 0, 1, 2 or 3 of these features resulted in predicted probabilities of vascular cognitive impairment of 16%, 43%, 73% or 95%, respectively. We have developed VCING criteria that are reproducible and clinically predictive. Assuming our model can be validated in an independent dataset, we believe that this will be helpful for neuropathologists in reporting a low, intermediate or high likelihood that cerebrovascular disease contributed to cognitive impairment.
There is no generally accepted protocol for post-mortem assessment of suspected vascular cognitive impairment. Skrobot et al. describe the multicentre development and validation of the first such set of guidelines. They present a simple scheme for assigning a low, intermediate or high likelihood that cerebrovascular disease contributed to cognitive impairment.
Introduction
The spectrum of vascular cognitive impairment (VCI) encompasses mild cognitive deficits that do not necessarily progress to dementia, and includes post-stroke dementia, vascular dementia, subcortical ischaemic vascular dementia, multi-infarct dementia and mixed dementias (i.e. co-morbid neurodegenerative and vascular pathology) (O'Brien et al., 2003). VCI may be suspected if there is widespread disease of cerebral blood vessels (e.g. atherosclerosis, arteriolosclerosis or cerebral amyloid angiopathy (CAA), focal or diffuse ischaemic changes or foci of haemorrhage, particularly in the absence of an alternative pathological explanation for cognitive decline (Ferrer, 2010). However, these pathological abnormalities often occur, at least to some degree, without apparent cognitive impairment (Fernando et al., 2004; Grinberg and Thal, 2010; Thal et al., 2012) and become more prevalent with increased age (Jellinger and Attems, 2010). They are also very common in patients with Alzheimer’s disease and other neurodegenerative dementias, and probably lower the threshold for neurodegenerative dementia (Esiri et al., 1999; Schneider et al., 2004, 2009).
Various protocols and definitions have been proposed to identify and categorize different types of cerebrovascular pathology in relation to dementia (Esiri et al., 1997; Chalmers et al., 2003; Kalaria et al., 2004; Love, 2005; Strozyk et al., 2010; Deramecourt et al., 2012; Montine et al., 2012; Richardson et al., 2012; Smallwood et al., 2012). Currently there are no widely accepted neuropathological criteria for the post-mortem diagnosis of VCI or vascular dementia. This poses a problem for prevalence estimates and comparison and collaboration of research and is in contrast to other types of dementia, such as Alzheimer’s disease (Braak and Braak, 1991; Mirra et al., 1991) and dementia with Lewy bodies (McKeith et al., 2005). Highlighting these issues, a systematic review of neuropathological studies of cerebral microinfarcts in the context of vascular disease found large variability in characteristics of microinfarcts reported in the different studies and highlighted the obvious need for standardization of neuropathological criteria to allow comparison of findings in different centres (Brundel et al., 2012). Other surveys of post-mortem neuropathological assessment in centres across the world have revealed wide differences in the definitions, sampling procedures and interpretation of vascular pathology (Pantoni et al., 2006; Alafuzoff et al., 2012). The importance of establishing evidence-based, objective criteria for post-mortem evaluation of the contribution of cerebrovascular disease to cognitive impairment is widely acknowledged (Jellinger, 2008, 2013; Grinberg and Heinsen, 2010; Alafuzoff et al., 2012). The aim of the present study was to develop a set of vascular cognitive impairment neuropathology guidelines (VCING) that represented a consensus approach to the post-mortem assessment and scoring of cerebral vascular disease in relation to VCI, and was supported by objective evidence of clinical relevance.
Materials and methods
Stage 1: Delphi study
Fourteen UK-based neuropathologists, mainly from the BDR network (http://brainsfordementiaresearch.co.uk), were invited to participate in a survey to agree on a protocol to: (i) assess; and (ii) report cerebrovascular disease; with a view to (iii) analysing which types of vascular pathology that could be reliably assessed best predicted cognitive impairment. Nine neuropathologists accepted the invitation. A Delphi survey (Linstone, 1975; Ferri et al., 2005) was conducted using an online survey tool (Bristol Online Surveys (https://www.onlinesurveys.ac.uk/) hosted by the University of Bristol. Survey responses were anonymous and were collated and analysed by an independent facilitator (O.A.S.). Responses informed questions for each subsequent round. The questions were presented to participants together with a summary of the previous results and comments on areas of agreement and disagreement. This process was iterated until consensus was achieved or when over half of the respondents agreed on one option amongst several. A two-thirds majority was sought for bimodal questions (percentages of respondents are provided where appropriate). Nine rounds of the survey were conducted. Rounds 1 and 2 assessed familiarity with previously published protocols (and directed participants unfamiliar with any protocols to the relevant publications) and prioritized a series of issues that should be resolved to formulate the VCING (Supplementary Table 1). Rounds 3–7 achieved agreement on definitions, terminologies and sampling procedures, based on published definitions and procedures or suggestions by the participants. The last two rounds were used to agree the final integrated protocol, after participants had an opportunity to review and comment on previous rounds of the survey.
Stage 2: Reproducibility study
Nine of the original 14 neuropathologists agreed to participate in the next two stages of the study, which were funded by a Network Cooperation grant from Alzheimer’s Research UK.
The neuropathologists assessed post-mortem brain tissue, according to VCING, blind to any previous clinical or pathological diagnoses. One hundred and thirteen cases [52 females/61 males, age (mean ± SD) 83.40 ± 8.95 (range 55–100)] were obtained from the Oxford Brain Bank and the Newcastle Brain Tissue Resource (NBTR) (Table 1 and Supplementary Table 2). All were Caucasians from the regional UK populations served by the two centres. The cohort comprised consecutively collected brains from autopsies with consent for brain donation that fulfilled the following criteria. The principal inclusion criterion was formal cognitive assessment, in most cases including the Mini-Mental State Examination (MMSE), within 12 months of death, in a memory or vascular clinic. Exclusion criteria were the presence of substantial Alzheimer’s disease (Braak tangle stage > III) (Braak and Braak, 1991), Lewy body pathology (Braak Lewy body stage > 3) (McKeith et al., 2005) or other non-vascular neurological disease. In four cases we could exclude Braak tangle pathology of stage IV or higher but did not have adequate histology of the transentorhinal region and subiculum for precise staging. The cases included blocks of all of the brain regions specified in the VCING protocol. Formalin-fixed paraffin-embedded sections that were from the VCING-specified brain regions and had been stained with haematoxylin and eosin, or Luxol® fast blue (to assess myelin loss), or immunolabelled for amyloid-β with Chemicon 4G8 (to assess CAA), were circulated between the seven participating UK centres.
Cohort details: mean age, gender and clinical diagnosis
| Cohort details | n = 113 |
| Mean age ± SD (range) | 83.40 ± 8.95 (55–100) |
| Gender (M/F) | 61/52 |
| Clinical diagnosis ‘cognitive impairment’ | 48 |
| Stroke with dementia (11)/with mild dementia (2) | 13 |
| Dementia | 9 |
| VaD (3)/probable VaD (3) | 6 |
| Multi-infarct dementia (MID) | 1 |
| Possible dementia with white matter disease | 1 |
| Probable AD (2)/Possible AD (3) | 5 |
| Possible DLB | 1 |
| Mild dementia with parkinsonism or AD or DLB | 1 |
| Psychiatric disorder/dementia | 3 |
| Mild cognitive impairment | 8 |
| Clinical diagnosis ‘no cognitive impairment’ | 65 |
| Cognitively normal (healthy) | 31 |
| Cognitively normal (study-irrelevant health problems) | 5 |
| Stroke, no dementia | 16 |
| Cardiovascular disease | 2 |
| Parkinson's disease | 2 |
| Psychiatric illness | 8 |
| Mental 'lethargy' | 1 |
| MMSE score mean ± SD (range) (n = 100) | 23.03 ± 7.05 (0–30) |
| MMSE score <27/≥27 | 48/52 |
| Braak stage: | |
| 0 | 8 |
| I–II | 76 |
| III–IV | 26 |
| Genotype data (n = 77) | |
| APOE ε4 allele frequency | 0.14 |
| APOE ε2 allele frequency | 0.06 |
MMSE score, Braak tangle stage and APOE allele frequencies were available for most cases (figures shown). AD = Alzheimer’s disease; DLB = dementia with Lewy bodies; TIA = transient ischaemic attack; VaD = vascular dementia.
Inter-rater reliability was tested by calculating Gwet’s AC2 coefficient (Gwet, 2008) for each pathology in each region. This method is a more appropriate alternative to the conventional Kappa’s coefficient when there are marked unbalanced marginal totals, i.e. very rare presentation of some pathologies when the majority of samples have no pathology. In these scenarios it has been shown that one can have a high level of concordance but low kappa values as a statistical artefact (Feinstein and Cicchetti, 1990). The calculations were performed using AgreeStat 2015.2 program (Advanced Analytics, LLC). Quadratic weights were assigned for scale scoring schemes, a coefficient of 1 indicating full agreement (exact same score by all participants). We used the benchmarks proposed by Landis and Koch (1977) to evaluate the extent of agreement for the AC2 coefficient (>0.4 indicating moderate, >0.6 substantial and >0.8 almost perfect agreement). Due to small numbers, scoring schemes with more than two levels of severity were dichotomized to produce more robust parameter estimates for stage 3.
Stage 3: Validation study
Multivariable logistic regression analysis was undertaken to assess the contribution of vascular pathologies to cognitive impairment (STATA 14, StataCorp LP, Texas, USA). The primary outcome variable was a clinical diagnosis of dementia or mild cognitive impairment (henceforth collectively termed ‘cognitive impairment’). As a sensitivity analysis, we also ran analyses using a cut-off of MMSE < 27 (Pendlebury et al., 2012). We calculated the median vascular scores (both region-specific and global) across raters for each type of pathology and brain region. Any cases with fewer than four raters per pathology/area were excluded.
We used a two-stage modelling process. We assessed which pathologies in which brain regions were associated with both outcomes, initially by univariable regression analysis. If multiple brain regions were significantly associated for a particular pathology and not highly co-linear, as tested by chi-square analysis, we used a stepwise multivariable model to identify in which region(s) the particular pathology best predicted cognitive impairment. Bimodal variables were also created for the presence of a particular pathology in at least one of the brain regions (termed ‘global’ variables). Because of the small sample size, with some cells having zero observations, we used exact (exlogistic command in Stata) rather than conventional logistic regression. This method uses the conditional distribution of the parameter-sufficient statistics and the conditional maximum likelihood estimates as an alternative to maximum likelihood estimation, which can perform poorly for small sample sizes. In addition, where the outcome variable is completed determined by the exposure, exlogistic computes the median unbiased estimate, the regression estimate that places the observed sufficient statistic at the median of the conditional distribution.
In the second stage, the best predictors from stage 1 were entered into a stepwise multivariable regression model with cognitive impairment as the dependent variable. The best combined model was used to calculate diagnostic utilities, area under the receiver operating characteristic (ROC) curve and predicted probabilities using the presence and absence of the key pathological features. This was then repeated with the secondary outcome (MMSE < 27). Finally as a post hoc exploratory analysis, we wanted to see if the predictive value of the best model differed by age of the subjects and we tested for age and pathology interactions, having dichotomized age at the median.
Results
Stage 1: Delphi study
In the first survey, we presented previously published protocols for neuropathological assessment in suspected vascular dementia, identified by literature review, to the participants. Participants were asked to state their familiarity and use of these protocols and to critique their utility. Results from Round 1 were presented to the participants in the subsequent round. After review of these results, respondents selected the best papers upon which to base discussions to formulate VCING. The five most supported (≥75%) papers were: Esiri et al., 1997; Strozyk et al., 2010; Deramecourt et al., 2012; Montine et al., 2012; and Smallwood et al., 2012. Other papers that had been considered were those by Chui et al., 1992; Román et al., 1993; Vinters et al., 2000; Halliday et al., 2002; White et al., 2002; Kalaria et al., 2004; Love, 2005; Hachinski et al., 2006; Gold et al., 2007; and the NACC Neuropathology Diagnosis Coding Guidebook of the ADC Clinical Task Force and the National Alzheimer’s Coordinating Center (ADC Clinical Task Force and the National Alzheimer’s Coordinating Center, 2008). Respondents suggested additions or amendments to improve the usefulness of the protocols in the selected papers. The consensus was that there should be assessment of vessel wall pathology, separate from and additional to assessment of presumed ischaemic tissue damage; both large and small vessel disease; haemorrhagic lesions as well as presumed ischaemic ones; and that there should be separate scoring systems for quantifying severity of vessel wall pathology and tissue damage.
In Round 2, participants were also asked to prioritize the immediate and longer term objectives of VCING. The immediate objectives selected by ≥75% of respondents became the focus for Rounds 3–7 (Supplementary Table 1). The topics and key points covered in each round are summarized in Supplementary Fig. 1.
Definitions
Three of the top five immediate objectives were to develop consensus definitions. Agreed definitions are presented in Table 2. Greater discussion was required as to the distinction between arteriosclerosis and arteriolosclerosis. This was prompted by the definition presented in Deramecourt et al. (2012). Although supported by a majority (75%) in Round 3, the definition was noted by one participant to relate to arteriolosclerosis rather than arteriosclerosis. Another respondent suggested that it was sufficient to identify hyaline thickening of the vessel wall with loss of tunica media even in the absence of obvious narrowing of the lumen to diagnose arteriosclerosis. After review of this feedback, consensus support (67%) was received for the definition ‘hyaline thickening of walls of vessels <150 μm in diameter, not associated with lipid vacuole-containing cells in the tunica media’. Two respondents suggested additions to the agreed definition of arteriolosclerosis that were presented to the participants in the following round. A majority (62.5%) of Round 6 respondents were in favour of including one of the suggestions: ‘Diagnosis requires the absence of inflammation, amyloid or fibrinoid necrosis’.
Delphi study agreed definitions
| Agreed definitions | |
|---|---|
| Atherosclerosis/atheroma | Disease of medium-sized to large arteries at the base of the brain, characterized by formation of plaques showing varying degrees of destruction of the vessel wall and accumulation of lymphocytes and macrophages; in later stages plaques may contain necrotic core, cholesterol clefts and foci of calcification. |
| Arteriolosclerosis | Hyaline thickening of walls of vessels <150 μm in diameter, not associated with lipid-containing cells replacing the tunica media. Diagnosis requires an absence of intramural inflammation, amyloid or fibrinoid necrosis. |
| Large infarct | Maximum diameter >1 cma. |
| Lacunar infarct | Cystic lesion visible to the naked eye but <1 cm in diametera. |
| Microinfarct | Ischaemic lesion found on microscopic examination but not visible to the naked eyea. |
| Large haemorrhage | Haemorrhagic lesion visible to the naked eye which is easily identifiable on macroscopic examination. |
| Microhaemorrhage | Haemorrhagic lesion (with parenchymal involvement) found on microscopic examination which is not visible to the naked eye. |
| White matter pallor | A reduction in myelin staining in white matter in Luxol fast blue stained sections. |
| White matter rarefaction | Weakly stained/pale and loose appearance of myelinated fibres. |
Definitions were developed amongst respondents through multiple survey rounds, apart from those that were taken from Strozyk et al. (2010)a.
Separate designation of microinfarcts and microhaemorrhages
All Round 3 respondents stated that they could usually distinguish between microinfarcts and microhaemorrhages. However, opinion was split (50%) as to whether they should all be co-designated as microvascular lesions, as proposed by Montine et al. (2012), as this would prevent later determination of the separate contribution of these individual types of lesion to cognitive dysfunction. After subsequent feedback in Round 4, all respondents agreed that microinfarcts and microhaemorrhages should be separately recorded. Microhaemorrhage was distinguished from perivascular haemosiderin leakage by the accumulation of haemosiderin in the brain parenchyma.
Sampling procedures
The majority of Round 3 respondents (88%) supported the sampling of a specified set of blocks from one hemisphere but with additional sampling of macroscopic lesions. All respondents agreed on the utility of staining with haematoxylin and eosin, and Luxol fast blue. Only 25% of respondents supported the additional use of silver impregnation for axons (Bielschowsky/Bodian/Palmgren). In addition to the stains listed, immunolabelling of amyloid-β or staining of sections with Congo red was suggested. Eighty-six per cent of Round 4 respondents thought that sections should routinely be immunolabelled for amyloid-β and 57% of respondents suggested the use of Chemicon clone 4G8 for this. After feedback of these results, all respondents in Round 5 agreed to the use of Chemicon clone 4G8 for immunolabelling of amyloid-β.
A wide range of possible brain regions to be sampled were considered for inclusion in VCING. Those supported by a majority (≥63%) are listed in Table 3. The subsequent round elicited additional comments concerned the sampling of cerebral white matter regions. Eighty-six per cent of respondents felt that temporal and occipital white matter should be adequately represented in the blocks sampled, 86% agreed that the internal capsule should be sampled, and 71% agreed that white matter regions should routinely be sampled bilaterally in VCING.
Pathologies and brain areas agreed for assessment after Delphi process
| Pathology | Brain areas assessed |
|---|---|
| Arteriolosclerosis (0–3)a | All four lobes of cerebrum (frontal and occipital white matter scored separately) Hippocampus (anterior and posterior scored separately) Basal ganglia (caudate, globus pallidus, internal capsule and putamen scored separately) Thalamus |
| Fibrinoid necrosis (0/1) | |
| Microaneurysms (0/1) | |
| Perivascular space dilation (0–3)a | |
| Perivascular haemosiderin leakage (0–3)a | |
| Microinfarcts (0/1)a | |
| Lacunar infarcts (0–3) | |
| Large infarcts (0/1)a | |
| Microhaemorrhage (0/1) | |
| Larger haemorrhage (0/1) | |
CAAb; Leptomeningeal (0–4) Cortical (0–4) Capillary (0/1) | All four lobes of cerebrum, with separate scores for hippocampus and temporal neocortex |
| Myelin loss (0–3)a | Internal capsule, frontal white matter and occipital white matter |
| Atheroma of circle of Willisc |
Samples are taken from the specified regions in one hemisphere with additional sampling of macroscopic lesions. Temporal and occipital white matter should be adequately represented in the blocks sampled. Scoring schemes for arteriolosclerosis, dilatation of perivascular spaces, and infarcts were adapted from Deramecourt et al. (2012),a; for CAA from Esiri et al. (1997) and Love et al. (2014),b, with CAA-associated vasculopathic changes given a score of 4; for assessment of atheroma of circle of Willis from Esiri et al. (1997)c.
Assessing and quantifying vessel wall pathology
In Round 3 it was agreed that atheroma of the circle of Willis (88%), arteriosclerosis—including arteriolosclerosis—(88%), and CAA (100%) should be assessed. Respondents in Round 4 indicated which published methods for assessing and quantifying these vessel wall pathologies they preferred and/or provided alternative suggestions or comments. All Round 4 respondents supported the use of the method of Esiri et al. (1997) for scoring atheroma of circle of Willis. All respondents thought that the scoring of arteriolosclerosis should be based on the method of Deramecourt et al. (2012), that arteriosclerosis and arteriolosclerosis should be scored together (62.5% support) and that fibrinoid necrosis and microaneurysms as complications of arteriolosclerosis should be separately scored simply as present (1) or absent (0) (75% agreement).
In Round 4, participants were asked to rate three published CAA scoring systems. Preference was expressed for the Love et al. (2014) (first choice preference) and Esiri et al. (1997) protocols, the latter receiving a higher combined first and second choice preference. However, most respondents wanted to take separate account of CAA in the cortex and meninges, and to assess capillary CAA separately from arteriolar CAA, and these preferences were incorporated into a composite CAA scoring system.
Assessing and quantifying tissue damage caused by/associated with vessel disease
Most participants thought that all of the types of putatively ‘vascular’ tissue damage presented in Round 3 should be assessed (≥75%). In Round 4, participants were asked to rank their preference for the three published systems for scoring tissue damage caused by or associated with vessel disease. Deramecourt et al. (2012) was the first choice of 71% of respondents. After feedback of these results, this choice was endorsed by all Round 5 respondents. However, as the respondents had previously agreed on the assessment of lacunar infarcts, larger haemorrhages and microhaemorrhages, which are not part of the Deramecourt et al. (2012) protocol, the protocol was modified to include these elements and agreed by consensus in the next round (Table 3).
The aim of Round 8 was to review and agree on the final assessment protocol. Summary results from Rounds 1–7 were presented and questions posed to confirm support or highlight points that still need clarification. The only amendments agreed in Round 9 were that CAA should be assessed separately in all four lobes of the cerebrum and separately in the hippocampus and the other parts of the temporal lobe, and that the abnormalities that constituted CAA vasculopathy were agreed to be concentric splitting of the vessel wall (‘double barrelling’), perivascular haemorrhage, fibrinoid necrosis, and thrombosis with recanalization. The final Delphi consensus VCING are presented in Table 3. The form that was circulated to assessors is available in the Supplementary material (Supplementary VCING validation assessment form).
Stage 2: Reproducibility study
Inter-rater reliability
Table 4 shows the Gwet’s AC2 coefficients for the vascular pathologies assessed after collapsing the scoring schemes based on clinical relevance. In general, analysis showed the VCING criteria to be reproducible, most achieving >0.8, indicating almost perfect agreement. There was variability in assessment of the severity of arteriolosclerosis: agreement was high in most brain regions (almost perfect in six, substantial in three) but moderate in four brain regions. Reliability in assessing microinfarcts also varied: almost perfect in the frontal gyrus, occipital cortex, and internal capsule, substantial in seven regions and moderate in three brain regions.
Inter-rater reliability in assessment of each vascular pathology in each brain region
| Brain region | Coefficient | 95% CI | Coefficient | 95% CI | Coefficient | 95% CI | Coefficient | 95% CI | Coefficient | 95% CI |
|---|---|---|---|---|---|---|---|---|---|---|
| Arteriolosclerosis | Fibrinoid necrosis | Microaneursyms | Perivascular space dilation | Perivascular haemosiderin leakage | ||||||
| Frontal cortex | 0.91 | 0.89–0.93 | 0.95 | 0.93–0.97 | 0.99 | 0.98–1 | 0.99 | 0.97–1 | 0.98 | 0.96–0.99 |
| Frontal white matter | 0.45 | 0.38–0.53 | 0.82 | 0.79–0.86 | 0.94 | 0.92–0.96 | 0.81 | 0.76–0.86 | 0.79 | 0.74–0.85 |
| Temporal cortex | 0.87 | 0.84–0.91 | 0.93 | 0.90–0.96 | 0.99 | 0.97–1 | 0.98 | 0.96–1 | 0.92 | 0.88–0.95 |
| Occipital cortex | 0.90 | 0.88–0.93 | 0.96 | 0.94–0.98 | 0.99 | 0.99–1 | 0.99 | 0.99–1 | 0.96 | 0.94–0.98 |
| Occipital white matter | 0.52 | 0.46–0.59 | 0.88 | 0.85–0.91 | 0.96 | 0.95–0.98 | 0.84 | 0.80–0.89 | 0.81 | 0.76–0.86 |
| Parietal cortex | 0.78 | 0.74–0.83 | 0.91 | 0.88–0.94 | 0.95 | 0.93–0.98 | 0.95 | 0.92–0.98 | 0.82 | 0.77–0.88 |
| Anterior hippocampus | 0.89 | 0.85–0.93 | 0.92 | 0.87–0.96 | 0.98 | 0.95–1 | 0.98 | 0.94–1 | 0.97 | 0.93–1 |
| Post hippocampus | 0.89 | 0.86–0.93 | 0.91 | 0.88–0.95 | 0.98 | 0.96–1 | 0.98 | 0.95–1 | 0.96 | 0.92–0.99 |
| Caudate | 0.73 | 0.68–0.78 | 0.87 | 0.83–0.90 | 0.95 | 0.92–0.97 | 0.95 | 0.92–0.98 | 0.98 | 0.96–1 |
| Putamen | 0.50 | 0.43–0.57 | 0.80 | 0.75–0.84 | 0.86 | 0.82–0.90 | 0.81 | 0.76–0.87 | 0.90 | 0.87–0.93 |
| Internal capsule | 0.88 | 0.86–0.91 | 0.95 | 0.92–0.97 | 0.97 | 0.95–0.98 | 0.99 | 0.99–1 | 0.98 | 0.97–0.99 |
| Globus pallidus | 0.53 | 0.46–0.61 | 0.86 | 0.82–0.90 | 0.94 | 0.91–0.97 | 0.87 | 0.83–0.92 | 0.92 | 0.88–0.95 |
| Thalamus | 0.68 | 0.63–0.74 | 0.79 | 0.74–0.83 | 0.86 | 0.82–0.90 | 0.90 | 0.86–0.94 | 0.96 | 0.93–0.98 |
| Microinfarct | Large infarct | Lacunar infarct | Microhaemorrhage | Larger haemorrhage | ||||||
| Frontal cortex | 0.84 | 0.78–0.89 | 0.98 | 0.96–0.99 | 0.99 | 0.99–1 | 0.98 | 0.97–1 | 0.99 | 0.98–1 |
| Frontal white matter | 0.57 | 0.52–0.62 | 0.93 | 0.89–0.96 | 0.95 | 0.93–0.97 | 0.95 | 0.93–0.98 | 0.99 | 0.98–1 |
| Temporal cortex | 0.75 | 0.70–0.81 | 0.95 | 0.92–0.98 | 0.99 | 0.97–1 | 0.98 | 0.96–1 | 0.99 | 0.973–1 |
| Occipital cortex | 0.83 | 0.79–0.88 | 0.98 | 0.96–1 | 1.00 | 0.99–1 | 0.98 | 0.97–1 | 1.00 | 0.99–1 |
| Occipital white matter | 0.60 | 0.56–0.64 | 0.97 | 0.94–0.99 | 0.97 | 0.95–0.98 | 0.95 | 0.92–0.97 | 0.99 | 0.98–1 |
| Parietal cortex | 0.71 | 0.65–0.78 | 0.95 | 0.92–0.98 | 0.98 | 0.95–1 | 0.96 | 0.93–0.99 | 0.99 | 0.97–1 |
| Anterior Hippocampus | 0.64 | 0.58–0.69 | 0.98 | 0.94–1 | 0.99 | 0.96–1 | 0.99 | 0.94–1 | 1.00 | 0.99–1 |
| Post hippocampus | 0.60 | 0.55–0.65 | 0.97 | 0.94–1 | 0.99 | 0.98–1 | 0.99 | 0.97–1 | 1.00 | 0.99–1 |
| Caudate | 0.64 | 0.59–0.69 | 0.98 | 0.96–1 | 0.93 | 0.91–0.96 | 0.97 | 0.95–1 | 1.00 | 0.98–1 |
| Putamen | 0.52 | 0.45–0.59 | 0.91 | 0.87–0.95 | 0.81 | 0.76–0.86 | 0.96 | 0.95–0.98 | 1.00 | 0.99–1 |
| Internal capsule | 0.81 | 0.77–0.85 | 0.97 | 0.95–0.99 | 0.99 | 0.98–1 | 0.99 | 0.99–1 | 1.00 | 0.99–1 |
| Globus pallidus | 0.65 | 0.59–0.71 | 0.95 | 0.92–0.98 | 0.85 | 0.81–0.89 | 0.98 | 0.95–1 | 0.99 | 0.97–1 |
| Thalamus | 0.55 | 0.49–0.61 | 0.96 | 0.94–0.98 | 0.87 | 0.84–0.91 | 0.92 | 0.89–0.95 | 1.00 | 0.99–1 |
| Leptomeningeal CAA | Cortical CAA | Capillary CAA | Myelin loss | |||||||
| Frontal cortex | 0.89 | 0.85–0.93 | 0.96 | 0.93–0.98 | 0.92 | 0.89–0.96 | Not scored | |||
| Frontal white matter | Not scored | Not scored | Not scored | 0.75 | 0.70–0.80 | |||||
| Temporal cortex | 0.91 | 0.87–0.95 | 0.96 | 0.94–0.99 | 0.92 | 0.87–0.96 | Not scored | |||
| Occipital cortex | 0.84 | 0.78–0.90 | 0.92 | 0.89–0.96 | 0.84 | 0.79–0.90 | Not scored | |||
| Occipital white matter | Not scored | Not scored | Not scored | 0.82 | 0.77–0.87 | |||||
| Parietal cortex | 0.91 | 0.88–0.95 | 0.95 | 0.93–0.98 | 0.93 | 0.90–0.96 | Not scored | |||
| Anterior Hippocampus | 0.95 | 0.90–0.99 | 0.97 | 0.93–1 | 0.95 | 0.91–1 | Not scored | |||
| Post hippocampus | 0.93 | 0.88–0.98 | 0.97 | 0.94–1 | 0.96 | 0.92–1 | Not scored | |||
| Caudate | Not scored | Not scored | Not scored | Not scored | ||||||
| Putamen | Not scored | Not scored | Not scored | Not scored | ||||||
| Internal capsule | 0.95 | 0.93–0.97 | ||||||||
| Globus pallidus | Not scored | Not scored | Not scored | Not scored | ||||||
| Thalamus | Not scored | Not scored | Not scored | Not scored | ||||||
Coefficient = Gwet’s AC2 coefficient; P-value < 0.001 for all collapsed scores.
Stage 3: Validation study
The number and percentage of cases with vascular pathologies are detailed in Supplementary Table 3. Most pathologies were evident in under 10% of cases in the majority of brain regions. Large infarcts were rare (0–4%), as were lacunar infarcts except in the putamen (19%). No cases were agreed to have haemorrhage, fibrinoid necrosis or microaneurysms. More prevalent pathologies were: arteriolosclerosis (19–46%) in half of the brain areas assessed; leptomeningeal CAA (25–43%) in four of six brain areas assessed; and myelin loss in the occipital (24%) and frontal (40%) regions.
Contribution of vascular pathologies to cognitive impairment
Univariable regression analysis showed seven pathologies—arteriolosclerosis, perivascular space dilation, leptomeningeal CAA, myelin loss, microinfarcts, lacunar infarcts and large infarcts—to be predictive of cognitive impairment (Table 5) and unlikely to be due to chance. Age, gender, APOE, and Braak stage were not associated with cognitive impairment.
Brain region-specific univariable logistic regression, showing significant associations with cognitive impairment
| Pathologya | Brain region | Normal (%) | Cognitively impaired (%) | OR | 95% CI | P-value |
|---|---|---|---|---|---|---|
| n = 65 | n = 48 | |||||
| Arteriolosclerosis | Occipital white matter | 18 (28) | 26 (54) | 3.09 | 1.41–6.78 | 0.005 |
| Global | 45 (69) | 43 (90) | 3.82 | 1.32–11.09 | 0.008 | |
| Leptomeningeal CAA | Occipital | 20 (31) | 29 (60) | 3.43 | 1.57–7.51 | 0.002 |
| Leptomeningeal CAAb | Occipital | 8 (12) | 16 (33) | 1.89 | 1.17–3.04 | 0.009 |
| Leptomeningeal CAA | Global | 27 (42) | 31 (65) | 2.57 | 1.19–5.54 | 0.02 |
| Myelin loss | Occipital white matter | 10 (15) | 17 (35) | 3.02 | 1.23–7.39 | 0.02 |
| Frontal white matter | 20 (31) | 25 (52) | 2.45 | 1.13–5.30 | 0.02 | |
| Global | 23 (35) | 33 (69) | 4.02 | 1.82–8.89 | 0.001 | |
| Myelin lossb | Frontal white matter | 2 (3) | 7 (15) | 5.38 | 1.06–27.17 | 0.04 |
| Microinfarcts | Parietal cortex | 2 (3) | 8 (17) | 6.63 | 1.34–32.88 | 0.02 |
| Putamen | 4 (6) | 11 (23) | 4.53 | 1.35–15.28 | 0.02 | |
| Global | 23 (35) | 27 (56) | 2.35 | 1.09–5.04 | 0.03 | |
| Lacunar infarcts | Thalamus | 0 | 6 (13) | 12.8c | 1.79–∞ | 0.008 |
| Large infarcts | Global | 3 (5) | 12 (25) | 6.89 | 1.82–26.05 | 0.004 |
| Perivascular space dilation | Global | 5 (8) | 12 (25) | 4.00 | 1.30–12.29 | 0.02 |
aClassified as present versus absent.
bLeptomeningeal CAA and myelin loss reclassified as severe versus none or mild.
cExact logistic regression used to estimate the odds ratio as cells with null value.
‘Global’ refers to the pathology in at least one brain region.
The best individual predictors were entered into a multivariable regression model to identify the best combination of predictors of cognitive impairment. The best combination model (Model 1) included: at least one large infarct [odds ratio (OR) = 6.46, 95% confidence interval (CI) 1.50–27.8, P = 0.01] moderate/severe occipital leptomeningeal CAA (OR = 5.49, 95% CI 2.17–13.9, P < 0.001) and moderate/severe myelin loss in at least one brain region (OR = 4.06, 95% CI 1.61–10.2, P < 0.001). The model correctly classified 77.9% cases as cognitively impaired, but was more specific (92.3%) than sensitive (58.3%) with an area under the ROC curve of 78.5%. Predicted probabilities of VCI went from 11%, 38%, 75% to 95% depending whether there were 0, 1, 2 or 3 of these findings, respectively (the probabilities for individual combinations are shown in Table 6).
Predictive probabilities of cognitive impairment given the presence or absence of pathology
| Model 1 | ||||
|---|---|---|---|---|
| Group | Probability | Global large infarcts | Occipital leptomeningeal CAA | Global myelin loss |
| 1 | 0.11 | 0 | 0 | 0 |
| 2 | 0.34 | 0 | 0 | 1 |
| 3 | 0.41 | 0 | 1 | 0 |
| 4 | 0.45 | 1 | 0 | 0 |
| 5 | 0.74 | 0 | 1 | 1 |
| 6 | 0.77 | 1 | 0 | 1 |
| 7 | 0.82 | 1 | 1 | 0 |
| 8 | 0.95 | 1 | 1 | 1 |
| Model 2 | ||||
| Group | Probability | Global large infarcts | Occipital leptomeningeal CAA | Occipital white matter arteriolosclerosis |
| 1 | 0.16 | 0 | 0 | 0 |
| 2 | 0.34 | 0 | 0 | 1 |
| 3 | 0.45 | 0 | 1 | 0 |
| 4 | 0.63 | 1 | 0 | 0 |
| 5 | 0.69 | 0 | 1 | 1 |
| 6 | 0.82 | 1 | 0 | 1 |
| 7 | 0.88 | 1 | 1 | 0 |
| 8 | 0.95 | 1 | 1 | 1 |
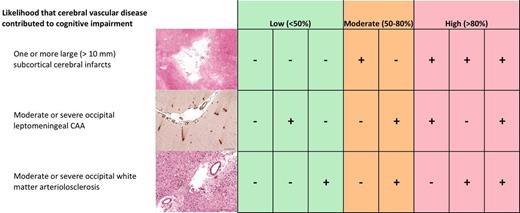
Replacing myelin loss in Model 1 with occipital white matter arteriolosclerosis (a more specific indicator of vascular disease) for Model 2 was only slightly worse in predicting correctly 72.6% cases, but with both reduced sensitivity (54.2%) and specificity (86.2%) (area under the ROC curve of 77.4%): at least one large infarct (OR = 8.97 95% CI 2.16–37.3, P = 0.003), moderate/severe occipital leptomeningeal CAA (OR = 4.24, 95% CI 1.77–10.1, P = 0.001) and moderate/severe arteriolosclerosis in occipital white matter (OR = 2.70, 95% CI 1.14–6.40, P = 0.02). In Model 2, the predicted probabilities of VCI went from 16%, 43%, 73% to 95% depending whether there were 0, 1, 2 or 3 of these findings, respectively (see probabilities for individual combinations in Table 6).
The validated VCING are listed in Supplementary Table 4. Secondary analysis showed the same pathologies (apart from large infarcts) to be associated with MMSE < 27; however, there were differences as to the brain region in which the pathologies best predicted this outcome (Supplementary Table 5). Large infarcts globally did not quite reach significance (P = 0.08). Therefore Model 1 determinants with MMSE as the dependent variable did not perform as well: 69% overall accuracy and 74.2% area under the ROC curve. Performance of Model 2 was comparable: 68% cases were correctly classified cognitively impaired, with an improved sensitivity of 61.5% but reduced specificity 75% (area under ROC curve 72.3%). However, only moderate/severe arteriolosclerosis in occipital white matter was a determinant of MMSE < 27 (OR = 3.97, 95% CI 1.62–9.70, P = 0.001), with neither global large infarcts nor occipital leptomeningeal CAA reaching conventional levels of statistical significance.
For Model 1 we found evidence for a modest age interaction with moderate/severe occipital leptomeningeal CAA (P = 0.03) so that the odds ratio was stronger for subjects with an age ≥85 years than those <85 years (OR 8.37 versus 3.52). For Model 2, we found this age interaction to be even stronger with moderate/severe occipital leptomeningeal CAA (P = 0.006) (OR 11.4 versus 2.13) and there was a similar interaction with occipital white matter arteriolosclerosis (P = 0.02) (OR 6.40 versus 1.93).
Discussion
Although multiple consensus guidelines have been produced on the post-mortem assessment of brain tissue for different diseases that cause dementia, most of the diagnostic criteria embedded in those guidelines have been based on a priori assumptions as to the most relevant lesions. Those assumptions can be tested in subsequent studies, as can the reliability with which the lesions can be assessed, but such post hoc studies may not address biases in sampling or assessment that are intrinsic to the initial guidelines. Our aim in the present study was to develop evidence-based practical guidelines for assessing the contribution of vascular pathology to cognitive impairment with reduced sampling bias and good reproducibility. We achieved this through several steps. The first involved the cooperation of a broad group of neuropathologists with expertise in dementia, in agreeing on clearly defined, comprehensive sampling and assessment guidelines, without making assumptions as to which types of vessel wall abnormality, ischaemic and haemorrhagic parenchymal lesion were more or less likely to be associated with dementia. We used Delphi-based methods to develop the VCING, with consensus definitions, staining procedures and assessment scoring protocols. Next we performed a blinded assessment of the inter-rater reliability of the scoring protocols and used the results to refine and simplify the assessments to achieve a high degree of reproducibility. Lastly, we applied the refined assessment procedures to a series of brains from people with varying degrees of vascular pathology and cognitive impairment in the absence of significant neurodegenerative disease, to develop a simple model for determining the probable contribution of cerebrovascular disease to cognitive impairment.
Several of our findings are in keeping with previous studies of vascular cognitive impairment. We found significant associations of cognitive impairment with microinfarcts, lacunar infarcts, large infarcts, arteriolosclerosis, perivascular space dilation, myelin loss and leptomeningeal CAA. Strozyk et al. (2010) found leukoencephalopathy, large infarcts, lacunar infarcts and higher vascular burden (combined macroscopic score) to be associated with vascular dementia. In another study, vascular dementia was associated with brain infarcts in 66% of cases (Thal et al., 2012). Subcortical macroscopic infarcts (Schneider et al., 2009) and lacunar infarcts in the thalamus were previously shown to be important predictors of cognitive impairment (Gold et al., 2005). Microinfarcts were found in all brain regions assessed in VCING—in agreement with a recent systematic review (Brundel et al., 2012). Those in the parietal cortex and putamen were predictive of cognitive impairment. Previous studies found associations between microinfarcts and dementia or cognitive dysfunction (Esiri et al., 1997; White et al., 2002; Kovari et al., 2004; Gold et al., 2005; Sonnen et al., 2007; Troncoso et al., 2008; Brayne et al., 2009; Arvanitakis et al., 2011). Cognitive impairment was also reported to be associated with diffuse white matter demyelination (Esiri et al., 1997), periventricular demyelination (Kovari et al., 2004) and arteriolosclerotic small vessel disease (Smallwood et al., 2012; Ighodaro et al., 2016), and several studies found CAA to be associated with cognitive impairment, independent of its association with Alzheimer’s disease (Neuropathology Group Medical Research Council Cognitive and Aging, 2001; Pfeifer et al., 2002; Greenberg et al., 2004; Keage et al., 2009), as shown here.
Individual pathologies predicted cognitive impairment with 60–65% accuracy (univariable analysis). Combining the best predictors from three pathologies improved this accuracy to 78%: moderate/severe occipital leptomeningeal CAA, at least one large (>10 mm diameter) infarct, and moderate/severe myelin loss in at least one brain region (Model 1). The predictive probabilities of VCI for this model ranged from 11–95%, depending on which combinations of pathologies were present. Our second model, with slightly lower predictive accuracy (77%), combined moderate/severe occipital leptomeningeal CAA, at least one large infarct, and moderate/severe arteriolosclerosis in the occipital white matter. We interpret the CAA and arteriolosclerosis as proxy measures of white matter damage leading to cognitive impairment, in agreement with previous findings (Esiri et al., 1997; Greenberg et al., 2004). Both models in the present study were derived from cases without significant neurodegenerative pathology. As myelin loss is not specific for cerebral ischaemia and may result from neurodegenerative changes in overlying cerebral cortex (Leys et al., 1991; Coleman, 2005; Agosta et al., 2011; McAleese et al., 2015; Tosto et al., 2015), we favour the second model as all three determinants are specific measures of cerebrovascular pathology. Although empirically its performance was slightly worse, it was comparable with regard to the area under the ROC curve (77.4% compared with 78.5% in the first model) and the probability of cognitive impairment ranged from 16% to 95%, depending on the combination of key pathological abnormalities present. Interestingly, we observed that the strength of association of some of the pathological findings with cognitive impairment may differ in an older as compared to younger brain. Our interaction tests were done post hoc and must therefore be treated with caution as they may simply reflect a type I error. However, the findings are of potential interest and are in keeping with other neuropathological data suggesting that vascular disease plays an increasingly important role in the development of dementia in the very old (Brayne et al., 2009).
Strengths and limitations
Delphi study
Our initial expectation was that we could use previously published protocols for neuropathological assessment in suspected vascular dementia as the basis for the present study. However, our literature review indicated that no single published protocol covered the full range of relevant pathologies, supporting the need for this study. Indeed, even with reference to five different published guidelines, we had insufficient detail on definitions of some terms and scoring schemes. The scoring protocol for assessing and quantifying tissue damage caused or associated with vessel disease by Deramecourt et al. (2012) was adopted for assessment of several of the vascular pathologies but participants devised further criteria for scoring lacunar infarcts, larger haemorrhage and microhaemorrhages. All respondents supported the scoring method of Esiri et al. (1997) for atheroma of circle of Willis. We extended Deramecourt et al. (2012) for arteriolosclerosis with additional scoring of the associated complications of fibrinoid necrosis and microaneurysms. Two Scoring schemes (Esiri et al., 1997; Love et al., 2014) were adapted for assessment of CAA.
The underlying principle of the Delphi method is that decisions made through iterative review by a group are more likely to be valid than those made by individuals. The iterative process was particularly important to reconcile differences in the definitions and terminology used by the neuropathologists. However, the participants held similar views on most topics without the need for repeated rounds of questions, for example with reference to which brain regions and pathologies should be assessed.
Reproducibility and validation studies
Strengths of the study were the relatively large number of neuropathologists and the combination of cohorts from two UK brain banks, providing cases with a broad range of vascular pathology and cognitive performance. Our primary outcome measure was cognitive impairment. Although MMSE scores were available for most cases, this test is relatively insensitive to the progressive decline and loss of executive function typically seen in VCI (Pendlebury et al., 2010, 2012; Ihara et al., 2013) and we therefore used MMSE scores in secondary analysis.
Large haemorrhages, microhaemorrhages, fibrinoid necrosis and microaneurysms were either rare or not present in this cohort. In consequence, these elements of the protocol could not be validated, although it is quite possible that some of the rarer pathologies may also predict cognitive impairment. High inter-rater reliability for these pathologies simply reflected agreement amongst the assessors for the absence of pathology in the majority of cases. Modelling and diagnostic predictions could not be fully realised due to insufficient numbers for some pathologies in regional analysis; however, global measures were used to overcome this limitation. The models presented in the present study are limited by the cohort size and composition of the cohort. It will be important to assess the reproducibility of these models in a much larger cohort, ideally with standardized prospective collection of clinical and cognitive data.
A final limitation of the present study was its reliance solely on morphological assessment of vascular pathology. Recent studies have shown that biochemical assessments can provide additional information of potential relevance to vascular cognitive impairment. Examples include measurement of the concentration of both vascular endothelial growth factor and the ratio of myelin-associated glycoprotein to proteolipid protein 1 to assess cerebral perfusion (Barker et al., 2014; Love and Miners, 2015, 2016; Miners et al., 2016; Thomas et al., 2015), and measurement of von Willebrand factor as a marker of microvascular density (Miners et al., 2014; Thomas et al., 2015). It is possible that the inclusion of these and other biochemical assays, e.g. of vesicular glutamate transporter and choline acetyltransferase activity (Sharp et al., 2009; Kirvell et al., 2010) or of vasoconstrictors such as endothelin 1 or angiotensin II (Barker et al., 2014; Ashby et al., 2016) might enhance neuropathological assessment of the determination of the contribution of cerebral vascular disease to cognitive impairment.
Conclusion

VCING model estimating the likelihood that cerebrovascular disease contributed to cognitive impairment. Combinations of the three main determinants—at least one large (>10 mm diameter) infarct, moderate/severe occipital leptomeningeal CAA, and moderate/severe arteriolosclerosis in the occipital white matter—are used to assign a low, intermediate or high likelihood that cerebrovascular disease contributed to cognitive impairment in an individual case. Scale bars in the top, middle and bottom photomicrographs represent 1 mm, 250 μm and 100 μm, respectively.
Acknowledgements
We thank Brains for Dementia Research, the Newcastle Brain Tissue Resource and the Oxford Project to Investigate Memory and Ageing (OPTIMA) tissue legacy, held in the Oxford Brain Bank for providing and preparing the case material, Dr Candida Tasman (University of Bristol) for preparing case material for the reproducibility and validation studies, and Dr Emma Ashby (University of Bristol), for assistance in coordinating material circulation between centres and data input for the reproducibility and validation studies.
Funding
This study was supported by a grant from the Alzheimer’s Society and a Network Co-operation grant from Alzheimer’s Research UK. The Newcastle Brain Tissue Resource and the Oxford Brain Bank are part of the Brains for Dementia Research program, jointly funded by Alzheimer’s Research UK and Alzheimer’s Society, and are supported by the Medical Research Council. During the course of the study M.E. received financial support from the NIHR, via the Oxford Biomedical Research Centre.
Supplementary material
Supplementary material is available at Brain online.
Abbreviations
- CAA
cerebral amyloid angiopathy
- MMSE
Mini-Mental State Examination
- ROC
receiver operating characteristic
- VCI
vascular cognitive impairment
- VCING
vascular cognitive impairment neuropathology guidelines
References

