


Abstract
Brain amyloid deposition is thought to be a seminal event in Alzheimer’s disease. To identify genes influencing Alzheimer’s disease pathogenesis, we performed a genome-wide association study of longitudinal change in brain amyloid burden measured by 18F-florbetapir PET. A novel association with higher rates of amyloid accumulation independent from APOE (apolipoprotein E) ε4 status was identified in IL1RAP (interleukin-1 receptor accessory protein; rs12053868-G; P = 1.38 × 10⁻⁹) and was validated by deep sequencing. IL1RAP rs12053868-G carriers were more likely to progress from mild cognitive impairment to Alzheimer’s disease and exhibited greater longitudinal temporal cortex atrophy on MRI. In independent cohorts rs12053868-G was associated with accelerated cognitive decline and lower cortical 11C-PBR28 PET signal, a marker of microglial activation. These results suggest a crucial role of activated microglia in limiting amyloid accumulation and nominate the IL-1/IL1RAP pathway as a potential target for modulating this process.
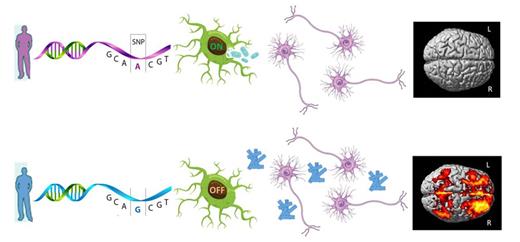
In a genome-wide study, Ramanan et al. discover an association between the microglial activation gene IL1RAP and higher rates of amyloid plaque accumulation as measured by PET in prodromal Alzheimer’s disease. Activated microglia may be crucial in amyloid clearance, and targeting the interleukin-1/IL1RAP pathway may be a potential therapeutic approach.
Introduction
Deposition of amyloid-β in the brain is thought to be a necessary early step in the development of Alzheimer’s disease, a progressive and highly prevalent neurodegenerative disorder with substantial societal burdens (Karran et al., 2011; Jack et al., 2013a). Existing prospective studies suggest that brain amyloid accumulation occurs over decades, preceding the onset of clinical symptoms and subsequently contributing to clinical progression (Villemagne et al., 2013; Doraiswamy et al., 2014; Huijbers et al., 2015). However, the mechanisms underlying amyloid accumulation and clearance in Alzheimer’s disease are not fully understood.
Pathogenic mutations causing rare, early-onset forms of Alzheimer’s disease have been described in three genes involved in amyloidogenesis, APP (amyloid precursor protein), PSEN1 (presenilin 1), and PSEN2 (presenilin 2) (Bettens et al., 2013). For late-onset Alzheimer’s disease, the strongest known genetic risk factor is the APOE ε4 allele (Corder et al., 1993). Several mechanisms have been proposed relating APOE ε4 to enhanced aggregation and reduced clearance of brain amyloid (Kim et al., 2009). However, APOE ε4 is neither necessary nor sufficient for development of amyloid pathology or incident Alzheimer’s disease, suggesting that other contributing factors remain to be discovered.
With the development of radiotracers allowing for non-invasive in vivo detection of amyloid plaque burden in large samples (Clark et al., 2012), amyloid PET has become an established endophenotype used in cross-sectional studies to relate genetic variants to Alzheimer’s disease pathology (Swaminathan et al., 2012; Rhinn et al., 2013; Shulman et al., 2013; Lim et al., 2014; Ramanan et al., 2014b). We hypothesized that genetic factors would also modulate the rate of amyloid accumulation over time. We therefore performed a genome-wide association study (GWAS) of longitudinal change in brain amyloid burden measured by 18F-florbetapir PET to identify novel genetic influences on the pathogenesis and trajectory of Alzheimer’s disease.
Materials and methods
Subjects and phenotypes
The Alzheimer’s Disease Neuroimaging Initiative (ADNI, Weiner et al., 2010), Indiana Memory and Aging Study (IMAS; Ramanan et al., 2014a), Rush Memory and Aging Project (MAP, Bennett et al., 2012b), and Religious Orders Study (ROS; Bennett et al., 2012a) are longitudinal studies of older adults representing clinical stages along the continuum from normal ageing to Alzheimer’s disease. All participants provided written informed consent, and study protocols were approved by each site’s institutional review board.
18F-Florbetapir PET imaging was performed at baseline and 2-year follow-up for participants enrolled in the ADNI GO and 2 phases. Image acquisition and preprocessing were performed as described previously (Jagust et al., 2010). Tracer uptake was normalized to average uptake values from an atlas-based composite reference region expected not to exhibit amyloid pathology (composed of the cerebral white matter degraded to 0.7, brainstem, and whole cerebellum). This normalization yielded standardized uptake value ratio (SUVR) images (Schmidt et al., 2014). As described previously, the mean SUVR for a customized composite region was obtained to represent a global cortical measure of amyloid burden at each time point (Risacher et al., 2015). The annualized per cent change in global cortical SUVR at 2-year follow-up compared to baseline was used as the main quantitative phenotype for genetic analysis. Extreme outliers (annualized per cent change > three standard deviations from the sample mean) were excluded to limit the potential for spurious associations. For post hoc analyses, baseline amyloid status (positive versus negative) was determined for each participant as described previously (Risacher et al., 2015).
11C-PBR28 PET imaging was performed for a subset of IMAS participants as described previously (Yoder et al., 2013). The sample analysed included cognitively normal older adults (n = 7), older adults with cognitive complaints in the absence of significant cognitive deficits (n = 5), participants with mild cognitive impairment (MCI, n = 7), and clinical Alzheimer’s disease participants (n = 6). SUV images were created by normalizing each voxel by the injected dose of 11C-PBR28 per total body weight. Mean SUV data were extracted for the frontal, parietal, temporal, limbic, and occipital lobes. The average SUV for these five regions was calculated to represent a global cortical index of activated microglia for use as a quantitative phenotype. TSPO (translocator protein, 18 kDa) rs6971 genotype was used to delineate participants with high, mixed, and low affinity states of the TSPO binding site, as 11C-PBR28 is highly sensitive to these states (Kreisl et al., 2013). For genetic analyses, participants with low affinity TSPO binding sites (rs6971-TT) were excluded and rs6971 genotype (CC versus TC) was included as a covariate (Yoder et al., 2013).
For ADNI participants, structural MRI scans from baseline and 2-year follow-up visits were downloaded (www.adni.loni.usc.edu) and processed as described previously (Risacher et al., 2010) using FreeSurfer, version 5.1. For each scan, mean thickness values from the left and right temporal cortex regions were averaged to create a measure of bilateral temporal cortex thickness. The annualized per cent change in bilateral temporal cortex thickness at 2-year follow-up compared to baseline was calculated for use in genetic analyses.
Verbal episodic memory performance was assessed at baseline and 2-year follow-up for participants from ADNI, MAP and ROS using delayed recall of logical memory prose passages from the Wechsler Memory Scale-Revised. For genetic analyses, the 2-year difference in delayed recall score was used as the phenotype and baseline age, gender and education were included as covariates.
Genotyping and imputation
GWAS data for ADNI participants were obtained and processed as described previously (Ramanan et al., 2014b). Briefly, genotyping was performed per manufacturer’s protocol using blood genomic DNA samples and Illumina GWAS arrays (610-Quad, OmniExpress, or HumanOmni2.5-4v1). The single nucleotide polymorphisms (SNPs) characterizing APOE ε2/ε3/ε4 status (rs429358 and rs7412) were genotyped separately and merged with the array data sets as described previously (Saykin et al., 2010, 2015). Genotype data underwent stringent quality control including identity checks, sample exclusion for call rate <95%, and SNP exclusion for call rate <95%, Hardy-Weinberg P < 1 × 10⁻⁶, or minor allele frequency (MAF) <1%.
MaCH (Li et al., 2010), Minimac (Howie et al., 2012), and haplotype patterns from the 1000 Genomes Project reference panel were used to impute SNP genotypes not directly assayed by the GWAS arrays. Imputation was performed as described previously (Nho et al., 2013; Ramanan et al., 2014b). Following additional quality control (SNP call rate < 95%, Hardy-Weinberg P < 1 × 10⁻⁶) and frequency filtering (MAF < 5%), 6 112 217 genotyped and imputed SNPs were available for analysis. Six participant pairs exhibited significant relatedness (PI_HAT > 0.5) and therefore one individual from each pair was randomly selected for exclusion. For additional studies in IMAS, MAP and ROS, identical procedures were used to impute the specific SNPs required for analysis (Chibnik et al., 2011; Ramanan et al., 2014a).
Whole genome sequencing was obtained from blood genomic DNA samples for a subset of the ADNI sample. Sequencing was performed using the Illumina HiSeq2000 system through paired-end read chemistry and read lengths of 100 base pairs. The resulting Illumina GSEQ files were converted into FASTQ files for introductory evaluation using FastQC (Andrews, 2010). Initial alignment to the reference human genome (NCBI build 37.72) for bases with Phred quality > 15 was completed using the Burrows-Wheeler Alignment tool (Li and Durbin, 2009). Suspicious reads were locally realigned and the Illumina base calling quality scores were recalibrated to account for effects of sequencing technology and machine cycle. These realigned reads were written to a BAM file to be used for multi-sample variant calling using the GATK HaplotypeCaller (DePristo et al., 2011). ANNOVAR (Wang et al., 2010b) was used to annotate variants passing recommended quality criteria (Van der Auwera et al., 2013). Participants with poor quality variant calls (concordance rate < 99% for SNPs genotyped through both sequencing and the Illumina HumanOmni2.5-4v1 array) were excluded from further analysis.
To limit potential effects of population stratification, all genetic analyses were restricted to non-Hispanic white participants as determined by multidimensional clustering using PLINK. To verify appropriate control for population structure, EIGENSTRAT was used to generate principal component eigenvectors for use as covariates in post hoc analyses.
Statistical analysis
GWAS was performed using linear regression under an additive genetic model in PLINK. Baseline age and gender were included as covariates in the GWAS. A conservative significance threshold (P < 5 × 10⁻⁸) was used based on a Bonferroni correction of one million independent tests (Pe'er et al., 2008). Manhattan and Q-Q plots were generated with Haploview and regional association plots were generated with LocusZoom. The genome partitioning algorithm GCTA (Yang et al., 2011) was used to estimate the proportion of phenotypic variance explained by all SNPs in the GWAS. Power calculations and curves were obtained using GWAPower (Feng et al., 2011).
Significant associations were further investigated using sequence data from a subset of the GWAS sample. Common variants in IL1RAP, defined as having MAF ≥ 1 / √(2n) = 0.034 (Ionita-Laza et al., 2013), were analysed using linear regression under an additive genetic model in PLINK. SKAT (Ionita-Laza et al., 2013) was used to perform association testing of low-frequency and rare IL1RAP variants (MAF < 0.034). Pairwise linkage disequilibrium calculations were obtained for selected SNP pairs using PLINK.
Complementary approaches were used to extend the GWAS findings. GATES (KGG software version 2.5) (Li et al., 2011) was used to calculate a summary P-value for each gene (including a default ± 5 kb window to account for putative regulatory regions) based on its size, linkage disequilibrium structure and constituent GWAS SNP associations. GSA-SNP (Nam et al., 2010; Ramanan et al., 2012a) was used to identify biological pathways exhibiting enrichment of association in the GWAS. Pathway definitions from three resources (Biocarta, KEGG and Reactome) were downloaded from the Molecular Signatures Database, version 4.0 and analysis was restricted to pathways containing 5–100 genes to limit the potential for size-influenced spurious associations (Ramanan et al., 2012b). Pathways with false discovery rate (FDR)-corrected P < 0.05 were considered as significant.
Statistical Parametric Mapping 8 (Wellcome Trust Centre for Neuroimaging) was used to perform voxel-wise analysis of the effect of IL1RAP rs12053868 on longitudinal change in 18F-florbetapir PET amyloid burden. A two-way ANCOVA was performed using rs12053868 genotype and scan visit (baseline versus 2-year follow-up) as the independent variables and age, gender, baseline diagnosis, APOE ε4 status (positive versus negative), and time between PET scans as covariates. To specify an additive model, we a priori (based on the GWAS results) coded the analysis vector as [positive change in AA] < [positive change in GA] < [positive change in GG], corresponding to a vector of [−1, 0, −1, 1, −1, 2]. A grey matter mask was used and results were displayed at a voxel-wise threshold of P < 0.001 (uncorrected) with minimum cluster size (k) = 175 voxels. These voxel-wise parameters were selected to approximately correspond to a cluster-wise threshold of P < 0.05 (FDR-corrected). Only the GG > GA > AA results are shown, as no significant clusters were observed from the reciprocal model of AA > GA > GG.
Additional analyses were performed using IBM SPSS Statistics, Version 22.0. Following the GWAS, post hoc models including additional covariates were used to assess the robustness of the association of IL1RAP rs12053868 with higher rates of amyloid accumulation. Baseline 18F-florbetapir PET SUVR and the square of this value were both included among the additional covariates in these post hoc analyses to account for the sigmoidal relationship of cortical amyloid PET burden to time (Jack et al., 2013b). Consistent with previous data (Jack et al., 2013b), the rate of amyloid accumulation as a function of baseline amyloid burden displayed an inverted U relationship (Supplementary Fig. 1). A one-way ANCOVA was used to assess the effect of rs12053868 genotype (AA versus GA/GG) on annualized per cent change in bilateral temporal cortex thickness, including baseline age, gender, total intracranial volume, and MRI scanner type (1.5 T versus 3.0 T field strength) as covariates. A subsequent two-way ANCOVA was performed to further explore the potential interaction of rs12053868 genotype with baseline diagnosis (cognitively normal versus MCI versus Alzheimer’s disease). Logistic regression was used to test the association of rs12053868 genotype (AA versus GA/GG) with progression from MCI to Alzheimer’s disease, including baseline age and gender as covariates. The associations of rs12053868 with 11C-PBR28 PET SUV and longitudinal change in memory performance were tested using linear regression under an additive genetic model. As described above, baseline age, gender, and TSPO rs6971 genotype were included as covariates in the 11C-PBR28 PET analysis. Baseline age, gender, and education were included as covariates in the memory analysis. METAL (Willer et al., 2010) was used to perform inverse-variance weighted meta-analysis of the within-cohort memory studies.
Results
Longitudinal change in brain amyloid PET burden in ADNI participants
Primary phenotype (annualized per cent change in global cortical amyloid burden) and GWAS data passing stringent quality control were available for 495 ADNI participants (Table 1). Baseline age and gender were included as covariates in all analyses. The annualized per cent change in cortical amyloid burden was approximately normally distributed across the full sample (Supplementary Fig. 2). Mean annualized rates of amyloid accumulation were higher in Alzheimer’s disease (1.36%; n = 41) than in MCI (0.79%; P = 0.02; n = 294) or cognitively normal (0.66%; P = 5.47 × 10⁻³; n = 160) participants.
Selected sample characteristics
| ADNI | IMASa | MAPb | ROSb | |
|---|---|---|---|---|
| Participants, n | 495 | 25 | 178 | 190 |
| Gender | ||||
| Male | 274 (55%) | 8 (32%) | 54 (30%) | 68 (36%) |
| Female | 221 (45%) | 17 (68%) | 124 (70%) | 122 (64%) |
| Age at baseline (years) | 73.0 (7.8) | 70.6 (7.3) | 80.8 (6.2) | 76.0 (6.8) |
| Education (years) | 16.4 (2.7) | 16.2 (2.6) | 15.0 (3.0) | 18.3 (3.2) |
Values are n (percentage) or mean (SD).
a11C-PBR28 PET subsample.
bMemory analysis subsample.
APOE ε4 is associated with higher rates of amyloid accumulation
Because of its well-known association with Alzheimer’s disease, prior to GWAS we investigated the effect of the APOE locus on longitudinal change in amyloid burden. Genotypes for APOE rs429358 and rs7412 were obtained for all but one participant. APOE ε4 carriers showed larger increases in amyloid burden over time compared to non-carriers (P = 9.00 × 10⁻⁶; Cohen’s d = 0.42; Fig. 1A). APOE ε2/ε3 participants displayed lower rates of amyloid accumulation compared to ε3/ε3 (P = 0.01; Cohen’s d = 0.41), ε3/ε4 (P = 1.42 × 10⁻⁵; Cohen’s d = 0.75), and ε4/ε4 (P = 1.57 × 10⁻⁴; Cohen’s d = 0.84) participants (Fig. 1B).

Effect of the APOE locus on 2-year change in cortical amyloid PET burden. Mean annualized per cent change in global cortical 18F-florbetapir SUVR (adjusted for age and gender) ± standard errors are displayed based on (A) APOE ε4 status and (B) APOE ε2/ε3/ε4 status. (A) APOE ε4 carriers exhibited larger increases in brain amyloid PET burden compared to non-carriers (P = 9.00 × 10⁻⁶). (B) APOE ε2/ε3 participants displayed lower rates of amyloid accumulation compared to ε3/ε3 (P = 0.01), ε3/ε4 (P = 1.42 × 10⁻⁵), and ε4/ε4 (P = 1.57 × 10⁻⁴) participants.
GWAS of longitudinal change in amyloid PET burden
To identify additional genetic modulators of longitudinal change in amyloid burden, we performed a GWAS testing 6 112 217 SNPs, with baseline age and gender included as covariates (Fig. 2). No evidence of systematic inflation of P-values was observed (λ = 1.016; Supplementary Fig. 3).
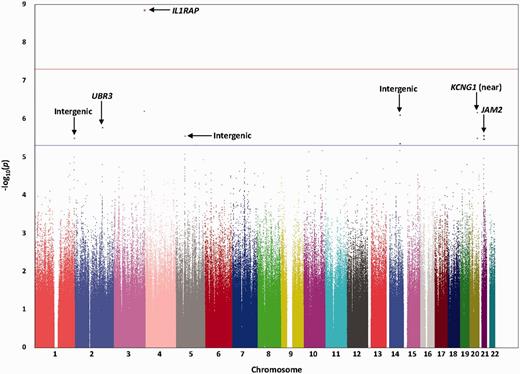
Manhattan plot for the GWAS of longitudinal change in cortical amyloid PET burden. Observed −log10P-values (y-axis) are displayed for all tested SNPs on each autosomal chromosome (x-axis). A genome-wide significant association (P < 5 × 10⁻⁸; red line) with longitudinal change in global cortical amyloid burden measured by 18F-florbetapir PET was identified on chromosome 3 within IL1RAP. Suggestive associations (P < 5 × 10⁻⁶; blue line) were identified on additional chromosomes.
A genome-wide significant association was identified on chromosome 3 for rs12053868, an intronic SNP in IL1RAP (P = 1.38 × 10⁻⁹; Fig. 3A). The rs12053868-G allele was associated with higher rates of amyloid accumulation compared to the major (A) allele (Fig. 3B). A large effect size was observed in homozygous GG participants (Cohen’s d = 1.20) equivalent to an odds ratio of 8.79 (Borenstein, 2009). Using stepwise linear regression with forward selection, this SNP explained 7.1% of the phenotypic variance in addition to, and independent from, the 3.4% explained by APOE ε4 status (Supplementary Fig. 4). This association remained genome-wide significant (P = 5.80 × 10⁻⁹) after the inclusion of APOE ε4 status, baseline diagnosis, years of education, baseline cortical amyloid PET burden (modelled as described in the ‘Materials and methods’ section), and the first three principal components from population structure analysis. No significant interactions were identified between rs12053868 and any of these factors, or age or gender. The effect of the G allele on higher rates of amyloid accumulation was present in both amyloid-negative and amyloid-positive participants as classified by the baseline PET scan (Supplementary Fig. 5). Using voxel-wise analysis to further characterize the spatial effect of this SNP in the brain, we again observed an association of rs12053868-G with higher rates of amyloid accumulation, with significant clusters for this effect observed primarily in the bilateral frontal, medial, and lateral parietal, and lateral temporal lobes, as well as throughout the posterior and anterior cingulate cortex (Fig. 3C).

Association and effect of IL1RAP rs12053868-G on longitudinal change in cortical amyloid PET burden. (A) All SNPs within 250 kb of rs12053868 are plotted based on their GWAS −log10P-values, NCBI build 37 genomic position, and recombination rates calculated from the 1000 Genomes Project reference data. The colour scale of r2 values is used to label SNPs based on their degree of linkage disequilibrium with rs12053868. Genes in the region are labelled with arrows denoting 5’-to-3’ orientation. (B) Mean annualized per cent change in global cortical 18F-florbetapir SUVR (adjusted for age and gender) ± standard errors are displayed based on rs12053868 genotype. The minor allele (G) of rs12053868 was associated with a 0.8% increase per allele copy per year in cortical amyloid PET burden. The association of rs12053868 was genome-wide significant under additive (P = 1.38 × 10⁻⁹) and dominant (P = 5.26 × 10⁻⁹) genetic models. (C) Selected cross-sectional slices (top) and surface renderings (bottom) from voxel-wise analysis of the effect of rs12053868 on longitudinal amyloid accumulation measured by 18F-florbetapir PET. The colour scale indicates regions where the rs12053868-G allele was associated with higher rates of amyloid accumulation (GG > GA > AA). All comparisons are displayed at a voxel-wise threshold of P < 0.001 (uncorrected) with minimum cluster size (k) = 175 voxels (approximately corresponding to a cluster-wise threshold of FDR-corrected P < 0.05). Where applicable, the left and right cerebral hemispheres are labelled for orientation. As displayed, the most significant clusters (identifying regions where rs12053868-G exhibited the greatest effect on rates of amyloid accumulation) were observed in the bilateral frontal lobes, medial parietal lobes, lateral parietal lobes, lateral temporal lobes, and the anterior and posterior cingulate cortex.
Suggestive associations with longitudinal change in amyloid burden (P < 5 × 10⁻⁶) were also identified (Fig. 2 and Table 2). These included additional SNPs in IL1RAP, as well as SNPs on other chromosomes within or near KCNG1 (potassium voltage-gated channel, subfamily G, member 1), UBR3 (ubiquitin protein ligase E3, component n-recognin 3, putative), and JAM2 (junctional adhesion molecule 2). Variants in BIN1 (bridging integrator 1) and CASS4 (cas scaffolding protein family member 4) which were identified in recent Alzheimer’s disease case-control GWAS (Hollingworth et al., 2011; Naj et al., 2011; Lambert et al., 2013) displayed uncorrected P < 0.05 in our analysis (Supplementary Table 1). Collectively, all SNPs tested in the GWAS (including the IL1RAP and APOE SNPs described previously) were estimated to explain 34% of the phenotypic variance based on a genome partitioning analysis (Yang et al., 2011).
Peak associations (P < 5 × 10⁻⁶) for the GWAS of longitudinal change in amyloid PET burden
| Chromosome | SNP | Gene symbol | Gene name | MAFa | β (SE)b | R2c | P | Gen/Impd |
|---|---|---|---|---|---|---|---|---|
| 3 | rs12053868 | IL1RAP | Interleukin-1 receptor accessory protein | 0.12 | 0.84 (0.14) | 0.071 | 1.38 × 10⁻⁹ | 437/58 |
| 3 | rs3773970 | IL1RAP | Interleukin-1 receptor accessory protein | 0.13 | 0.67 (0.13) | 0.049 | 6.19 × 10⁻⁷ | 494/1 |
| 3 | rs3773973 | IL1RAP | Interleukin-1 receptor accessory protein | 0.13 | 0.67 (0.13) | 0.049 | 6.19 × 10⁻⁷ | 436/59 |
| 3 | rs147346019 | IL1RAP | Interleukin-1 receptor accessory protein | 0.13 | 0.67 (0.13) | 0.049 | 6.19 × 10⁻⁷ | 0/495 |
| 20 | rs10470013 | Near KCNG1 | Potassium voltage-gated channel, subfamily G, member 1 | 0.11 | 0.73 (0.14) | 0.049 | 6.65 × 10⁻⁷ | 438/57 |
| 14 | rs79110742 | Intergenic | 0.06 | 0.94 (0.19) | 0.048 | 7.74 × 10⁻⁷ | 0/495 | |
| 2 | rs13012722 | UBR3 | Ubiquitin protein ligase E3 component n-recognin 3 (putative) | 0.49 | −0.45 (0.09) | 0.045 | 1.67 × 10⁻⁷ | 0/495 |
| 21 | rs8129913 | JAM2 | Junctional adhesion molecule 2 | 0.43 | 0.43 (0.09) | 0.043 | 2.75 × 10⁻⁶ | 0/495 |
| 21 | rs11087971 | JAM2 | Junctional adhesion molecule 2 | 0.43 | 0.43 (0.09) | 0.043 | 2.75 × 10⁻⁶ | 0/495 |
| 5 | rs11744848 | Intergenic | 0.13 | −0.63 (0.13) | 0.043 | 2.80 × 10⁻⁶ | 0/495 | |
| 1 | rs10737896 | Intergenic | 0.21 | −0.51 (0.11) | 0.043 | 3.19 × 10⁻⁶ | 0/495 | |
| 1 | rs7534801 | Intergenic | 0.21 | −0.51 (0.11) | 0.043 | 3.19 × 10⁻⁶ | 495/0 | |
| 20 | rs6096218 | Near KCNG1 | Potassium voltage-gated channel, subfamily G, member 1 | 0.11 | 0.69 (0.15) | 0.043 | 3.20 × 10⁻⁶ | 494/1 |
| 21 | rs4817054 | JAM2 | Junctional adhesion molecule 2 | 0.43 | 0.43 (0.09) | 0.043 | 3.34 × 10⁻⁶ | 0/495 |
| 14 | rs8023225 | Intergenic | 0.08 | 0.77 (0.17) | 0.042 | 4.41 × 10⁻⁶ | 494/1 |
aMinor allele frequency in the GWAS sample.
bβ (unstandardized) effect size from the GWAS (with standard error indicated in parentheses), denoting the annualized percent change in global cortical 18F-florbetapir SUVR conferred by one copy of the minor allele.
cProportion of phenotypic variance explained (not necessarily uniquely) by the SNP, including age and gender as covariates.
dGen = number of participants for which the SNP was genotyped on a GWAS array (ADNI participants were genotyped on one of three Illumina GWAS arrays which each had different genomic coverages); Imp = number of participants for which the SNP was imputed.
Gene- and pathway-based GWAS extensions
Using gene-based GWAS analysis, IL1RAP displayed genome-wide significant association with longitudinal change in amyloid burden [P < 2.17 × 10⁻⁶ (0.05/23 000 genes)]. Additional genes not initially uncovered through single SNP analysis displayed strong gene-level associations (Table 3). We also identified 83 biological pathways displaying enrichment of GWAS association, including numerous pathways related to cell adhesion and the complement system (Supplementary Table 2).
Peak GATES gene-based associations with longitudinal change in amyloid PET burden
| Chromosome | Gene symbol | Gene name | GATES P |
|---|---|---|---|
| 3 | IL1RAP | Interleukin-1 receptor accessory protein | 9.45 × 10⁻⁸ |
| 20 | PSMA7 | Proteasome subunit, alpha type, 7 | 1.33 × 10⁻⁴ |
| 20 | LSM14B | SCD6 homolog B (S. cerevisiae) | 1.46 × 10⁻⁴ |
| 21 | JAM2 | Junctional adhesion molecule 2 | 1.59 × 10⁻⁴ |
| 19 | APOC1 | Apolipoprotein C1 | 1.74 × 10⁻⁴ |
| 2 | UBR3 | Ubiquitin protein ligase E3 component n-recognin 3 (putative) | 1.75 × 10⁻⁴ |
| 19 | APOE | Apolipoprotein E | 2.26 × 10⁻⁴ |
| 10 | PNLIPRP1 | Pancreatic lipase-related protein 1 | 2.33 × 10⁻⁴ |
| 19 | TOMM40 | Translocase of outer mitochondrial membrane 40 homolog (yeast) | 3.10 × 10⁻⁴ |
| 3 | MIR6828 | MicroRNA 6828 | 3.12 × 10⁻⁴ |
| 14 | SNAPC1 | Small nuclear RNA activating complex, polypeptide 1 | 3.47 × 10⁻⁴ |
| 12 | BRI3BP | Brain protein I3 binding protein | 3.82 × 10⁻⁴ |
| 20 | SS18L1 | Synovial sarcoma translocation gene on chromosome 18-like 1 | 4.09 × 10⁻⁴ |
| 3 | CLDN11 | Claudin 11 | 4.98 × 10⁻⁴ |
Deep sequence analysis of IL1RAP
To further investigate the IL1RAP locus, we analysed gene sequence data for a subset of the GWAS sample (n = 435). Following stringent quality control, 1311 base pairs with at least one alternative allele present in the sample were available for analysis. Testing of 406 common variants confirmed a peak association with higher rates of amyloid accumulation for rs12053868 (P = 8.18 × 10⁻⁹; Cohen’s d = 1.18 for GG versus AA). Although six additional common variants displayed strong association (P < 5 × 10⁻⁴), pairwise linkage disequilibrium calculations (Supplementary Table 3) and conditional analyses suggested that these SNPs, while not complete proxies for rs12053868, were not independent from rs12053868. Using SKAT (Ionita-Laza et al., 2013), we identified a collective association of low-frequency and rare variants with rate of change in amyloid burden (P = 7.74 × 10⁻³).
IL1RAP rs12053868 is associated with a marker of cortical microglial activation
IL1RAP encodes a necessary component of the IL-1 (interleukin-1) receptor complex and its downstream signalling pathway (Gabay et al., 2010). IL-1 is a potent pro-inflammatory cytokine known to promote activation of microglia, the resident phagocytes in the brain (Ghosh et al., 2013; Doens and Fernandez, 2014). Recent reports have suggested that microglia may be crucial in clearing brain amyloid and limiting plaque growth (Chakrabarty et al., 2015; Condello et al., 2015; Johansson et al., 2015). We hypothesized that the IL1RAP SNP associated with higher rates of amyloid accumulation would also be associated with lower microglial activation. We tested this in vivo in IMAS using PET and 11C-PBR28, a radioligand considered to be a marker of microglial activity (Brown et al., 2007). Controlling for age, gender, and TSPO rs6971 genotype, IL1RAP rs12053868-G was associated with lower cortical 11C-PBR28 signal, indicative of lower cortical microglial activation (P = 0.031; Cohen’s d = 1.33; Supplementary Fig. 6).
IL1RAP rs12053868-G carriers exhibit greater temporal cortex atrophy over 2 years
Amyloid deposition has been associated with increased rates of brain atrophy in cognitively normal older adults and in Alzheimer’s disease (Storandt et al., 2009; Chetelat et al., 2010; Dore et al., 2013). We hypothesized that IL1RAP rs12053868-G would be associated with higher rates of atrophy in Alzheimer’s disease-specific regions (the bilateral temporal cortex) (Dore et al., 2013). Using structural MRI in a subset of the GWAS sample (n = 358), rs12053868-G carriers exhibited greater declines in temporal cortex thickness compared to non-carriers (P = 0.035; Cohen’s d = 0.28; Supplementary Fig. 7A). This effect was observed across all diagnostic groups (Supplementary Fig. 7B) and remained significant (P = 0.042) after the inclusion of diagnosis (P < 0.001) as an independent predictor variable.
IL1RAP rs12053868-G carriers exhibit greater likelihood of progression from MCI to Alzheimer’s disease
Amyloid deposition in MCI is a predictor of clinical progression to Alzheimer’s disease (Huijbers et al., 2015). We hypothesized that rs12053868-G would be associated with a greater likelihood of progression from MCI to Alzheimer’s disease. Within the GWAS sample, 269/294 participants diagnosed with MCI at baseline had diagnosis information at 2-year follow-up, including 42 who progressed to clinical Alzheimer’s disease and 227 who did not. Using logistic regression with age and gender included as covariates, rs12053868-G carriers were more likely to convert to Alzheimer’s disease within the follow-up period than non-carriers [P = 0.025, odds ratio (OR) = 2.32 (1.11–4.87)] (Supplementary Fig. 8).
IL1RAP rs12053868 is associated with accelerated cognitive decline in high risk individuals
Memory impairment is the cardinal early symptom of Alzheimer’s disease (Ballard et al., 2011) and amyloid deposition is known to be related to memory impairment and longitudinal cognitive decline (Sperling et al., 2013; Villemagne et al., 2013). We hypothesized that rs12053868-G would be associated with accelerated decline of memory in participants at high risk for amyloid pathology (defined as being APOE ε4 positive or having a baseline diagnosis of clinical Alzheimer’s disease). In a meta-analysis of 579 participants from three independent cohorts (ADNI, MAP and ROS), rs12053868-G was associated with faster 2-year decline in verbal episodic memory performance (P = 7.72 × 10⁻⁴), with each copy of the G allele adding approximately one-quarter of a standard deviation to the rate of decline (Supplementary Fig. 9). The heterogeneity statistic (I2 = 0, P = 0.37) indicated no significant heterogeneity across the individual cohort studies used for meta-analysis (Higgins et al., 2003).
Discussion
To our knowledge, this is the first reported GWAS of longitudinal change in brain amyloid load measured by 18F-florbetapir PET. Our findings support IL1RAP as a novel potential Alzheimer’s disease target and highlight the use of amyloid PET as a valuable Alzheimer’s disease endophenotype, particularly in a longitudinal framework.
IL1RAP encodes a necessary and potentially rate-limiting component of the pro-inflammatory IL-1 signalling pathway (Gabay et al., 2010). Activation of this pathway requires binding of IL1RAP to the IL-1/IL-1 receptor complex (Wang et al., 2010a). IL1RAP splice variants, including one isoform expressed only in the CNS as well as a different soluble variant, exert inhibitory effects on the IL-1 pathway (Smith et al., 2009). More broadly, the IL-1 pathway and its component genes have long been foci of interest in genetic and other studies of the Alzheimer’s disease spectrum (Green et al., 2002; Wang et al., 2005; Tsai et al., 2010; Latz et al., 2013). These studies, and recent findings from Alzheimer’s disease mouse models revealing that IL-1 overexpression leads to increased plaque-associated activated microglia, decreased amyloid burden, and increased tau phosphorylation (Prinz et al., 2011; Ghosh et al., 2013) highlight the potentially crucial roles of the IL-1/IL1RAP pathway in modulating Alzheimer’s disease pathology.
Microglial activation pathways are leading candidates for promoting amyloid clearance and limiting plaque development. Variants in TREM2 (triggering receptor expressed on myeloid cells 2) thought to impair microglial phagocytic function have been associated with increased Alzheimer’s disease risk (Guerreiro et al., 2013; Jonsson et al., 2013) and large-scale pathway and network analyses have also implicated activated microglia in Alzheimer’s disease pathogenesis (Jones et al., 2010; Zhang et al., 2013). Along with recent studies relating loss of microglial function to worsening amyloid pathology (Bradshaw et al., 2013; Chakrabarty et al., 2015; Condello et al., 2015; Johansson et al., 2015), the discovery that IL1RAP is associated with higher rates of amyloid accumulation and lower signal of a PET marker for microglial activation provides strong reinforcement for this hypothesis.
IL1RAP is a known therapeutic target for leukaemia (Barreyro et al., 2012; Askmyr et al., 2013) and chronic inflammatory diseases such as rheumatoid arthritis (Gabay et al., 2010; Dinarello, 2011). Pathway analysis of a large Alzheimer’s disease case-control GWAS (Harold et al., 2009) (n = 11 789) identified association of immune-related pathways with a significant contribution from IL1RAP, including a top Alzheimer’s disease risk SNP (rs4571225; P = 1.26 × 10⁻⁵) which is not a proxy for, but is in moderate linkage disequilibrium with rs12053868 (r2 = 0.003; D’ = 0.63) (Jones et al., 2010). An intergenic SNP (rs9877502) 290 kb downstream of IL1RAP also displayed genome-wide significant association with cross-sectional CSF tau levels (Cruchaga et al., 2013), but this SNP is not in linkage disequilibrium with rs12053868 (r2 = 0.003; D’ = 0.10). Prior to our study, IL1RAP rs12053868 had not been previously reported in an Alzheimer’s disease genetic association study. Our new association for this SNP may reflect a relative specificity for amyloid accumulation versus the more heterogeneous case-control status (Kendler and Neale, 2010), increased power obtained via endophenotype analysis (Potkin et al., 2009), or previous suggestive association below reporting thresholds.
IL1RAP is highly expressed in the brain but seems to be downregulated in prefrontal cortex with increasing age (Kang et al., 2011; Primiani et al., 2014). Although it is not a coding SNP, rs12053868 may be associated with decreased IL1RAP expression in the cortex and hippocampus based on preliminary data (Supplementary Fig. 10). There is substantial precedent for non-coding SNPs to have functional effects (Kapranov et al., 2007; Consortium, 2012; De Jager et al., 2014), and intronic IL1RAP SNPs have previously been associated with plasma levels of soluble IL1RAP, including a top SNP (rs724608; P = 8.81 × 10⁻¹³) which is in moderate linkage disequilibrium with rs12053868 (r2 = 0.005; D’ = 0.45) (Lourdusamy et al., 2012). However, functional genomics studies in brain tissue will be needed to further characterize the IL1RAP locus and its potential impact on Alzheimer’s disease pathogenesis.
Following the GWAS discovery, we related IL1RAP rs12053868-G to other longitudinal Alzheimer’s disease endophenotypes. In particular, the observed effect of rs12053868 on clinical progression in MCI argues for further study of the impact of IL1RAP on clinical trajectories in pre-MCI states. This result also suggests that in combination with APOE, other known Alzheimer’s disease risk genes, and family history, IL1RAP might be useful for risk enrichment in clinical trial design and risk stratification in study analysis or as part of personalized genetic susceptibility tests for Alzheimer’s disease onset or progression.
Using gene sequence data from a subset of the GWAS sample, we identified a pooled association of low-frequency and rare IL1RAP variants with the rate of amyloid accumulation. Although larger samples will facilitate assessment of the effects of individual rare variants, this finding bolsters the initial GWAS discovery of IL1RAP, as genes truly related to disease pathogenesis are likely to contain associated common and rare variants (Zuk et al., 2014).
Suggestive associations were identified through GWAS and may have reached genome-wide significance with a larger sample. These included SNPs in JAM2, adjacent to APP on chromosome 21. Mutations in APP are among the causes of early-onset Alzheimer’s disease (Bettens et al., 2013) and a rare variant in APP was found to be protective against late-onset Alzheimer’s disease (Jonsson et al., 2012). SNPs near APP were also associated with amyloid plaque burden in a neuropathological study of post-mortem brain tissue (Shulman et al., 2013). Notably, the top SNP from that study (rs2829887) is in strong linkage disequilibrium with the top JAM2 SNP (rs8129913) from our analysis of longitudinal amyloid PET (r2 = 0.57; D’ = 0.91). In addition, JAM2 (P = 1.59 × 10⁻⁴) and APP (P = 0.048) each displayed uncorrected gene-level P < 0.05 in our study. These suggestive findings argue for further investigation of the JAM2-APP locus to clarify the potential functional gene(s) and causal variant(s) related to amyloid pathology.
Complementary gene- and pathway-based analyses were used to test for collective effects of multiple variants within shared functional units (Ramanan et al., 2012b). Gene-based analysis uniquely identified additional candidates for further study, and enrichment of GWAS association was identified in pathways related to the complement system, cell adhesion, and Notch transcription, as well as the IL-1 pathway overall. Activation of cell adhesion and complement receptors are crucial for microglia to recognize, aggregate around, and ultimately clear amyloid deposits (Ramanan and Saykin, 2013; Doens and Fernandez, 2014). Notch has key roles in regulating neuronal plasticity but these activities depend on its initial cleavage by γ-secretase, the enzyme also responsible for generating amyloid-β (Mattson, 2003).
All SNPs tested in the GWAS were estimated to collectively explain 34% of the variance in 2-year change in brain amyloid PET burden, a considerable proportion given the modest sample used for GWAS. Although amyloid deposition and clearance are dynamic processes with unknown heritability, our findings indicate that the rate of amyloid accumulation has a substantial genetic component and suggest that additional genetic variants, as well as gene–gene and gene–environment interactions, may be discovered in future using larger samples and complementary analytical approaches.
This work has several limitations. Although we leveraged publicly available ADNI genetics and longitudinal amyloid PET data to perform this original study, our sample size had limited power for a GWAS (Supplementary Fig. 11). The future availability of comparable data from larger samples will allow for suitable replication testing and additional discovery. Functional genomics experiments not performed here, including microglial immunohistochemistry and analyses of IL1RAP knockout and antibody- and siRNA-based knockdown models, will also be needed to characterize our novel finding. In particular, studies of brain tissue, rather than blood genomic DNA, will be better able to assess for epigenetic and transcriptomic events that may elucidate the mechanistic relationship between IL1RAP and amyloid accumulation. Further, while it could not be appropriately addressed with presently available data, analyses of serial CSF samples would help assess whether IL1RAP impacts soluble and oligomeric forms of amyloid. Finally, candidate PET radiotracers selective for tau aggregation in the brain are also now in clinical trials (Villemagne et al., 2015), and if validated, would aid investigation of the potential relationship between the IL-1/IL1RAP pathway and tau pathology.
In conclusion, we discovered a new association of IL1RAP rs12053868 with higher rates of amyloid accumulation on longitudinal 18F-florbetapir PET and we related this SNP to other Alzheimer’s disease endophenotypes, including clinical progression, cognitive decline, temporal cortex atrophy on MRI, and lower signal of a PET marker of microglial activation. The biological roles of IL1RAP in amyloid deposition and clearance, particularly in relation to microglial function, merit further investigation and may have significant implications for risk stratification and therapeutic development in Alzheimer’s disease.
Funding
ADNI is funded by the National Institute on Aging, the National Institute of Biomedical Imaging and Bioengineering, and through generous contributions from the following: Alzheimer’s Association; Alzheimer’s Drug Discovery Foundation; BioClinica, Inc.; Biogen Idec Inc.; Bristol-Myers Squibb Company; Eisai Inc.; Elan Pharmaceuticals, Inc.; Eli Lilly and Company; F. Hoffmann-La Roche Ltd and its affiliated company Genentech, Inc.; GE Healthcare; Innogenetics, N.V.; IXICO Ltd.; Janssen Alzheimer Immunotherapy Research & Development, LLC.; Johnson & Johnson Pharmaceutical Research & Development LLC.; Medpace, Inc.; Merck & Co., Inc.; Meso Scale Diagnostics, LLC.; NeuroRx Research; Novartis Pharmaceuticals Corporation; Pfizer Inc.; Piramal Imaging; Servier; Synarc Inc.; and Takeda Pharmaceutical Company. Private sector contributions are facilitated by the Foundation for the National Institutes of Health (www.fnih.org). The grantee organization is the Northern California Institute for Research and Education, and the study is coordinated by the Alzheimer's Disease Cooperative Study at the University of California, San Diego. ADNI data are disseminated by the Laboratory for Neuro Imaging at the University of Southern California. Data collection and sharing are funded by the National Institutes of Health (NIH) grant U01 AG024904 and Department of Defense award number W81XWH-12-2-0012. Biospecimen sample processing, storage, and distribution were provided by the NIH-sponsored National Cell Repository for Alzheimer's Disease (NCRAD), supported by U24 AG21886. Additional ADNI support comes from the NIH grants P30 AG010129 and K01 AG030514. The Canadian Institutes of Health Research is providing funds to support ADNI clinical sites in Canada. Funding for whole genome sequencing in ADNI participants was provided by the Alzheimer’s Association and the Brin Wojcicki Foundation. Supercomputing support for genome sequencing analyses was provided in part by the National Science Foundation (NSF) grant CNS-0521433 and the Lilly Endowment through its support for the Indiana University Pervasive Technology Institute and Indiana METACyt Initiative. The authors are grateful to the team at Indiana University UITS Research Technologies, particularly Robert Henschel, Huian Li, Steve Simms, Nathan Heald, and Nathan Lavender, for their assistance with genome sequencing analyses. For IMAS, we acknowledge the support of NIH R01 AG19771 and P30 AG10133, as well as the Indiana CTSI (NIH grants U54 RR025761, RR027710-01, and RR020128) and also thank the radiochemistry team, Kevin Perry, Michele Beal, and Courtney Robbins for scan acquisition. For ROS and MAP, the authors acknowledge the support of the Rush Alzheimer’s Disease Center and NIH R01 AG15819, AG17917, AG34374, P30 AG10161, and P01 AG09466. Data management and the specific analyses reported here were also supported by NIH R01 LM011360 and R00 LM011384, as well as NSF IIS-1117335. The authors declare no conflicts of interest.
Supplementary material
Supplementary material is available at Brain online.
Abbreviations
- ADNI
Alzheimer’s Disease Neuroimaging Initiative
- GWAS
genome-wide association study
- MCI
mild cognitive impairment
- SNP
single nucleotide polymorphism
- SUV(R)
standardized uptake value (ratio)
References
Author notes
*Data used in preparation of this article were obtained from the Alzheimer’s Disease Neuroimaging Initiative (ADNI) database (http://adni.loni.usc.edu). As such, the investigators within the ADNI contributed to the design and implementation of ADNI and/or provided data but did not participate in analysis or writing of this report. A complete listing of ADNI investigators can be found at: http://adni.loni.usc.edu/wp-content/uploads/how_to_apply/ADNI_Acknowledgement_List.pdf/. For additional details and up-to-date information, see http://www.adni-info.org.

