


Abstract
Temporal lobe seizures have a significant chance to induce impairment of normal brain functions. Even after the termination of ictal discharges, during the post-ictal period, loss of consciousness, decreased responsiveness or other cognitive dysfunctions can persist. Previous studies have found various anatomical and functional abnormalities accompanying temporal lobe seizures, including an abnormal elevation of cortical slow waves. Intracranial electroencephalography studies have shown a prominent increase of lower frequency components during and following seizures that impair (complex partial seizures) but not those that preserve (simple partial seizures) normal consciousness and responsiveness. However, due to the limited spatial coverage of intracranial electroencephalography, the investigation of cortical slow waves cannot be easily extended to the whole brain. In this study, we used scalp electroencephalography to study the spectral features and spatial distribution of post-ictal slow waves with comprehensive spatial coverage. We studied simple partial, complex partial and secondarily generalized seizures in 28 patients with temporal lobe seizures. We used dense-array electroencephalography and source imaging to reconstruct the post-ictal slow-wave distribution. In the studied cohort, we found that a ‘global’ spectral power shift to lower frequencies accompanied the increased severity of seizures. The delta spectral power relative to higher frequency bands was highest for secondarily generalized seizures, followed by complex partial seizures and lastly simple partial seizures. In addition to this ‘global’ spectral shift, we found a ‘regional’ spatial shift in slow-wave activity. Secondarily generalized seizures and complex partial seizures exhibited increased slow waves distributed to frontal areas with spread to contralateral temporal and parietal regions than in simple partial seizures. These results revealed that a widespread cortical network including temporal and fronto-parietal cortex is involved in abnormal slow-wave activity following temporal lobe seizures. The differential spectral and spatial shifts of post-ictal electroencephalography activity in simple partial, complex partial and secondarily generalized seizures suggest a possible connection between cortical slow waves and behavioural and cognitive changes in a human epilepsy model.
Introduction
Loss of normal brain function is one of the most common symptoms accompanying epileptic seizures. Partial seizures can be divided into simple partial seizures and complex partial seizures, with the former preserving and the latter impairing normal responsiveness or consciousness (Commission of International League Against Epilepsy, 1981). Partial seizures can occasionally develop into secondarily generalized seizures, which recruit widespread brain regions (Engel, 1989; Blumenfeld et al., 2009) and can induce deep unconsciousness. In temporal lobe seizures, the most common form of epilepsy, patients have a significant chance of experiencing loss of responsiveness and consciousness (Engel, 1989; Lee et al., 2002; Arthuis et al., 2009; Englot et al., 2010). After the termination of seizures, there can be a post-ictal period (Fisher and Schachter, 2000; Hammers et al., 2007), during which patients may experience confusion, decreased responsiveness, memory deficits, disorientation and other cognitive deficits (Fisher and Schachter, 2000). The post-ictal state is the time in which the brain recovers from the trauma caused by seizures before regaining normal function. This abnormal state can last anywhere from minutes to hours, and is generally longer in the case of more severe seizures, such as generalized seizures.
The phenomenon of loss of consciousness and responsiveness has been investigated in several different models, such as coma (Bickford and Butt, 1955), anaesthesia (Alkire et al., 2008) and slow-wave sleep (Hofle et al., 1997; Massimini et al., 2005). Studies have suggested that loss of consciousness can be associated with abnormal subcortical/cortical activity, the breakdown of subcortical-to-cortical and cortical-to-cortical integration, or the loss of discriminable firing patterns that code higher-order information processing (Hofle et al., 1997; Massimini et al., 2005; Alkire et al., 2008). In temporal lobe epilepsy, anatomical and functional abnormalities have been found, either permanently or temporarily. In patients with epilepsy-induced cognitive dysfunctions, studies have found altered functions of temporal cortex, subcortical structures and corticothalamic connectivity (Lux et al., 2002; Guye et al., 2006; Arthuis et al., 2009; Blumenfeld et al., 2009). In addition to the dysfunctions of the epileptogenic network, recent neuroimaging studies have discovered decreased activity in neocortical fronto-parietal regions in epileptic brains. Single-photon emission computed tomography (SPECT) and functional MRI measured decreased cerebral blood flow and blood oxygen level-dependent signals, respectively, in the fronto-parietal cortex, overlapping with the default mode network, during different types of epileptic activities (Gotman et al., 2005; Laufs et al., 2006; Bai et al., 2010; Siniatchkin et al., 2010; Grouiller et al., 2011). This deactivation occurs during seizures and persists into the post-ictal period (Blumenfeld et al., 2009).
EEG and intracranial EEG studies have recorded abnormal slow-wave activity in patients with seizure-induced dysfunctions. Post-ictal (Hufnagel et al., 1995; Jan et al., 2001) or background (Panet-Raymond and Gotman, 1990; Tao et al., 2011) slow waves in the temporal lobe have long been reported. The post-ictal slowing has a significant chance of lateralizing to the temporal lobe of seizure onset (Hufnagel et al., 1995; Jan et al., 2001). Not until recently has the presence of neocortical slow-wave activity in the fronto-parietal lobe been implicated to seizure-induced behavioural changes. Recent intracranial EEG studies have recorded increased slow waves in lateral fronto-parietal electrodes during ictal and post-ictal periods. The elevation of slow-wave activity, especially delta-band activity (<4 Hz), was correlated with behavioural changes in simple partial and complex partial seizures (Blumenfeld et al., 2004; Englot et al., 2010). However, intracranial EEG lacks the spatial coverage that is necessary to investigate slow-wave activity in the whole brain. The cortical coverage from intracranial EEG depends on the placement of the electrode array, which can vary significantly between patients. The implanted electrodes usually cover the seizure onset zones (e.g. bilateral temporal lobes in temporal lobe epilepsy) to a suitable extent, as the delineation of the seizure onset zones is of most clinical importance. However, other cortical areas, such as the medial and lateral fronto-parietal cortex, may be poorly sampled by the intracranial EEG array.
In the present study, we used dense-array scalp EEG to study post-ictal slow-wave activity in a group of 28 patients with temporal lobe seizures. The seizures were categorized to simple partial, complex partial and secondarily generalized seizures according to behavioural changes during and after seizures. Previous studies have demonstrated that the behavioural and cognitive changes, deactivation of metabolic signals, and elevation of slow-wave activity can persist into the post-ictal state (Fisher and Schachter, 2000; Blumenfeld et al., 2004, 2009; Englot et al., 2010). We studied the post-ictal period in order to focus the analysis on slow waves, while excluding the active portion of ictal rhythmic discharges. We used dense-array EEG and the EEG source imaging technique to reconstruct the common spatial distribution of slow waves across the group of patients, despite the difference between individuals. We further investigated the variation of spectral and spatial features of post-ictal EEG signals in simple partial, complex partial and secondarily generalized seizures.
Materials and methods
Patients and data acquisition
We studied 28 adult patients who underwent a pre-surgical evaluation for medically intractable temporal lobe epilepsy at the Mayo Clinic in Rochester, MN. The study was approved by the Institutional Review Board (IRB) of the University of Minnesota (Minneapolis, MN) and the Mayo Clinic (Rochester, MN). All patients gave written informed consent before entering the study.
Each patient underwent long-term dense-array EEG monitoring using a 76-channel system (XLTEK, Natus Medical Incorporated). A total number of 76 individual electrodes were attached to the scalp according to a 10–10 montage. The EEG signals were recorded with a 1–70 Hz band-pass filter and a 500 Hz sampling rate. Patients were selected for the analysis if the epileptogenic zone involved the left or right temporal lobe, as determined by successful resective surgery, intracranial EEG measurement, and/or ictal scalp EEG. Detailed information of patients studied, including their surgical outcome, intracranial EEG and EEG measurements can be found in Supplementary Table 1.
Behavioural analysis
In order to determine whether patients experienced any impairment in responsiveness or consciousness, they were presented with questions, simple commands and a memory phrase such as ‘remember purple banana’. After the seizure they were asked to recall the memory phrase. If patients did not respond to questions or commands, or were unable to recall a memory phrase, they were classified as having complex partial seizures. If patients were fully alert and appropriately responsive throughout the event and recalled the memory phrase, they were classified as having simple partial seizures. Seizures that had developed to secondary generalization were also identified if ictal discharges propagated to a widespread portion of the brain after a short period of focal activation. The identification of the secondarily generalized seizures agreed with the symptoms recorded by videos or clinical notes.
Data analysis
The continuous EEG was reviewed by experienced epileptologists and EEG technicians. For each patient, seizures were identified and the end of each seizure was considered as the EEG offset of ictal rhythmic discharges. In some seizures, the offsets were difficult to decipher because of pronounced artefacts before and after the seizures terminated. In these cases, the seizure offset was determined as the time when the artefacts or noise subsided. Seizure duration, defined as the time from seizure onset to offset, varied significantly between patients. In the studied cohort, the mean seizure duration was 75 ± 37 s for simple partial, 90 ± 41 s for complex partial and 210 ± 165 s for secondarily generalized seizures. Approximately 1 min of post-ictal EEG was segmented following the seizure offset. Electrodes and periods of EEG signals with significant artefacts and noise were removed from the analysis. In patients with fewer seizures, relatively longer post-ictal EEG periods were segmented. In the post-ictal period of secondarily generalized seizures, there can be a period of suppression of widespread brain areas, during which the EEG signal is ‘quiet’ and ‘smooth’ with a substantial decrease of voltage (Blumenfeld et al., 2004). Following this suppression can be a ‘burst-and-suppression’ pattern, in which bursts of slow-wave activity are seen once every several seconds. In these cases, we analysed the post-ictal EEG on average 75 s after the seizure offset (can be shorter or longer because of the variation of the suppression period between patients) with slow waves or the burst-and-suppression pattern, because this pattern contains large amplitude slow waves and resembles slow-wave bursts that have been observed in other states of altered consciousness, such as anaesthesia (Alkire et al., 2008; Liu et al., 2011).
The analysis of the post-ictal EEG is summarized by the schematic flow chart displayed in Fig.1. The post-ictal EEG of each seizure was first filtered using a 1–30 Hz band-pass filter. For each patient, post-ictal EEG segments of the same seizure types (simple partial, complex partial, or secondarily generalized) were concatenated and submitted to extended infomax independent component analysis (Delorme and Makeig, 2004). Each independent component can be represented by a spatial map that indicates the source location, as well as a time course that represents the source temporal dynamics. The independent components with extra-cerebral origins such as eye blinks, eye movements and muscle activity were rejected (Jung et al., 2000). Dipolar sources were fitted to the spatial map of each of the remaining independent components (Delorme and Makeig, 2004). Components that could not be explained by dipolar sources (with a residual variance of >25%) were rejected (Delorme and Makeig, 2004; Jung et al., 2009). The remaining independent components were considered physiologically plausible signal independent components (Makeig et al., 2002; Nam et al., 2002; Debener et al., 2006; Yang et al., 2010), representing rhythmic activities of the functional networks in the post-ictal brain. The EEG signals can be de-noised by removing the artefactual independent components and regenerating EEG time courses.
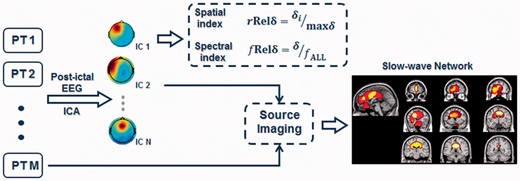
Schematic flow chart of the data analysis protocol. Two indices, relative spatial delta power and relative spectral delta power were used to quantify the spatial and spectral features of post-ictal EEG. Independent component analysis (ICA) and EEG source imaging were used to find the spatial distribution of post-ictal slow waves. IC = Independent Component; PT = Patient.
Two indices—relative spatial delta power (with r indicating ‘spatial’) and relative spectral delta power
(with f indicating ‘spectral’) were used to measure the spatial and spectral features of the delta-band activity in the different seizure types. A Fast Fourier transform was used to calculate the spectral properties of each time course. The spectral power of a frequency band was determined by integrating the spectral power within the frequency band. The power of delta-band activity was calculated by integrating spectral power from 1 to 4 Hz.
The first index of delta power, measures the delta power in one region normalized by the maximum across regions. From the de-noised EEG, the EEG sensors can be grouped by their scalp locations into N regions (e.g. frontal region versus temporal region). The relative spatial delta power of one region is
where
is the mean delta power of a region and
is the maximum mean delta power amongst all regions. The
is a ratio in the range of [0,1] which reflects the spatial delta distribution. The
can also be calculated for independent components, as the scalp maps of independent components indicate different cortical distributions. When N independent components are derived for a seizure, the
for each independent component is calculated as
where
is the delta power of an independent component and
is the maximum delta power of all independent components. The index of relative spatial delta power could also be affected by an increase or decrease of total EEG power, which would affect all frequency bands including 1–4 Hz.
The second index of delta power, measures the delta power relative to the total spectral power from 1 to 30 Hz. For a time course
the relative spectral delta power can be calculated as
where
is spectral power of the time course in the delta band (1–4 Hz) and
is the spectral power in the band of 1–30 Hz. In this way, the relative spectral delta power can be calculated for the time course of an EEG channel or for the time course of an independent component. The relative spectral delta power,
and relative spatial delta power,
thus measure different aspects of EEG signals, as the former measures how the EEG power shifts in the frequency domain and the latter measures how the EEG power shifts in the spatial domain.
We studied the post-ictal EEG of three types of seizures: simple partial, complex partial and secondarily generalized seizures. From de-noised EEG, the and
were calculated for electrodes covering different regions. The group means of the two indices in each region were calculated for each seizure type. Derived from independent component analysis, the independent components of all seizures were then clustered using the k-means clustering technique (Seber, 1984; Spath, 1985). The scalp map and dipole location for each independent component were inputs for the k-means clustering, and the squared Euclidean distance was used as the distance function of the k-mean cluster (Seber, 1984; Spath, 1985; Delorme and Makeig, 2004). We first separated the signal components into 20 clusters using the k-means clustering technique, then combined clusters with similar scalp potential distributions into left/right temporal, left/right frontal, orbito-frontal, dorsal medial frontal, central-parietal, left/right parietal and occipital clusters. The
and
were also calculated for each independent component. The group means of the two indices were calculated for each seizure type within each cluster. More details of the method can be found in the Supplementary material.
The cortical source distribution of a cluster was computed by solving the EEG inverse problem to estimate a source distribution from the cluster’s centroid. Each cluster’s centroid map was the averaged scalp map of all components in a cluster. We used a standard head model provided by the Montreal Neurological Institute (MNI) (Collins et al., 1998), a realistic boundary element model consisting of three conductive layers of skin, skull and brain (He et al., 1987; Hamalainen and Sarvas, 1989; Fuchs et al., 1998), and a cortical current density source model (Dale and Sereno, 1993). A sLORETA-weighted minimum norm (SWARM) source imaging algorithm (Wagner et al., 2007) was utilized to estimate a cortical source distribution for each cluster. The cortical distributions of different clusters were displayed and overlapped on a MNI cortex model to visualize the slow-wave network.
The patients included in this study had left temporal, right temporal or bilateral temporal lobe seizure onset. In the previously mentioned analysis, the difference between seizures with left temporal lobe onset and right temporal lobe onset was not considered. Therefore the difference caused by the effect of seizure onset is not accounted for in the group analysis. We therefore specify this analysis and the associated results as L–R (Left–Right-not-specified) analysis. In order to divide the EEG responses into the ipsilateral hemisphere and contralateral hemisphere of the seizure onset zones, we also performed an IL–CL (IpsiLateral–ContraLateral-specified) analysis. In patients with right temporal lobe seizure onset, the EEG signals were changed so the ipsilateral activity was displayed on the left side and the contralateral activity was displayed on the right side. The group-level relative spatial delta power and relative spectral delta power, and slow-wave source distribution were also computed for the IL–CL analysis.
Results
We studied the post-ictal EEG recordings of 22 simple partial, 60 complex partial and 18 secondarily generalized seizures. Supplementary Fig. 1 shows an example EEG in a complex partial seizure. Following the termination of the ictal discharges (Supplementary Fig. 1; 0 s), the EEG signal differed from the pre-ictal state. The post-ictal EEG included increased low-frequency activity lateralized to the ipsilateral hemisphere of seizure onset.
Global spectral shift of post-ictal electroencephalography
We first examined the in EEG during four different behavioural conditions (the post-ictal periods of simple partial, complex partial and secondarily generalized seizures, and baseline). The relative spectral delta power, as defined in the methods section, measures the percentage of the delta-band power relative to the 1–30 Hz total spectral power in a time course. From the de-noised EEG signals, the mean
was calculated for electrodes covering the left/right temporal, frontal, central, parietal and occipital regions, respectively. The relative spectral delta power (Fig. 2) showed increased activity in the delta band accompanying the increased severity of seizures. Secondarily generalized seizures showed the highest relative spectral delta power, followed by complex partial seizures and simple partial seizures. The statistical significance of the difference between seizure types was tested using an unpaired t-test. The difference of
was statistically significant between simple partial and complex partial seizures (P < 0.005), simple partial and generalized seizures (P < 0.0005), and complex partial and generalized seizures (P < 0.05). The relative spectral delta power was also computed in a 1 min uninterrupted background EEG of each patient [Fig. 2; grey shaded area shows the mean ± standard deviation (SD) of baseline]. The value of
in simple partial seizures was no greater than that of the baseline state, whereas complex partial and secondarily generalized seizures both showed greater
than the baseline EEG.
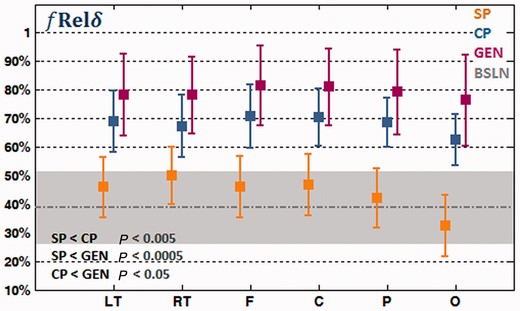
Relative spectral delta power, of the left temporal (LT), right temporal (RT), frontal (F), central (C), parietal (P) and occipital (O) electrodes in the post-ictal EEG of simple partial seizures (SP), complex partial seizures (CP) and secondarily generalized seizures (GEN). The average baseline (BSLN) relative spectral delta power of all regions is indicated by a grey dotted line and the standard deviation is indicated by a grey-shaded area.
Although the relative spectral delta power changed substantially across different conditions, the variation among temporal, frontal, central, parietal and occipital regions within each condition was relatively small (Fig. 2). The spectral shift to lower frequencies in different seizure types appears to be a global effect including widespread regions of the brain.
Regional spatial shift of slow waves
We then examined the regional variation and spatial distribution of post-ictal slow waves for the three seizure types. Figure 3A shows the clustered components with group-level relative spatial delta power for the IL–CL (IpsiLateral–ContraLateral-specified) analysis. The relative spatial delta power, as defined above, is a spatial index quantifying the delta power of a region normalized by the maximum across regions. The clusters in Fig. 3A are ordered by the mean value of of complex partial seizures in each cluster.
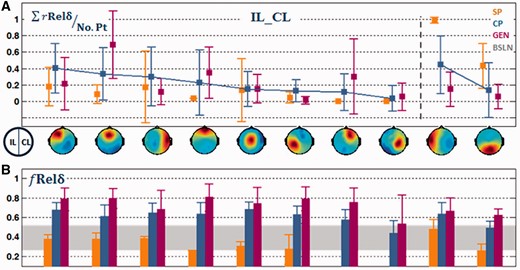
IL–CL analysis. (A) Clustered components ordered by the mean of complex partial seizures in each cluster. The first category of the first to eighth clusters showed relatively higher in complex partial than in simple partial seizures. Whereas the second category of the 9th–10th showed higher in simple partial than in complex partial seizures. Clusters with left-, medial-, and right- orbitofrontal foci were combined into an orbito-frontal cluster, and clusters with temporal and posterior temporal foci were combined into a temporal cluster for presentation purposes. However, these clusters were analysed separately for subsequent source analysis. (B) The mean relative spectral delta power in each cluster. Note that for this analysis, the left side of the EEG scalp map indicates the ipsilateral side to seizure onset while the right side indicates contralateral side.
For post-ictal EEG of simple partial seizures, the ipsilateral temporal region displayed the highest (Fig. 3A; ninth cluster). However, for complex partial and secondarily generalized seizures, the post-ictal EEG
decreased in the ipsilateral temporal region but increased in other regions, especially frontal regions (Fig. 3A; first, second, fourth and seventh clusters). We presented the clusters in two different categories. The first category included clusters (Fig. 3A; first eight clusters) that showed higher mean
in complex partial seizures than in simple partial seizures. In these clusters, the most prominent slow waves were seen in the frontal regions. The frontal slow waves were lateralized to the ipsilateral hemisphere in complex partial seizures (Fig. 3A; first cluster versus seventh cluster), but were stronger in medial-frontal and orbito-frontal regions in secondarily generalized seizures (Fig. 3A; second and fourth clusters). The contralateral temporal region (Fig. 3A; third cluster) displayed a larger
in complex partial than in simple partial seizures, which is consistent with the previous observation that complex partial seizures have a higher chance of affecting both temporal lobes (Lux et al., 2002; Englot et al., 2010). The cluster with medial centro-parietal focus (Fig. 3A; fifth cluster) also showed slow waves, but the difference between the three types of seizures was minimal. Other clusters, such as parietal clusters (Fig. 3A; sixth and eighth clusters), appeared in a small number of patients.
The second category of clusters (Fig. 3A; ninth and tenth clusters) showed higher for simple partial seizures than for complex partial seizures. The ipsilateral temporal cluster (Fig. 3A; ninth cluster) displayed the largest
than any other clusters for simple or complex partial seizures. However, the value of
in this cluster was much smaller in complex partial than in simple partial seizures. The occipital cluster (Fig. 3A; tenth cluster) also appeared most frequently in simple partial seizures. This cluster displayed the highest relative spectral alpha power than all other clusters (the alpha power was not shown here). The occipital cluster was not involved in further source analysis, as it is likely to be associated with the occipital alpha rhythm, which is common in resting state EEG.
The source imaging results (Fig. 4) further localized the clusters of post-ictal slow waves to anatomical structures. The source distribution (Fig. 4A) of the first category of clusters displayed higher in complex partial and generalized seizures than in simple partial seizures. The source distribution of each cluster was weighted by the mean
of complex partial seizures and superposed on the cortical surface of a MNI cortex model (Fig. 4A). These clusters recruit the lateral frontal, prefrontal and dorsal medial frontal cortex, with spread to the contralateral temporal and parietal cortex. In Fig. 4B, we displayed the source maps of the ipsilateral temporal cluster of the second category, for which
was higher for simple partial seizures (Fig. 3A), along with that of the contralateral temporal cluster. Consistent with Fig. 3A, the slow waves in the ipsilateral hemisphere (Fig. 4A and B) were higher than those in the contralateral hemisphere. Secondarily generalized seizures showed a similar location of slow-wave activity (Fig. 4C). However, the regional
differed in magnitude between complex partial and secondarily generalized seizures, as the
in the frontal region was higher for generalized seizures than for complex partial seizures (Fig. 3A).
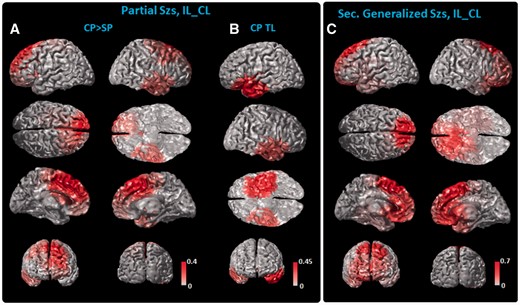
IL–CL source analysis. (A) Cortical slow-wave distribution of the first to eighth clusters as shown Fig. 3, which had higher in complex partial (CP) than in simple partial (SP) seizures, and (B) the ipsilateral and contralateral temporal (CP TL) slow-wave distribution. The source maps of clusters are weighted by their relative of complex partial seizures, summed and displayed on the cortex model. In secondarily generalized seizures (Sec. Generalized Szs), the slow-wave distribution (C) showed similar spatial coverage. Note that for this analysis the left side denotes the ipsilateral side to seizure onset while the right denotes the contralateral side. The color bar is scaled to the maximal value of each category as shown in Fig. 3.
To visualize the difference of the between the two types of partial seizures, the source map of each cluster was weighted by the difference of the
between complex and simple partial seizures. The weighted source maps of each cluster were then summed in the source space and plotted on the cortical surface (Supplementary Fig. 4). Only positive values (complex partial seizures larger than simple partial seizures) are displayed in Supplementary Fig. 4. Consistent with the scalp maps (Fig. 3A), the most prominent differences were seen in the lateral-frontal, prefrontal and medial-frontal cortex, with spread to the contralateral temporal and parietal cortex.
The results of the L–R (Left–Right-not-specified) analysis can be found in the Supplementary material. Supplementary Fig. 2 shows that for the post-ictal EEG of simple partial seizures, the left/right temporal region displayed the highest (Supplementary Fig. 2A, eighth and ninth cluster). However, for complex partial and secondarily generalized seizures, the
decreased in temporal regions but increased most prominently in clusters with a medial frontal, left/right frontal, and prefrontal focus (Supplementary Fig. 2A and 3).
The most prominent differences in the regional distribution of post-ictal slow waves for the different types of seizures were in temporal and frontal regions. From the de-noised EEG, we further calculated the mean for electrodes covering the temporal and frontal regions. An unpaired t-test was conducted to test the statistical significance of the difference between seizure types. Figure 5 shows that the
in the ipsilateral temporal region decreased from simple partial to complex partial to secondarily generalized seizures. However, the
in frontal regions increased from simple partial to complex partial and generalized seizures. These differences were statistically significant and the P-value of each individual test can be found in Fig. 5. A paired t-test was also conducted to test the statistical significance of the difference between ipsilateral and contralateral temporal regions and between ipsilateral and contralateral frontal regions. The ipsilateral temporal and frontal regions displayed higher
than the contralateral temporal and frontal regions, respectively, in partial seizures (P < 0.05). The differences between the two hemispheres, however, were not significant in secondarily generalized seizures.
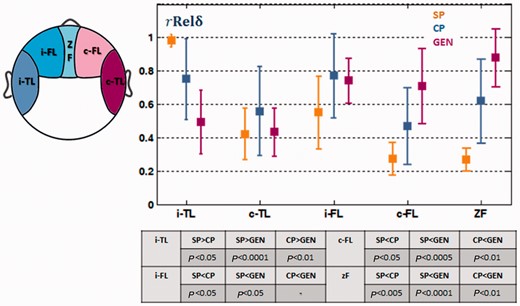
The of electrodes covering ipsilateral temporal (i-TL), contralateral temporal (c-TL), ipsilateral frontal (i-FL), contralateral frontal (c-FL) and midline frontal (zF) regions. The difference between simple partial (SP), complex partial (CP) and secondary generalized seizures (GEN) and different regions were statistically tested. The P-value of each individual test is shown in the table.
Discussion
The present study investigated the spectral and spatial differences of the post-ictal EEG in simple partial, complex partial and secondarily generalized seizures. Associated with the increased severity of seizures, we found a ‘global’ elevation of the relative spectral delta power (delta-band power relative to 1–30 Hz total power) over widespread brain regions. In addition to the ‘global’ spectral shift, we found a ‘regional’ difference, in which the relative spatial delta power (delta-band power in one region normalized by the maximum across regions) decreased in the ipsilateral temporal region but increased in other regions, especially the frontal region, in complex partial and secondary generalized seizures. The post-ictal slow-wave network recruits the temporal, lateral-frontal, prefrontal and dorsal-medial-frontal cortex, with spread to the parietal regions. This network partially overlaps with fronto-parietal cortical regions, which have previously shown decreased cerebral blood flow/blood oxygen level dependence during epileptic activities (Gotman et al., 2005; Laufs et al., 2006; Bai et al., 2010; Siniatchkin et al., 2010; Grouiller et al., 2011).
Spatial distribution of slow waves
Dysfunctions in the temporal lobe, as well as disruptions of subcortical structures, have long been associated with seizure-induced cognitive problems. The verbal-memory functions of the temporal lobe (Kelley et al., 1998) may explain the memory deficits and impairments of expressive and receptive speech that are frequently observed in temporal lobe seizures (Lux et al., 2002). However, temporal lobe dysfunctions alone cannot fully explain the loss of consciousness, which requires interaction between the subcortical structures and the neocortical fronto-parietal regions (Guye et al., 2006; Arthuis et al., 2009). Recent SPECT/functional MRI studies have discovered cerebral blood flow/blood oxygen level dependence activation in subcortical structures (Lee et al., 2002; Blumenfeld et al., 2009) accompanied with deactivation in the fronto-parietal cortex (Gotman et al., 2005; Laufs et al., 2006; Bai et al., 2010; Siniatchkin et al., 2010; Grouiller et al., 2011). Consistent with these neuroimaging studies, intracranial EEG studies have recorded fronto-parietal slow waves in epileptic seizures that impair consciousness (Blumenfeld et al., 2004; Englot et al., 2010). Studies have hypothesized a ‘network inhibition’ mechanism (Englot et al., 2010), in which subcortical structures send inhibitory output to neocortical neurons and induce the suppression of consciousness. A reciprocal cortico–subcortical connection is also possible, and the neocortex may have an active role in the suppression of consciousness (Alkire et al., 2008). In the current study, we focused solely on the cortical slow waves, so the connection between the cortex and subcortical structures cannot be examined.
To improve the spatial coverage of intracranial EEG, we used dense-array EEG and source imaging techniques to reconstruct a whole-brain distribution of the slow-wave activity. In line with previous studies, but with more spatial coverage, our results indicated that cortical slow waves were most prominent in the temporal (Hufnagel et al., 1995; Jan et al., 2001; Blumenfeld et al., 2004) and lateral frontal cortex (Englot et al., 2010). In addition to these regions, we found prominent slow waves in the medial portion of the frontal cortex (Englot et al., 2010), especially in generalized seizures. The frontal slow-wave pattern (Fig. 3 and Supplementary Fig. 2) resembles the pattern that has been observed during slow-wave sleep (Dang-Vu et al., 2008), which suggests that the post-ictal behavioural change may have some similar neural substrates to slow-wave sleep. The anatomical distribution of the slow waves (Fig. 4, Supplementary Figs 3 and 4) partially overlaps with the regions that showed a decrease in cerebral blood flow during the partial activation, generalization and post-ictal periods in a similar cohort of patients with epilepsy (Blumenfeld et al., 2009). The slow-wave distribution also partially overlaps with the ‘default mode network’, a network known to show decreased activity in attention-demanding or goal-directed tasks (Raichle et al., 2001; Fox et al., 2005). The default mode network is known to be associated with abnormal activity or connectivity in many other mental disorders (Broyd et al., 2009). The consistency of results between multiple imaging modalities (EEG, intracranial EEG and SPECT) and the functional importance of these cortical regions suggests a possible connection between cortical slow waves and inhibited consciousness and responsiveness in epileptic seizures.
The slow waves during the ictal period, as suggested by previous intracranial EEG studies, carry important information in correlation with consciousness. The slow waves and haemodynamic signal changes during the ictal period can persist into post-ictal period in similar regions (Fisher and Schachter, 2000; Blumenfeld et al., 2004, 2009; Englot et al., 2010). It is possible that the spectral and spatial features found in post-ictal EEG could also reflect some of the features of ictal slow waves. We limited the current study of slow waves to the post-ictal period, because the scalp EEG measures signals of relatively low frequency. In temporal lobe seizures, the measured ictal activity is usually in the theta or delta band, which may also contribute to the spectral power we are interested in. We studied the post-ictal EEG here in order to avoid the inclusion of strong ictal rhythms. This represents a limitation of the current study. In order to study the instantaneous impact of seizures, the spectral and spatial features of ictal slow waves must be studied. The study of ictal slow waves will therefore be further pursued in future work.
Slow waves, spectral and spatial shifts
In the present study, we observed a trend of ‘global’ spectral shift () to low frequency in seizure types that affect responsiveness and consciousness (Fig. 2). The relative spectral delta power was highest for generalized seizures, the second highest for complex partial seizures, and the lowest for simple partial seizures. The relative spectral delta power for simple partial seizures did not differ as significantly from that of the baseline EEG as the other two seizure types. These results suggest that the brain might be brought into a ‘global’ ‘slower’ state in the post-ictal period for seizures associated with loss of consciousness. This spectral power shift to the lower frequency band resembles the wide synchronization of low-frequency oscillations in the anaesthetic brain (Hudetz and Imas, 2007; Alkire et al., 2008; Liu et al., 2011). The burst-and-suppression pattern observed in the post-ictal EEG of generalized seizures can also be found in deep anaesthesia (Hudetz, 2006; Alkire et al., 2008; Liu et al., 2011). Therefore some of the neural mechanisms of altered consciousness in seizures may be similar to those of anaesthesia. Previous studies of anaesthesia have postulated that during periods of unconsciousness, the brain was engaged in certain hyper-synchronous, but stereotypic patterns (Hudetz, 2006; Alkire et al., 2008; Liu et al., 2011). The brain can lose the information capacity (Alkire et al., 2008) to process cognitive functions.
In addition to the global spectral shift is a ‘regional’ difference between various regions as quantified by the relative spatial delta power. The relative spatial delta power increased prominently in frontal regions but decreased in the ipsilateral temporal region in seizure types that affect consciousness. The complex partial and secondarily generalized seizures may share similar spatial locations underlying the slow-wave activity. This similarity, despite the differences in consciousness between the seizure types, suggests that it may not be the spatial location, but rather the spectral and regional magnitude that distinguishes between complex partial and generalized seizures. Previous neuroimaging findings have suggested a similar phenomenon in which common anatomical structures were involved in the haemodynamic deactivation during seizures with partial activation, generalized activation (Blumenfeld et al., 2009) and absence seizures (Bai et al., 2010).
In the ipsilateral temporal region, the relative spatial delta power was reduced in complex partial seizures compared with simple partial seizures (Figs. 3A and 5). The post-ictal EEG of simple partial seizures may reflect a brain state similar to a baseline state, as the relative spectral delta power in simple partial seizures was not much greater than that of the resting state baseline (Fig. 3B). In such a close-to-baseline state, the epileptogenic zone (ipsilateral temporal lobe) may show strong inter-ictal activity, which could elevate the total EEG power and therefore the 1–4 Hz component of the total EEG power. This is a limitation of the index of the relative spatial delta power, as it can be affected by the increase or decrease of total EEG power. The occipital cluster (Fig. 3A; 10th cluster) also appeared most frequently in simple partial seizures. Because it had the highest relative spectral alpha power, it is likely to be associated with the occipital alpha rhythm, which is common in resting state. This also suggests that the post-ictal state of simple partial seizures more closely resembles the normal resting state than complex partial or generalized seizures.
Clinical implications
The differences in slow-wave activity found in simple partial, complex partial and secondarily generalized seizures may provide insights into a more quantitative evaluation of responsiveness and consciousness during and following seizures. The current practice of behavioural analysis relies significantly on the language and motor abilities of patients (Commission of International League Against Epilepsy, 1981). It can be difficult to clearly distinguish whether unresponsiveness is caused by dysfunctions of consciousness, language or motor processing (Lux et al., 2002). The spectral and spatial delta power change may provide quantitative information to aid behavioural testing in epilepsy treatment. This method can avoid language–motor-associated biases, as it is entirely data-driven. However, a systematic prospective study, including detailed behavioural testing, is needed in order to delineate different types of cognitive dysfunctions and their electrophysiological representations. Recent studies have used more complicated behavioural scores (Arthuis et al., 2009), which can distinguish the impairment of different functions. In addition to conducting more detailed behavioural testing, it will be important in future studies to acquire behaviour information over time to track the behavioural and associated electrophysiological changes throughout the ictal and post-ictal periods.
The difference in slow waves between the two hemispheres showed lateralization and localization values of post-ictal EEG. The ipsilateral hemisphere (e.g. ipsilateral temporal and frontal regions) displayed higher delta power than that of the contralateral hemisphere in the post-ictal EEG of partial seizures. Analysis of post-ictal slow-wave activity could therefore supplement other non-invasive localization tools for the pre-surgical evaluation of epilepsy treatment.
Technical considerations
The elevation of temporal lobe slow waves was observed in the present study. This is consistent with previous studies of temporal lobe post-ictal slow waves (Hufnagel et al., 1995; Jan et al., 2001). However, previous intracranial EEG studies measured less elevation of slow waves in the seizure onset zones compared with other regions (Englot et al., 2010). It is possible that the temporal lobe tissue around the seizure onset zones still generates synchronized slow waves. These signals can be recorded by scalp EEG because scalp sensors measure the summed activity from a large area of the brain. The signals may not be recorded by intracranial EEG implanted in the seizure onset zones, as intracranial EEG measures signals directly from the vicinity of the electrodes. It is also possible that there are relatively higher frequency components in the temporal lobe, such as inter-ictal events, superposed onto slow waves. This may explain why the ipsilateral temporal lobe component had the highest EEG power in simple partial seizures while the relative spectral delta power was not much larger than the resting baseline.
In the post-ictal EEG, the orbito-frontal activity, when projected onto the scalp sensors, is mixed with the electrooculography activity that is generated by eye blinks and movements. Independent component analysis may not be able to completely separate the two signals. In order to remove eye-blink artefacts in our analysis (Jung et al., 2000), we visually reviewed all of the independent component time courses. Components with brief and large amplitude peaks that were distinct from the background EEG were identified. They were then compared with the original EEG waveforms to determine whether the signal was consistent with the eye-blinks (brief, large monopolar potentials) observed in the EEG. Lastly, we examined the scalp maps of the selected components to see if the signal had a focus in the far frontal electrodes. We cannot exclude the possibility that some of the slow waves may have been rejected because they were superimposed in the components that represented the eye blink signals. Therefore, the orbito-frontal components in this study may be underestimated, and the delta power in this cortical region may be even higher than that derived in the study.
In conclusion, in the post-ictal EEG of temporal lobe seizures, the present study found (i) a global spectral power shift to low frequencies; and (ii) a spatial power shift to the frontal regions associated with increased severity of seizures (from simple partial to complex partial and secondarily generalized seizures). The spectral and spatial shifts of slow waves suggest a possible connection between behavioural states and electrophysiological changes. Epileptic seizures provide a pathological model (Lux et al., 2002; Blumenfeld et al., 2009; Englot et al., 2010) to study consciousness, responsiveness and other cognitive functions, in addition to other more frequently used models, such as slow-wave sleep (Hofle et al., 1997; Massimini et al., 2005) and anaesthesia (Hudetz and Imas, 2007; Alkire et al., 2008; Liu et al., 2011).
Funding
This work was supported in part by the National Institutes of Health under grants RO1 EB007920, RO1 EB006433 (B.H.) and RO1 NS063039 (G.W.), by the National Science Foundation under grant CBET-0933067 (B.H.), and by a grant from the Minnesota Partnership for Biotechnology and Medical Genomics.
Supplementary material
Supplementary material is available at Brain online.

