


Abstract
Communication skills are fundamental to social work, yet few studies have directly evaluated their impact. In this study, we explore the relationship between skills and outcomes in 127 families. An observation of practice was undertaken on the second or third meeting with a family. Practice quality was evaluated in relation to seven skills, which were grouped into three dimensions: relationship building, good authority and evocation of intrinsic motivation. Outcomes at approximately six months were parent-reported engagement (Working Alliance Inventory), Goal Attainment Scaling (GAS), an eleven-point family life satisfaction rating, the Family Environment Scale and General Health Questionnaire and service outcomes from agency records including children entering care. Relationship-building skills predicted parent-reported engagement, although good authority and evocation had stronger relationships with outcome measures. Where workers visited families more often, relationships between skills and outcomes were stronger, in part because workers had more involvement and in part because these families were more likely to have significant problems. The relationship between skills and outcomes was complicated, although the findings provide encouraging evidence that key social work skills have an influence on outcomes for families.
Introduction
It is generally accepted that how social workers talk to people is important. There are several social work textbooks devoted to communication and effective work with people, and all introductory guides to the profession have at least some focus on how to talk with those who use services (see Coulshed and Orme, 2006; Davies, 2007; Koprowska, 2014; Payne, 2015). Yet there is relatively little research that focuses directly on practice, and we were unable to identify any that explores the relationship between practice skills and outcomes. This is a gap the current study attempts to address.
In child and family social work, the importance of effective direct work has received increased attention in recent years. There has been widespread critique of attempts to reform services focused on policy and procedure, and many commentators have argued that social work should focus more on building effective helping relationships (Ferguson, 2011; Munro, 2011; Featherstone et al., 2014). In her key report for the English government, Munro emphasised the central importance of evidence-based and relationship-based practice for effective child and family social work: ‘Skills in forming relationships are fundamental to obtaining the information that helps social workers understand what problems a family has and to engaging the child and family and working with them to promote change’ (Munro, 2010, p. 88, emphasis in original).
Munro’s focus on direct practice has resonated with academics, practitioners and leaders involved with children’s services in the UK. Yet, while Munro cites a number of relevant studies in support of her belief, none of these looks directly at what happens when social workers meet parents or children. Indeed, there are few such studies.
An exception to this is Ferguson’s seminal body of work observing meetings between social workers and families (Ferguson, 2011, 2016a, 2016b, 2016c, 2016d). His studies point to the complex nature of this work, emphasising the physical context (including sounds and smells), the emotional content (including fear, revulsion and other powerful emotions) and the challenge of managing the multiple demands of the role (including relationship building and the appropriate use of authority). Ferguson’s work includes some key insights for thinking about child and family social work. In a description of three interviews in which he believed the child became ‘invisible’, he illuminates the powerful contextual and emotional processes that might lead to this happening (Ferguson, 2016a). Throughout his papers, the messiness of the job of social work shines through. A particular contribution that Ferguson makes is to identify and describe the concept of ‘good authority’: the appropriate, sensitive but firm use of power sanctioned through the state and used by the social worker within the relationship (Ferguson, 2011). This is a distinctly social work element of these encounters—crucially different from the often therapeutic conception of work that underlies many intervention methods described in social work textbooks.
A further example of empirical research about direct practice with families was provided by Ruch and colleagues, who recently completed a project on direct work with children (Winter et al., 2016; Ruch et al., 2017). This study—like Ferguson—identified the complexity of ‘direct work’ with children, both in the way in which space and time for it needs to be negotiated with families and, crucially, the composite reasons for such work. Sometimes quasi-therapeutic, at other times investigative, at times explanatory and perhaps most often solely to understand better a child and his or her circumstances, the reasons for such conversations are complex. Ruch et al.’s work provides vivid insight into this complexity.
Hall and colleagues have also directly observed practice. Their studies have involved fine-grained analysis of interactions using a broadly conversation analysis framework. Using this approach, they have explored concepts, including worker and parent resistance and the manner in which category descriptions (such as being a good mother) are used and created in conversation (Hall, 2003; Hall et al., 2006, 2013).
The work of Ferguson, Hall and Ruch, Winter, Cree and colleagues uses workers who volunteer to be observed and analyses practice qualitatively to provide rich descriptions and understandings. As such, the current research—using a different sampling and analytic strategy—provides complementary evidence to that from these studies. In particular, the current study uses quantitative analysis to examine the relationship between key social work skills and outcomes for families. It also has a more representative sample of observations, as there was an expectation that all families would be asked for permission for an observation—though of course the number of observations varied considerably between workers, suggesting there were some who were reluctant to be observed. Nonetheless, it is likely to be more representative than research solely with workers who actively choose to take part.
This is an important gap in our understanding of social work practice. Even if there is a broad consensus about key social work skills—and this is not certain—a consensus is not an evidence base. What is missing from our current knowledge base is an understanding of the relationship between key skills and meaningful outcomes. Knowing more about the nature of this relationship is likely to have important implications for how we develop social work education and deliver services. It may even influence the nature of the skills we think central to social work. It is therefore surprising, and perhaps concerning, that we currently have no empirical evidence linking skills and outcomes. It is this gap that the current study attempts to address. The research question is therefore: What is the relationship between key social work skills and outcomes for families in child and family work?
Background to the study
This paper reports on data collected as part of a randomised–controlled trial (RCT) that evaluated the impact of training and supervision in motivational interviewing (MI) on the skills of social workers, their engagement of parents and other key outcome measures. The RCT findings are reported elsewhere (see Forrester et al., 2018). In summary, the study found that the package of training and supervision increased the MI skills of workers by about half a point on a five-point scale. This was a statistically significant difference between the groups, though it did not seem to influence outcomes for families.
This study uses the whole sample to explore the relationship between worker skills and outcomes. One of the issues for the RCT was that we know little about the relationship between skills and outcomes; there was an assumption that increased skills would improve outcomes, but this may not be true, and we know nothing about the size of the relationship. The current paper attempts to answer such questions.
Method
Study design, procedure and randomisation
The study was carried out in a single London local authority (LA) in 2012–13. The LA had six Child in Need (CIN) teams, each covering a geographic area, with a total of forty-eight social workers. Teams also had various specialist workers (e.g. for the prison or hospital) who were not part of this study. In this LA, a referral team screened all referrals and those requiring input from a social worker were passed to the CIN teams for allocation.
Data were collected through an observed and recorded meeting between a social worker and the family and a research interview with parents shortly after this observation ((T1)—two to four weeks after allocation). Where possible, a follow-up research interview was carried out approximately twenty weeks later (T2). In addition, data were collected from computerised records on key family outcomes at the service level (such as whether children entered care and case closure). This was done at six months after the first research interview (T3), meaning that T3 was on average six weeks after T2.
Figure 1 sets out the flow for participation in the study. It combines data from the two conditions of the RCT (those trained and supervised in MI and those who were not). The sample varies from the RCT sample because (i) one family had data collected prior to randomisation and were excluded from the RCT and (ii) families in which the social worker changed by T2 are excluded from this analysis (as there is less reason to believe there would be a link between worker skill and outcomes).
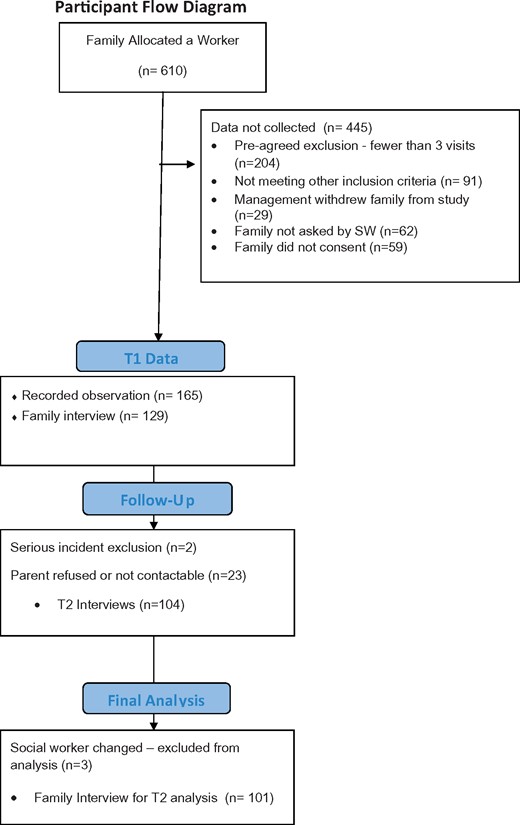
Participant flow diagram
The study sample consisted of all families who received three or more visits from an allocated worker (this was to exclude families with minimal contact). The expectation was that social workers ask parents whether they would take part in the study, and a high proportion of families were asked to take part (67 per cent). Of those asked, about two-thirds agreed to observation of a research interview. Families allocated to specialist workers (such as for the prison or hospital) were excluded. A small number of families were excluded because the manager had to over-rule randomisation (this happened when it was not possible to allocate into the chosen condition, usually because of worker absences). Additional attrition occurred for families who did not wish to undertake a research interview following observation, and for families who refused or could not be found for T2 interviews (see Figure 1 for a flow diagram). Table 1 summarises key demographic and service-level information about the sample.
Family data (n = 127)
| Variable | Total sample |
|---|---|
| Relationship of carer to child, n (%) | |
| Mother | 81 (85.3) |
| Father | 10 (10.5) |
| Grandmother | 2 (2.1) |
| Grandfather | 1 (1.1) |
| Step-grandmother | 1 (1.1) |
| Number of adults in home, M (SD) | 1.68 (0.91) |
| Number of children in home, M (SD) | 1.97 (1.05) |
| Previous involvement in child services, n (%) | 69 (55.6) |
| Number of weeks had social worker, M (SD) | 6.19 (6.16) |
| Number of times seen social worker, M (SD) | 3.34 (1.75) |
| Highest statutory basis of care at T1, n (%) | |
| CiN | 106 (84.8) |
| CP | 16 (12.8) |
| LAC | 3 (2.4) |
| Child in care, yes, n (%) | 5 (4.0) |
| Current statutory basis of care at T2, n (%) | |
| CiN | 56 (75.7) |
| CP | 15 (20.3) |
| LAC | 3 (4.1) |
SD, standard deviation.
Outcomes and measures
Observations of direct practice: key skills
Three types of data were collected from families. First, families consented for researchers to observe a home visit with a social worker. The observation of a home visit (T1) typically was the second or third visit with the social worker following case allocation. Families were also asked for permission to make an audio recording of the visit. For recorded interviews, seven dimensions of worker skill were coded for, and this was then simplified into a three-factor description of key skills.
Of the seven dimensions, four were drawn from concepts in MI and were measured using the Motivational Interviewing Treatment Integrity manual (version 3.1) (MITI; Moyers et al., 2010). These were:
Collaboration;
Autonomy (parental choice is recognised and increased);
Evocation (elicitation and enhancement of intrinsic motivation);
Empathy.
In addition, elements of social work practice that related more directly to other elements of the social work role, such as the fact that the child is the prime focus and there needs to be appropriate use of authority, were absent from the MI coding scheme. Following a developmental process including reviewing the literature, expert focus groups and piloting (see Whittaker et al., 2016 for more information), the subsequent additional dimensions of practice were developed:
Purposefulness;
Clarity about concerns;
Focus on child;
Each of the seven dimensions are coded on a five-point scale for the whole session, with 3 being the ‘anchor’ or starting point and practice being rated as more or less skilled than that. Descriptors are provided for each variable, with more detail provided in Whittaker et al. (2016). As well as reporting on the development of the measures, Whittaker et al. (2016) report a high degree of inter-rater reliability for coding these seven dimensions of practice skill, though it is important to note that achieving such reliability required extensive training and constant checking for consistency.
In a separate analysis using the current sample, we carried out a factor analysis that allowed a simpler presentation of the skills—particularly as many were positively correlated with one another. This is described fully in a forthcoming paper (Forrester et al., forthcoming). This identified a three-factor solution for describing the skills of social workers. The first factor was an average of empathy, collaboration and autonomy. This describes what we have called ‘relationship-building’ skills. The second factor combined purposefulness, focus on child and clarity about concerns. This seems to represent what Ferguson called ‘good authority’ and, with permission, we term it such. Finally, evocation is a separate variable. It is only possible to code for it when there is a discussion about parental behaviour change, as it is the only variable associated directly with supporting behaviour change in the parent. We therefore present the relationship to outcomes in relation to these three dimensions of skill:
Relationship building;
Good authority;
Evocation.
For ease of presentation, the scores for ‘relationship building’ and ‘good authority’ were divided by three to provide scores in the range from 1 to 5.
Family interview questionnaire
This questionnaire at T1 was completed shortly after the observation with the family, often immediately afterwards and usually within twenty-four hours. The T2 family interview questionnaire repeated most of the measures from T1.
Basic demographic information
Information was collected on household composition, age of family members and race/ethnicity.
Working Alliance Inventory
We chose the Working Alliance Inventory—Short Form (WAI-S; Horvath and Greenberg, 1989) as our primary measure for evaluating parental engagement due to ease of administration and widespread use in counselling-focused studies (Hanson et al., 2002). The WAI conceptualises engagement as having three components, namely ‘Bond’ (the quality of the relationship), ‘Goals’ (degree of agreement about the aims of the work) and ‘Tasks’ (extent to which the parent is carrying out tasks to achieve the goals) (Horvath and Greenberg, 1989). In this study, the primary measure is the WAI-S total score as completed by the parent.
Goal Attainment Scale (GAS)
The GAS has parents identify the most pressing issue for their family and specific and measureable ratings for change (+3 to –3) by T2. This approach allows a broad-based, reliable and valid identification of family-specific issues and goals by parents (Palisano et al., 1992; King et al., 2000).
General Health Questionnaire (GHQ)
The GHQ (Goldberg and Williams, 1988; Goldberg et al., 1997) is a measure of heightened risk of common psychiatric illnesses such as anxiety and depression and minor psychological distress. The shorter version of the GHQ contains twelve items, each with four response options (coded 0–3), with higher scores indicating increased levels of mental distress. Response options are semantically anchored as ‘Better than usual’, ‘Same as usual’, ‘Worse than usual’ and ‘Much worse than usual’ or some variation. The GHQ-12 has been validated in numerous populations and clinical settings. For the current study, a total score was calculated as well as a clinical threshold of 3/4 based on the GHQ-12 scoring (Goldberg et al., 1997).
Family Environment Scale (FES)
FES (Moos and Moos, 1994) is a multidimensional measure of familial social environments. The study used the family relationship set of subscales of twenty-seven items in three subscales. The Cohesion subscale measures the perceived level of commitment and support expressed by family members. Emotional openness and encouragement were measured by the Expressiveness subscale. Familial conflict and anger were measured by the Conflict subscale.
Life Rating Scale
Parents and care-givers were asked to rate their family life on an eleven-point Likert-style scale at T1 and T2. Ratings were on a scale of 0–10, with higher scores indicating ‘your family life is really good’ and 0 is ‘how you feel when life is at its worst’.
Statistical methods
First, we describe the descriptive statistics of practice dimensions, to answer how the workers were interacting with parents. Second, we explored relationships between variables, looking at simple bivariate correlations (Pearson’s r) and differences between groups on two variables (Mann-Whitney U tests). Analyses were completed using SPSS 24.0 (IBM, 2016).
Ethical review
The study was reviewed and approved by the Ethics Committee of the University of Bedfordshire, UK.
Results
Two sets of analyses were undertaken. First, the relationship between the key dimensions of skill and the outcome measures for the whole sample were analysed. It became apparent that a large proportion of families saw relatively little of their social worker. The average number of visits recorded on Integrated Children's System (ICS) by T3—even for this sample with three or more visits—was 6.2 and almost half (46 per cent) had five or fewer. It was decided also to analyse those who had had more visits. Families with eight or more visits were identified for this analysis; about a quarter of families were in this group (26 per cent), which was sufficient to allow statistical analysis.
Observed home visits for 127 families were coded for social work skill dimensions as outlined above. Family data are presented in Table 1 for these families. Most frequently, the mother of the child was the family member who met with the social worker during the visits (85.3 per cent). At the time of the observed home visit, the statutory basis for care was largely CIN (84.8 per cent). A minority of cases were child-protection (12.8 per cent) or looked after children cases (2.4 per cent). Most families had prior involvement with child services (55.6 per cent). Families reported being assigned a worker for 6.19 weeks (standard deviation (SD) = 6.16) and meeting with the worker an average of 3.34 times (SD = 1.75) prior to T1 (this includes the recorded session).
The overall pattern for the key outcome measures is presented for T2 and, where appropriate, T1 in Table 2. The analyses found that worker skills—and in particular relationship-building skills—were strongly associated with parental engagement both shortly after the interview and, more notably, twenty weeks later. Relationship-building skills did not have a statistically significant relationship with any other outcome measures.
Worker skills correlated with outcome measures
| n | All families | n | >8 visits | |||||
|---|---|---|---|---|---|---|---|---|
| Care and engagement | Good authority | Evocation | Care and engagement | Good authority | Evocation | |||
| WAI at T1 | 91 | 0.270** | 0.137*** | 0.172*** | 38 | 0.144 | 0.221*** | –0.057 |
| WAI at T2 | 70 | 0.253** | 0.213* | 0.191*** | 30 | 0.185 | 0.328* | –0.07 |
| Life Scaling—life rating at T2 | 74 | 0.150*** | 0.197* | 0.216*** | 26 | 0.334* | 0.338* | 0.421* |
| Life Scaling change (T2–T1) | 74 | 0.079 | 0.274** | 0.140 | 32 | 0.113 | 0.322* | 0.142 |
| Goal Attainment Scale | 73 | 0.056 | 0.134 | 0.209 | 31 | 0.160 | 0.014 | 0.399*** |
| FES—Cohesive at T2 | 73 | –0.011 | –0.002 | –0.026 | 32 | 0.075 | –0.239 | 0.203 |
| FES—Expressiveness at T2 | 39 | 0.094 | 0.116 | 0.114 | 14 | 0.061 | –0.207 | 0.196 |
| FES—Conflict at T2 | 39 | 0.055 | 0.100 | 0.135 | 14 | –0.090 | 0.207 | –0.047 |
| FES—Cohesive change (T2–T1) | 39 | 0.109 | 0.308* | 0.206 | 14 | 0.265 | 0.184 | 0.301 |
| FES—Expressiveness change (T2–T1) | 30 | 0.142 | 0.413** | 0.075 | 11 | 0.277 | 0.263 | 0.383 |
| FES—Conflict change (T2–T1) | 31 | –0.137 | –0.191 | –0.225 | 13 | –0.273 | –0.174 | –0.245 |
| GHQ-12 Total score | 34 | –0.004 | –0.036 | –0.046 | 14 | –0.078 | 0.029 | –0.098 |
| GHQ-12 change in average (T2–T1) | 73 | 0.027 | –0.040 | 0.007 | 31 | –0.005 | –0.033 | 0.026 |
| Referral during case, M (SD) | 56 | U = 163.00 | U = 143.00 | U = 165.00 | U = 2.00 | U = 0.50 | U = 1.50 | |
| No, no re-referral made | 47 (83.9%) | 2.60 (0.86) | 2.84 (0.66) | 2.50 (1.09) | 4 (80%) | 2.58 (1.00) | 9.25 (0.50) | 2.50 (1.29) |
| Yes, re-referral made | 9 (16.1%) | 2.92 (0.46) | 3.15 (0.29) | 2.56 (0.88) | 1 (20%) | 2.67 (0.98) | 3.33 (1.01) | 2.00 (1.08) |
| Child placed in care, M (SD) | 125 | U = 248.00 | U = 234.00 | U = 175.50 | U = 13.50* | U = 27.00*** | U = 11.50 | |
| No, child not placed in care | 120 (96.0%) | 2.71 (0.82) | 2.93 (0.63) | 2.56 (1.01) | 42 (93.3%) | 2.76 (0.79) | 3.10 (0.53) | 2.62 (0.92) |
| Yes, child not placed in care | 5 (4.0%) | 2.4 (1.09) | 2.67 (0.62) | 2.75 (1.50) | 3 (6.7%) | 1.67 (0.58) | 2.44 (0.69) | 1.50 (0.71) |
*p < 0.05; **p < 0.01; ***p < 0.10. SD, standard deviation.
Good authority had a more complex relationship with outcomes in the whole sample. It was weakly associated with engagement (WAI) at T1, although this strengthened at twenty weeks and was statistically significant. Good authority was associated with parents reporting better family life (the Life Scale measure) and particularly with positive change in family life. Positive change in family life is influenced by the lowness of the initial score (as large changes are not possible where there are not identified problems) as well as the impact of the skill. The particularly strong association with change is therefore related both to positive family outcomes and a tendency to have lower initial ratings of family life where there is more use of good authority. Good authority also had some strong associations with improved family functioning using the FES, and in particular increased family expressiveness and cohesion. The reduction in conflict did not achieve statistical significance, but is nonetheless a noteworthy relationship; not all families had conflict and this indicates a powerful impact of good authority where conflict was identified at T1. These instruments along with life rating findings suggest that good authority has a positive impact on family life twenty weeks later.
Only 80 per cent of observed interviews involved a discussion about behaviour change and therefore the sample for evocation scores is lower than for other dimensions of practice. There were trends (p < 0.1) towards an association with better engagement and improved life rating for the whole sample.
The relationships between skills and outcomes in the families who had received eight or more visits present an interesting picture. First, it is noteworthy that, in this sub-sample, good authority was a better predictor of parental engagement at both T1 and T2 than relationship-building skills. Relationship building had weak positive relationships with engagement, goal-attainment scores and change in FES (with a very small sample of families). Interestingly, there was a statistically significant relationship with children entering care, with lower levels of relationship-building skill predicting children entering care. However, this relates to a very small sample of three families whose children entered care and it may be explicable in other ways (as discussed below).
In contrast, ‘good authority’ seemed to have stronger relationships with outcomes than relationship building. It had quite strong and statistically significant relationships with engagement and family Life Scale rating and change. There was also a trend—though not significant—for lower good authority in families in which children entered care.
There are particularly interesting findings in relation to evocation. This had a strong relationship with life rating at T2. There was also a strong relationship to goal attainment. This did not achieve statistical significance, but is a finding worth further discussion.
The number of families who completed the FES for the 8+ sub-sample is too small for meaningful statistical analysis. It is, however, worth noting some relationships in the data that are worth exploring in future research. First, relationship building, good authority and evocation all have relationships with the sub-dimensions of change in FES that might be expected if one hypothesises that social work skills reduce problems and increase positive functioning. For evocation, these are particularly strong relationships. However, for the FES scores at T2, relationship building has no relationship, evocation has indications of positive relationships but good authority appears associated with negative outcomes (lower cohesiveness and expressiveness and higher conflict). This relationship is in fact because good authority was negatively correlated with each of the FES dimensions at T1. In other words, families who were less cohesive and expressive and reported higher levels of conflict tended to lead to social workers using higher levels of good authority. This is an interesting finding in itself. It also suggests that the key issue is change in FES score, and here there were indications of positive change, though the sample was too small for statistical confidence.
It is possible that the workers who were trained in MI may have attempted to demonstrate MI skill in the observed interviews to a higher degree than in non-observed practice. We analysed this by comparing the strength of the relationships between skills and outcomes in the MI and non-MI groups. If there was a performance effect, a weaker relationship might be expected. There was, in fact, no difference between groups.
Strengths and limitations
The fact that half the sample had been trained in MI means that this sample is not typical of social work practice. However, this may not be a limitation for this analysis; in effect, this creates a wider range of practice skill that increases our ability to analyse relationships between the skills measured and outcomes for families. Nonetheless, it would be important to explore the relationship between skills and outcomes with families where workers had received no training.
A key limitation, however, is that the coding for skills is strongly influenced by MI. This is most obviously true for those skills assessed using the MITI—which are key elements of MI—although even the formulation of the good-authority dimension was influenced by the collaborative and person-centred nature of MI. Different theoretical approaches would be able to develop alternative frameworks for assessing the quality of practice. We are also acutely aware that there were many important elements of practice not captured under the current rubric, such as genuineness or humour. There is also much more to social work skill than direct work. Good social work also involves liaison with other agencies, as well as skills in assessment and decision making. These are beyond the scope of this study. This paper simply presents a first attempt to assess the relationship between some dimensions of good practice and outcomes. We hope that it acts as a catalyst for further studies exploring alternative elements of practice, as well as research analysing the relationships we identified in different contexts.
A second limitation is that we only evaluated specific outcomes, and these were predominantly focused on family-level issues as reported by the parents. We are particularly aware that, in the current study, we have not obtained direct evidence of outcomes for children. This study focuses on what might be considered to be more proximal links in a causal chain—whether skills influence family-level outcomes. We hope to be able to explore links to child safety and well-being in future studies.
The study is also correlational. This can create challenges in establishing causal relationships. For instance, in families where children entered care, lower levels of skills were found. This may be because more skilled practice reduces the need for children to enter care. However, it is equally possible that, in families with higher levels of difficulty, workers tend to be less collaborative and more authoritarian.
A specific challenge was identified in relation to the GAS as a measure of outcome. A significant number of parents identified goals that were perhaps not ‘realistic’, such as a move to a new property or complete cessation of a complex problem. Still more did not believe they had a problem or that anything needed to change; for many of these families, this seemed a reasonable position. Our point here is a methodological one; it makes identifying change using GAS difficult and, thus, using GAS may underestimate the level of change in the sample.
An important limitation is the impact of observer effects. In particular, the social workers were aware they were being observed and recorded. We cannot know what the impact of observation might be on practice. There are many descriptions of impacts from qualitative research (Ferguson, 2011; Ruch et al., 2017), but it is not clear what the impact might be on the type of analysis described here.
A final limitation is that the data were collected in one London LA. The degree to which relationships hold in other settings is a matter for further empirical investigation.
While these are all important limitations, the study has several strengths. It is, to our knowledge, the first study to explore empirical relationships between worker skills and outcomes in the international literature. It benefits from a relatively large data-set of directly observed meetings between workers and families. Furthermore, the study is a non-convenience sample. Most research directly observing practice has involved social workers volunteering to be observed. In this study, the LA agreed that all families should be offered the decision about whether to be observed or not. While, in practice, some social workers had low levels of participation, we nonetheless obtained observations for fifty-eight of the sixty social workers who were in the study at T1 (97 per cent) and more than half of all families allocated a social worker. Furthermore, often the field of child protection has comparatively low participation rates in research, and therefore having follow-up information for almost half of all families is, on balance, a strength of the study.
Discussion
The study identified complex and interesting relationships between worker skills and outcomes for families. However, it is first worth discussing the expected relationship strength between worker skills and the outcomes explored in this study. It might be predicted that there would be a relationship between worker skills and parental engagement, measured using the WAI, because one can see a relatively straightforward conceptual link; this was what the study found. This is in itself important because, in counselling research, the WAI has a consistent, though weak, relationship (effect size of 0.1–0.2) with outcomes (Horvath and Greenberg, 1989). Yet, there are grounds for expecting weaker relationships between skills and outcomes or even engagement twenty weeks later. First, an outcome twenty weeks later will be influenced by many other factors. Life happens: relationships change, accidents happen, people have numerous conversations—all of which takes place in the context of broader structural factors such as class, race and gender that influence outcomes. As a result, one might expect comparatively weak relationships between social work skills in direct practice and outcomes.
Second, the coded observation of practice sampled one interview. It is open to question how representative this is of the practice of the social worker (one would need to record all such meetings). From a statistical perspective, there will be variation between this instance of practice and the average level of practice experienced by the family. Again, this makes identifying relationships difficult, because this is not a perfect measure of overall practice skill. This consideration therefore weakens the strength of relationships one might expect.
Third, a key issue is that many parents did not feel they had serious problems or that they needed a social worker, as noted in relation to the GAS above. We return to this issue below, but the point here is that effect sizes for therapeutic interventions are usually calculated by estimating the impact of a service for people who have identified a particular problem. One would expect a lower relationship where a proportion of people dispute the presence of the problem.
In this context, using simplistic words to describe correlations of 0.1, 0.3 or 0.5 is misleading; these words are often used to describe correlations between variables measured at the same time point. Instead, it is perhaps more helpful to be clear what is meant by each of these levels of correlation. One way of doing this is to consider r-squared, which explains what proportion of the outcome measure is explained by the independent variable (in this instance, the practice skill). This indicates that, of the outcomes, weak relationships (0.1–0.19) explain 1–4 per cent of results, medium relationships (0.2–0.39) account for 4–16 per cent and strong relationships (0.4–0.6) account for 16–36 per cent. It is worth noting, also, that this ‘effect’ is unlikely to be evenly distributed. It summarises the effect across the whole sample, but will include many families where worker skill had little or no impact and some where it had large effects to produce the overall average.
Our initial analysis of all families found relatively small relationships between skills and outcomes. It was only when focusing on those families who received eight or more visits that more substantial relationships emerged. There are two possible explanations for this. One is a ‘dose effect’ relationship, where skills only make a difference if workers have sufficient contact with a family to be meaningful. This certainly seems credible. However, a second factor seems at least as important. Families who receive eight or more visits tend to have more substantial problems. There is therefore more possibility of skilled social work making a genuine difference.
Our impression was that a large proportion of the families worked with were allocated because of genuine concerns but that, on investigation, social workers and other agencies became less concerned or the presenting problems were resolved fairly quickly. There were therefore many examples of families in which a referral for domestic abuse was followed up but closed when no further concerns were identified following a few home visits, or a referral of a child being hit or neglected was explained and an improvement in family functioning seemed to follow. In this context, the role of the social worker is not akin to a therapist (where skills might be related to outcomes in a comparatively straightforward manner), but is more like that of a general practitioner (GP). A key part of the GP’s role is to deal with a large number of issues, and to differentiate those issues that are more serious from those which are minor and can be dealt with swiftly. In a similar way, a social worker’s first task is often to sort out from the large number of referrals those where the problems are serious enough to require significant input. Our finding about the link between skills and outcomes for families with eight or more visits suggests that it is with this latter group that more significant relationships are found between skills and outcomes.
Identifying the relationship between skills and outcomes seems important, as one of our core roles as social workers is to help people. Yet it is worth noting the importance of skills is not solely related to their ability to promote certain outcomes. The quality of the service is just as important. Any of us who were involved with children’s services would have a right to a social worker who was respectful, clear, purposeful and authoritative, regardless of whether that influenced ‘outcomes’.
That said, the identified relationships between skills and outcomes present a fascinating picture. First, there was a relatively strong relationship between ‘relationship-building’ skills and the self-reported engagement of parents. This relationship might be expected, but finding empirical evidence for it is nonetheless important. Interestingly, for families who had more than eight visits, engagement skills seemed less important than ‘good-authority’ skills, particularly at the point of follow-up. This finding is important, as engagement has long been understood to be a core element of effective child-protection work. However, our findings suggest that engagement itself has little direct relationship to outcomes. Certainly, worker skill seems more important in influencing outcomes at T2 than parental measures of engagement at T1, at least for this sample and these outcome measures.
The primary outcome measures for this study were Life Rating Scale and GAS. For life rating, both engagement and authority skills had positive relationships with rating of family life at follow-up. Surprisingly, GAS was not strongly influenced by these elements of worker skills, either for the whole sample or for those receiving more visits. In both samples, a correlation of around 0.1 was typical, indicating a weak relationship between worker skills and families achieving their goals in work. In contrast, the skill that had the strongest relationship to parents’ achieving their goals and to the rating of family life was ‘evocation’. Evocation is perhaps the core element of MI, and is the degree to which the worker elicits from the parent their own motivations for change rather than telling them what to do. This study suggests that evocation may be a key skill that influences outcomes for parents where there are behaviour-change discussions.
A further point to make is about the implications of the findings for other research. This analysis is of data gathered in an RCT focused on MI (Forrester et al., 2018). That study found an intensive skills development package had a statistically significant impact on skills, but there were no between-group differences in outcomes. The findings from this study in part explain that finding, because worker skill only has a comparatively small impact on family outcomes. There are important implications of this for research because it suggests that studies examining the impact of better social work practice are likely to need relatively large samples to identify the difference good practice makes. It is possible that under-powered studies may lead to ‘false negatives’ in which the impact of good practice is not identified because the sample is insufficiently large.
Conclusion
It is encouraging for social work that we found some significant relationships between key skills and family-level outcomes. Yet, it is important to strike a note of caution. We were surprised by the strength of the relationship between worker skills and outcomes—at least for families with eight or more visits. It is worth reiterating that there are many factors that might influence the relationships between skills and outcomes in social work. Given this level of complexity, we urge caution in drawing conclusions from these findings. More research is needed before we can begin to be confident about the key skills in social work that make a difference. Yet, the exciting element of this study is that it establishes that such an endeavour is possible. This allows us to consider the nature of good practice and test empirically whether our well-established theories about practice are borne out by the evidence.
The current study provides some support for the importance of relationship-building skills in engaging families. However, it suggests that perhaps good authority is more important than relationship building in producing positive outcomes for families (Ferguson, 2011, 2016d). This is an important finding in part because the ‘good-authority’ skills were developed separately from the MI elements of the coding system. While inspired by principles of respectful collaboration and self-determination that both MI and social work as a profession share, they were developed specifically for and from the context of child protection. Finding that these elements of social work seemed important is a first step towards articulating a distinctively social work conceptualisation of skill in child and family work.
An unexpected finding was that evocation was relatively strongly related to positive outcomes. This provides support for the potential contribution that MI may be able to make to child and family social work (see Hohman, 2011; Forrester et al., 2012). This study explored evocation, but it would be interesting to analyse other hypotheses about how social workers can help people change. Currently, the dimensions of relationship building and good authority appear to be relatively well developed and it would be interesting and perhaps important to develop work around what works in behaviour change.
Yet, it is not the differences between good authority, relationship building and evocation that are the most important elements of this study, for these dimensions of practice are not in opposition. Indeed, in analysing this sample, we identified a positive correlation between all skills, suggesting that workers who were good at engagement were also good at authority and evocation, and conversely those who demonstrated little good authority tended to be poor at relationship-building skills and did little evocation. The key feature is therefore not authority versus care, but skilled compared to less skilled workers. The most important finding of the study is that skilled social work can make a positive difference to the lives of families.
Acknowledgements
We would like to thank the many parents, children and social workers who allowed us to observe their meetings.
Funding
This research was funded by the Social Care Trust through the bequest of Tilda Goldberg.
Conflict of interest statement
None declared.
References
Forrester, D., Killian, M., Westlake, D. and Sheehan, L. (
