


Abstract
The objective of our study was to develop a nomogram to predict post-transjugular intrahepatic portosystemic shunt (TIPS) survival in patients with cirrhosis based on CT images.
This retrospective cohort study included patients who had received TIPS operation at the Wenzhou Medical University First Affiliated Hospital between November 2013 and April 2017. To predict prognosis, a nomogram and Web-based probability were developed to assess the overall survival (OS) rates at 1, 3, and 5 years based on multivariate analyses. With deep learning algorithm, the automated measurement of liver and spleen volumes can be realized. We assessed the predictive accuracy and discriminative ability of the nomogram using the concordance index (C-index), receiver operating characteristic (ROC) curve, calibration curve, and decision curve analysis (DCA).
Age, total bilirubin, and spleen volume-to-platelet ratio (SVPR) were identified as the independent risk factors for OS. The nomogram was constructed based on the above risk factors. The C-index (0.80, 0.74, 0.70), ROC curve (area under curve: 0.828, 0.761, 0.729), calibration curve, and DCA showed that nomogram good at predictive value, stability, and clinical benefit in the prediction of 1-, 3-, 5-year OS in patients with TIPS creation.
We constructed a nomogram for predicting prognosis in patients with TIPS creation based on risk factors. The nomogram can help clinicians in identifying patients with poor prognosis, eventually facilitating earlier treatment and selecting suitable patients before TIPS.
This study developed the first nomogram based on SVPR to predict the prognosis of patients treated with TIPS. The nomogram could help clinician in non-invasive decision-making.
Introduction
With technical improvements of transjugular intrahepatic portosystemic shunt (TIPS) implantation in the last 30 years, the shunt-related and procedural complications rate is decreasing nowadays.1 However, TIPS implantation is often performed in patients with advanced chronic liver disease stages or who have previously experienced serious liver decompensation.2,3 Therefore, identifying poor prognosis patients plays a role in clinical practice, and a method to predict prognosis in patients with TIPS creation is urgently needed.
Patients who received TIPS implantation often have serious hepatic dysfunction, and the established shunt changes blood flow within the liver and may further influences liver function. Previous studies have indicated that the mortality of post-TIPS in-hospital patients is approximately 2%-16%, and the mortality at 3 months is up to about 8%-27%.1,4 Currently, several non-invasive approaches have been proposed to assess the prognosis of patients treated with TIPS, such as the model for end-stage liver disease (MELD) score and the Child-Pugh score.5
The prognosis after TIPS implantation is associated with multiple risk factors.3,6,7 Spleen morphology and platelet count have been used to predict the prognosis of liver cirrhosis for decades, respectively.8–10 Previous studies also have indicated that the spleen volume-to-platelet ratio (SVPR) can be associated with chronic liver disease prognosis and complications.11,12 However, the relationship between SVPR and prognosis in patients receiving TIPS implantation has not yet been fully elucidated.
The nomogram is regarded as a prognostic device for constructing an intuitive statistical predictive model to offer superior individual disease risk estimation and guidance for optimal treatment decisions.13 Each variable incorporated in the nomogram is assigned a value based on its prognostic significance. The purpose of this study was to develop a nomogram to assess each patient’s probability of survival. Moreover, we attempted to compare the discriminative ability between the nomogram and traditional score models.
Methods
Study population
Patients who received the TIPS procedures between November 2013 and April 2017 at Wenzhou Medical University First Affiliated Hospital were included in this study. The inclusion criteria were: diagnosis of liver cirrhosis relied on pathology, imaging findings, and medical history. Causes for exclusion were as follows: (1) with malignant tumour; (2) interval between pre-TIPS CT screening and TIPS procedure above 3 months. (3) received splenectomy; (4) loss to follow-up; (5) without available non-contrast CT image. A total of 198 patients were included in this project, and 98 patients were eligible for inclusion (Figure 1). This retrospective study was approved by the institutional review board and conformed to the Declaration of Helsinki. The requirements for signed informed consent were waived due to its retrospective nature.
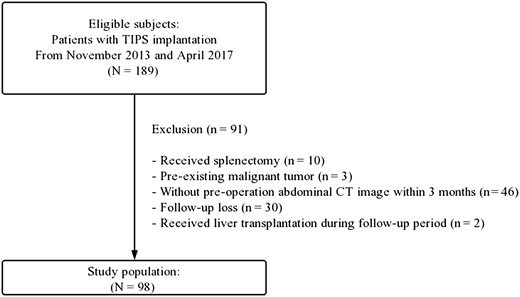
The patients inclusion flowchart.
Data collection
We collected detailed patients’ medical tracks and data. The records included patient demographics, common laboratory tests within 24 h after hospital admission, MELD, CTP scores, and patient evaluation for the absence or presence of HE (mild, moderate, and severe according to the West Haven classification system14), and degree of ascites.
Patient follow-up was conducted by phone calls, in-hospital records, and outpatient records after TIPS implantation. Stenosis and stent occlusion were treated when portal hypertension complications reoccurred or when shunts dysfunctioned, as demonstrated by Doppler ultrasound.15 Balloon catheters or new stents were applied to revise TIPS if necessary. Follow-up time was defined as the interval between the day of the TIPS procedure date and the day of the endpoint. The endpoint was defined as either follow-up time after TIPS operation or death. The conventional scoring models were calculated and relevant formulas are listed as follows:
MELD score = 3.78×ln(TBil mg/dL)+11.2×ln(INR)+9.57×ln(creatinine mg/dL)+6.4.16
The CTP score was calculated through five parameters including total bilirubin, albumin, prothrombin time, ascites status, and degree of hepatic encephalopathy.17
CT examination
All CT scans were performed using 8-64-section multidetector-row scanners (GE Healthcare). Axial CT images were reconstructed with a layer thickness of 5 mm with no gaps.
Automated deep learning algorithm for liver and spleen volume measurement
The detailed description of automated deep learning algorithm for organ segmentation can be found in a previous technical publication.18 In brief, 3D U-net and CycleGan were applied for organ segmentation.19 With limited graphics processing unit memory, an initial strided convolution (step size 2) and a complementing final transposed convolution were used to enable large 3D volumes in the process. Training data were downloaded from the Medical Segmentation Decathlon project.20 After the CT data were loaded, the programme would automatically perform organ segmentation and calculate the total volume of the liver and spleen by adding together consecutive areas of the liver and spleen, then multiplying them by the slice thickness (Figure 2). The SVPR ratio was generated as spleen volume divided by platelet count. When the organ volume calculation was completed, two of researchers, who were blind to patient prognosis, reviewed the deep learning-generated image segmentation analysis and corrected segmentation mistakes.

The illustration of liver and spleen volume measurements. An axial CT image and overlaid liver (green) and spleen (blue) masks created by deep learning algorithm. The spleen volume was 360.61 cm3, the liver volume was 603.40 cm3, and the platelet count was 90 × 109/L, resulting in the spleen volume-to-platelet ratio of 4.00.
Statistical analysis
Continuous data were presented as the mean ± standard deviation (SD) or medians and interquartile range, and were compared using the independent t-test or Wilcoxon rank-sum test depending on variables normality. Categorical data were expressed as frequency (percentages) and compared by chi-square or Fisher exact test. Independent variables that were likely associated with all-cause death were included in analyses. To avoid significant confounders missing, Cox regression, using backward stepwise regression, was used to calculate hazard ratios. Then, a nomogram, based on the results of multivariate analyses with the rms package of R, was constructed to predict the probability of all-cause death after TIPS implantation. The calibration curve was plotted to evaluate the concordance of the nomogram. The receiver operating characteristic (ROC) curve was constructed and the optimal cutoff value was determined by the maximum Youden index. Additionally, decision curve analysis (DCA) was utilized to evaluate the clinical usefulness and net benefits of the nomogram. A double-sided P-value <.05 was considered to indicate statistical significance in all analyses. Statistical analysis was performed via SPSS 25 (SPSSInc, Chicago, IL, USA), Medcalc (19.4.0; Ostend, Belgium), and R (version 4.0.3; R Foundation).
Results
Demographic and clinical characteristics
A total of 98 cirrhotic patients who received TIPS implantation were enrolled in this study. The clinical characteristics and baseline laboratory are displayed in Table 1. The mean age ± SD of the study population was 54.13 ± 10.76, including 66 men and 32 women, and the aetiology was mostly hepatitis B virus-related cirrhosis (56.1%). The median follow-up time of the entire cohort was 36 months (range, 1-36 months), with 1-, 3-, and 5-year OS rates being 87.6%, 74.5%, and 55.1% respectively. The median spleen volume ± SD was 244.72 (168.73-342.64) cm3 and the mean of SVPR ± SD was 3.96 (2.11-7.16).
Baseline characteristics of patients.
| Variables | All patients(n = 98) |
|---|---|
| Demographic characteristics | |
| Age, years | 54.13 ± 10.76 |
| Sex, male | 66(67.3) |
| Diabetes | 28(28.6) |
| Hypertension | 14(14.3) |
| Smoking | 33(33.7) |
| Aetiology | |
| Alcoholic | 22(22.4) |
| Viral (HBV or HCV) | 55(56.1) |
| Both alcohol and viral | 10(10.2) |
| Others | 11(11.2) |
| Laboratory parameters | |
| Total bilirubin, μmol/L | 22.02 ± 16.86 |
| Albumin, g/L | 33.95 ± 6.32 |
| Creatinine μmol/L | 68.55 ± 18.15 |
| PT, s | 17.59 ± 2.21 |
| INR | 1.45 ± 0.22 |
| Haemoglobin, g/L | 88.14 ± 20.25 |
| Platelet count | 72.70 ± 43.36 |
| Imaging parameters | |
| Liver volume | 329.12(277.93-388.76) |
| Spleen volume | 244.72(168.73-342.64) |
| TIPS procedures | |
| Stent diameter | 8(8) |
| Targeted puncture of left branch | 50(51.0) |
| Clinical scores | |
| MELD | 11.54 ± 2.38 |
| MELD-Na | 12.38 ± 3.18 |
| Child-Pugh | 7(6-8) |
Data presented as mean ± SD (median and inter-quartile range) or number of patients (%) where appropriate.
Abbreviations: TIPS = transjugular intrahepatic portosystemic shunt, HBV = hepatitis B virus, HCV = hepatitis C virus, PT = prothrombin time, INR = international normalized ratio, MELD = model for end-stage liver disease.
Prognostic factors of overall survival
As displayed in Table 2, seven variables that may have prognostic value for OS were enrolled in the univariate Cox regression, which included age, sex, albumin, total bilirubin, creatinine, SVPR, and targeted puncture of the left branch. Then, these significant variables were analysed by multivariate Cox regression (backward methods). And results showed that age, total bilirubin, and SVPR were considered independent prognostic predictors for OS.
Univariate and multivariate Cox proportional hazards model of the association between clinical parameters and hepatic encephalopathy occurrence rate (in a year).
| Univariate analysis | Multivariate analysis | |||||
|---|---|---|---|---|---|---|
| Variables | Hazard ratio | 95%CI | P-value | Hazard ratio | 95%CI | P-value |
| Age | 1.06 | 1.03-1.10 | <.01 | 1.05 | 1.01-1.09 | <.01 |
| Sex | 0.72 | 0.39-1.34 | .30 | |||
| Albumin | 0.93 | 0.87-0.98 | .01 | 0.97 | 0.90-1.03 | .29 |
| Total bilirubin | 1.02 | 1.01-1.04 | .01 | 1.02 | 1.00-1.04 | .04 |
| Creatinine | 0.98 | 0.96-1.00 | .07 | |||
| Spleen volume to platelet ratio | 0.98 | 0.96-0.99 | .02 | 0.98 | 0.97-0.99 | .04 |
| Targeted puncture of left branch | 1.28 | 0.71-2.32 | .41 | |||
Variables were significant in the univariate analysis were included in the multivariate analysis.
Abbreviation: TIPS = transjugular intrahepatic portosystemic shunt.
Hazard ratios and P-values were estimated using Cox proportional hazard model.
Constructions of nomograms
Based on the above independent risk factors for OS by the multivariate Cox regression analysis, we developed a visualized model for predicting the OS of patients with TIPS at 1, 3, and 5 years. To predict the OS probability, the total score was obtained by adding up the score of each predictor (Figure 3).
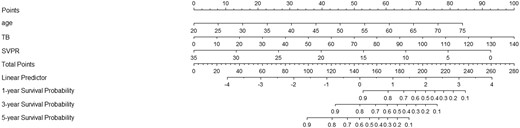
Nomograms to predict 1-, 3-, and 5-year overall survival for patients with TIPS creation.
Evaluation of nomograms
The ROC curves and C-index were used to evaluate the discrimination power of the nomogram. The bootstrap resample method (n = 1000) was used to reduce overfit bias in this nomogram model for internal validation. The C-indexes for predicting overall survival (OS) of 1, 3, and 5 years in patients with TIPS procedures were 0.80, 0.74, and 0.70, respectively. Moreover, there was no significant difference in the area under the ROC curve (AUROC) between the nomogram (0.828, 95% CI, 0.739-0.879) and MELD score (0.686, 95% CI, 0.584-0.776; P = .05) in 1-year OS. However, for 3- and 5-year prognosis, the AUROC of nomogram (0.761, 0.729) performed significantly better than the MELD score (0.621, 0.581; P < .05). The AUROC of nomogram (0.828, 0.761) showed a significant difference in 1- and 3-year prognosis prediction when compared with CTP (0.667, 0.632; P < .05), but showed no significantly higher value in 5-year prognosis prediction of CTP score (0.657; p = 0.277) (Figure 4). As shown in Figure 5, the calibration curve was used to demonstrate the calibration ability of the model, which showed a satisfying fit between the prediction and observation. In DCA curves, the ordinate represented the net benefit, and the abscissa is the threshold probability. The “None” indicated no intervention was performed, the “All” indicated all interventions, and the “Nomogram” referred to the intervention under a range of threshold probability. As displayed in Figure 6, the DCA curves showed a good net clinical benefit across the range of reasonable thresholds.
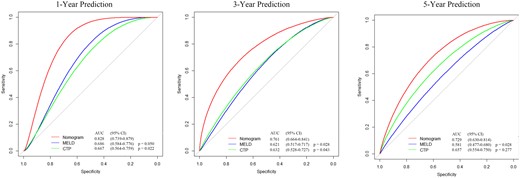
Comparison of the predictive accuracy of overall survival between SVPR nomogram and traditional score models.
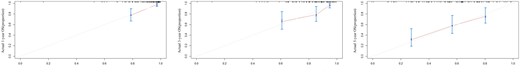
Calibration curves at 1, 3, and 5 years for validating the overall survival prediction nomogram (A-C).
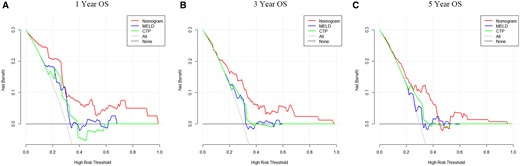
Comparison of decision curve analysis at 1, 3, and 5 years for the overall survival prediction between nomogram and conventional models (A-C).
Web-based probability calculator
We constructed a dynamic Web-based probability calculator to predict OS using the above results (https://deeplearningspleentoplatelet5-year.shinyapps.io/DynNomapp/). This dynamic calculator provided a handy way for clinicians to predict the individual OS at 1, 3, and 5 years based on patients’ clinical characteristics (Figure 7).
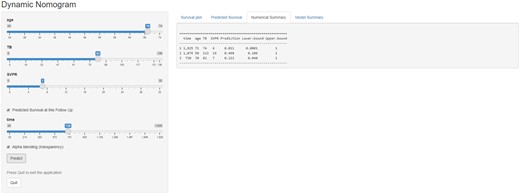
Web-based probability calculators. The different situation overall survival rate probability was calculated.
Discussion
In the last 30 years clinical practice, TIPS implantation has been proven to be an effective treatment of portal hypertension and cirrhosis complications, such as ascites and oesophageal gastric varices.1,21 With the improvement of procedure techniques, complication rates are also decreasing nowadays.1,22 However, in consideration of high mortality rates after TIPS implantation, it is still essential to construct a comprehensive algorithm to select optimal patients before TIPS procedure.
In this study, we built a novel nomogram to predict prognosis in cirrhosis patients with TIPS implantation. This proposed the nomogram was developed by clinical laboratory parameters and spleen volume that were automatically measured using deep learning-based imaging segmentation. The area under the curve demonstrated that nomogram based on SVPR performed well in predicting patients’ OS rate, especially in 1-year OS rate prediction. This nomogram may contribute to clinicians identifying patients at high risk of death and evaluating patients’ status before TIPS operation. To the best of our knowledge, the present study was the first to construct a nomogram based on SVPR for OS risk estimation in patients with TIPS implantation. The merit of our approach was a completely automated tool to measure spleen volume by the deep learning algorithm. It was a convenient and accurate method that made spleen volume measurement available.
Univariate and multivariate Cox regression analyses identified that age, total bilirubin, and SVPR could be considered as significant risk factors for post-TIPS OS. Previous studies indicated that older age was associated with worse outcomes.23,24 Higher levels of bilirubin generally suggested a poorer prognosis for the patient.25,26 And recent study proved that for patients with rapidly increasing total bilirubin after TIPS operation, bilirubin adsorption therapy, artificial liver support, and even liver transplantation should be performed earlier when conventional therapy failed.27
Patients, receiving TIPS operations, are usually in the late stage of cirrhosis. The change in liver histology and haemodynamics in cirrhosis patients contributes to portal hypertension. With the deterioration of the disease, especially the obstruction of portal vein return, the volume of the spleen may increase over time. Published research found that spleen size or stiffness can be applied to evaluate cirrhosis and diagnose portal hypertension.28–30 In addition, more reports have focused on the relationship between spleen volume and cirrhosis prognosis.8,31 Liu et al indicated that smaller spleen volume can be identified as a significant risk factor for predicting post-TIPS overt hepatic encephalopathy.32 Kwon et al showed that liver to spleen volume ratio measured on CT can be identified as an independent predictor of hepatic decompensation and transplantation-free survival in patients with hepatitis B viral compensated cirrhosis.33 Yang et al also demonstrated that spleen volume can be used to determine the high risk of oesophageal varices.34 Patients with increased splenic volume were related to portal hypertension, implying that spleen volume may be involved in the prediction of worse prognosis and severe portal complication.
In patients with chronic liver disease, platelets play a role in the various mechanisms of liver regeneration.35,36 Previous studies suggested that platelet count was associated with postoperative mortality and recovery of liver function after surgery.37,38 Platelet count is also incorporated to construct models to predict the prognosis of cirrhosis patients and is considered a significant predictor in predicting liver dysfunction.39
Recently, the increasing studies have investigated the relationship between spleen volume and platelet count.12,29,40 Ouyang et al indicated that the platelet count-to-spleen volume ratio can be regarded as a convenient and non-invasive tool to determine the cirrhosis stage in patients with hepatocellular carcinoma.40 Additionally, Lee et al found that SVPR was an independent predictor in detecting a high risk of oesophageal varices and assessing the possibility of varicose bleeding.12 Similarly, a study by Chen et al also pointed out that SVPR can be used to determine the oesophageal varices, and performed better than right liver volume * platelet count/spleen volume.29 With these findings, we found that SVPR was an independent prognostic factor of prognosis in patients after TIPS operation.
There existed some limitations in our study. First, the retrospective nature of the present study may be subject to unavoidable selection bias and missing information. For instance, the portal pressure gradient was not recorded in our medical documentation. In addition, our collected data were from one single medical centre with a relatively small sample size. To better extrapolate our results, more external prospective studies should be performed to validate our study and evaluate its clinical utility.
In conclusion, we constructed a novel predictive nomogram and Web-based probability calculator based on several variables (age, SVPR, TB) to predict OS rates of patients treated with TIPS operation. The established nomogram exhibited good predictive performance of OS. A further prospective study is needed to validate its clinical use.
Funding
This study has received funding from the Wenzhou Municipal Science and Technology Bureau (Grant No. ZY2020013) and Research Incubation Project of the First Affiliated Hospital of Wenzhou Medical University (Grant No. FHY2019042).
Conflicts of interest
None declared.
References
Antonelli M, Reinke A, Bakas S, Farahani K, Kopp-Schneider A, et al. The Medical Segmentation Decathlon. Nat Commun 2022;13:4128.
