


This study aimed to investigate the contrast-enhanced ultrasound (CEUS) appearances of prostate tuberculosis (PTB) and its correlation with histopathology.
Clinical, transrectal ultrasonography (TRUS) and CEUS data of 12 PTB patients confirmed by pathology were retrospectively analyzed, and compared to the pathological findings to identify the pathological structures corresponding to different image enhancement areas.
No specific characteristics could be found for the clinical appearances. Enlarged gland, hypoechoic lesions and calcification due to PTB could be found by TRUS, which were also non-specific. CEUS showed hypo- or non-enhanced lesions with varying size, which were related to different pathological stages of PTB. The incidence rate of non-enhanced lesions was 83.3%. The detection rate of suspected lesion by CEUS was significantly higher than that by TRUS (χ2 = 8.000, p = 0.005). Histopathology showed that the hypoenhanced area consisted of tuberculous granulomas, caseous necrosis and incomplete destruction of the glands, while the non-enhanced area consisted of caseous or liquified necrosis.
CEUS could improve the detection rate of PTB lesions, and the diversity of its manifestations was related to different pathological structures. An enlarged, soft gland with non-enhanced on CEUS may provide valuable information for the diagnosis of PTB, but it is not a substitute for biopsy due to the diversity of CEUS findings.
When the lesions of prostate gland are unclear in TRUS examination, CEUS is an ideal option for the detection of lesions, which is conducive to targeted guidance of biopsy areas.
Introduction
Tuberculosis (TB) of the genitourinary tract was reported as the second most common form of extra pulmonary TB. 39.5–50% of urogenital TB cases involve the prostate histologically. Prostate TB (PTB) is subclinical and is usually incidentally found by transurethral resection.1,2 Kulchavenya et al3 reported that only half of PTB patients manifested with dysuria, and 39.6% had perineal pain. Therefore, it is difficult to diagnose PTB in the early phase based on clinical appearance.4 Transrectal ultrasonography (TRUS) can be used to determine the size, shape, internal structure and vascularity of prostate gland, but the findings are also non-specific.5 As a related novel technique, contrast-enhanced ultrasound (CEUS) is useful for demonstrating the perfusion of organs and lesions.6 Transrectal CEUS can be used to characterize neoplastic microcirculation of prostate cancer, locate suspicious areas of cancer before surgery, and guide and manage treatment.7 However, few studies have reported the use of CEUS in the diagnosis of PTB.
The purpose of this study was to investigate the CEUS appearances of PTB and the value of increasing diagnostic information by comparing with histopathology.
Methods and materials
Patients
Patients with confirmed PTB in the Affiliated Hangzhou Chest Hospital, Zhejiang University School of Medicine from May 2011 to October 2019 were retrospectively enrolled. The inclusion criteria were as follows: (1) TRUS and CEUS were performed; (2) confirmed by pathology or Gene Xpert through TRUS-guided biopsy; (3) complete clinical data could be obtained; (4) patients with prostate-related signs or symptoms, including digital rectal examination (DRE) abnormal, perineum pain, urethra purulent secretion and pyuria etc; (5) prostate-specific antigen (PSA) ≥4 ng ml−1.
Finally, 12 male patients with a mean age of 30.8 ± 11.0 years and a range of 17–56 years were included in this study. This study was approved by the ethics committee of Affiliated Hangzhou Chest Hospital, Zhejiang University School of Medicine, and the written informed consent was obtained for each subject after informing the possible complications of every procedure. The clinical data were collected by reviewing the medical history system.
TRUS and CEUS
TRUS was performed using an ultrasonic diagnostic system (iU22, Philips Healthcare, Bothell, WA) with an intracavitary probe (C9-5ec). The frequency was set to 5–9 MHz. Patients were told to urinate and empty the bladder just before the procedure, and were asked to lie on the table in the left decubitus position with the knees bent toward the chest. DRE was conducted to ensure no obstruction or stenosis caused by the rectus muscles. A protective cover and lubricant were placed on the probe, and then it was inserted into the rectum. The size, echogenicity and blood flow signals of the prostate gland and lesions were recorded by multiplanar scanning.
After TRUS examination, CEUS was performed by injecting 4.8 ml SonoVue (Bracco, Milan, Italy) into the superficial antecubital vein through a catheter, followed by a 5 ml saline flush. The mechanical index used for CEUS was 0.08. The largest suspected lesion, as determined by TRUS, was observed consistently on the maximum section during the arterial phase. Whole prostate gland was scanned in the venous phase. If no suspected lesion was identified by TRUS, the maximum cross-section of the gland was applied in the arterial phase. Dual-display on the ultrasound system provided simultaneous visualization of the conventional image on one side-and the contrast-enhanced image on the other side. The cine loops were digitally recorded on a disk for further analysis.
TRUS-guided biopsy and pathology
Using an 18 gauge (20 cm long) needle (Bard, AZ), TRUS-guided biopsy was performed for all patients. Targeted guidance of biopsy areas were performed first in the designated sites indicated on CEUS, At least one core per lesion for multiple Lesions, and ≥3 cores per lesion for a single lesion was taken. Then supplemented by standard 10-core systematic biopsy. Six cores were directed laterally, including one on each side at the base, mid gland and apex. The remaining four biopsies were taken from the upper and lower portions of the prostate at a parasagittal location.8 However, when the nodule is at the location of the systematic biopsy, the biopsy is not repeated at this location. If throughout the whole gland almost non-enhanced, systematic biopsy is performed. Based on the tolerability, each patient underwent biopsies of ≤12 cores.
Pathological examination and Gene Xpert were performed on each patient’s pecimens. The pathology results were obtained using hematoxylin-eosin staining by a specialized pathologist with >20 years’ experience in prostate pathology. Ziehl-Neelsen staining of acid-fast bacilli was also performed on all specimens.
Data analysis
The digital record data of TRUS and CEUS were stored separately and independently reviewed by two radiologists with similar experience, who were blinded to the patient’s clinical and other imaging information. The size, internal echogenicity and vascularity of prostate gland were observed in the TRUS analysis.
The prostate volume was measured in the transverse view, using the preset ellipsoid formula installed in our ultrasound machine.
For CEUS analysis, the enhancement patterns of the prostate gland and internal nodules were observed. Contrast enhancement was classified into non-enhanced, hypo- or hyper-enhanced, homogeneity or heterogeneity. An abnormal non- or hypo-enhanced region with well-defined boundary on CEUS, which was defined as a suspected lesion, was selected for needle biopsy.
Statistical analysis
SPSS v. 18.0 software (IBM Corporation, Armonk, NY) was used for statistical analysis. The count data were expressed as ratios, and compared between the two examinations through χ2 test. A p value < 0.05 indicated a statistically significant difference.
Results
The clinical characteristics of 12 patients were summarized in Table 1. The results of DRE: enlarged prostate (nine cases) with a regular surface, hard consistency (one case), nodules (three cases), mild tenderness (four cases), and no tenderness in the pelvic wall. The patients’ mean PSA value was 7.9 ng ml−1, their median PSA value was 7.95 ng ml−1 (range, 4.0–15.8 ng ml−1), PSA >10.0 ng ml−1 in one case.
The clinical manifestation of the 12 patients
| Clinical manifestation | Number of cases | Percentage (%) |
|---|---|---|
| Volume of the prostate >20 ml | 5 | 41.7 |
| Low fever | 6 | 50.0 |
| Hematospermia | 1 | 8.3 |
| Hematuria | 1 | 8.3 |
| Pyuria | 3 | 25.0 |
| Urethra purulent secretion | 3 | 25.0 |
| Micturition or urination difficulty | 1 | 8.3 |
| Perineum pain | 6 | 50.0 |
| Combined with HIV | 1 | 8.3 |
| Combined with TB of other organs | 10 | 83.3 |
| PSA >10 ng ml−1 | 1 | 8.3 |
PSA, prostate-specific antigen; TB, tuberculosis.
TRUS showed enlarged prostate gland with heterogeneous echogenicity (nine cases), suspected lesions with hypoechoic appearance in the gland (six cases, left side of Figures 1a and 2a), and calcifications in the gland (six cases, left side of Figures 3a and 4a).
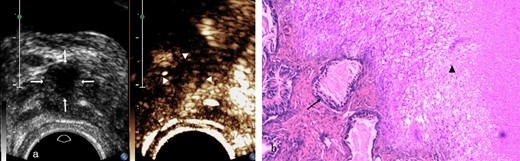
Prostate tuberculosis in a 23-year-old male. a, The axial TRUS examination demonstrated an irregular hypoechoic nodule (arrows) in the left side-of the peripheral zone. The axial CEUS examination demonstrated a heterogeneous hyperenhanced nodule (arrowheads) in the left side of the peripheral zone. b, Photomicrograph shows some prostatic acini (arrow) in the lower left side while some tuberculosis granuloma in the upper right side with typical caseous necrosis, epithelioid cells and langhans giant cells (arrow head) inside. (Hematoxylin& eosin, ×40). CEUS, contrast-enhanced ultrasound; TRUS, transrectal ultrasonography.
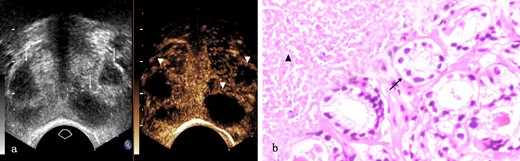
Prostate tuberculosis in a 17-year-old male. a, The axial TRUS examination demonstrated a change of the overall echogenicity and several poorly defined irregular hypoechoic nodules (arrows) inside. The axial CEUS examination demonstrated non-enhanced area (arrowheads) while heterogeneous enhancement in other parts of the prostate. b, Photomicrograph shows some prostatic acini (arrow) in the lower right side while caseous necrosis (arrow head) in the upper right side. (Hematoxylin & eosin, ×100). CEUS, contrast-enhanced ultrasound; TRUS, transrectal ultrasonography.
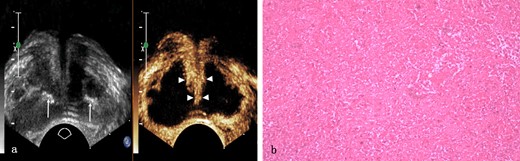
Prostate tuberculosis in a 56-year-old male. a, The axial TRUS examination demonstrated an enlarged prostate with the overall hypoechogenicity and some strip-like or dotted hyperechogenic area (arrows) inside. The axial CEUS examination demonstrated a large sheet-like non-enhanced area while strip-like enhancement (arrowheads) in the center of the prostate. b, Photomicrograph shows typical caseous necrosis. (Hematoxylin & eosin, ×100). CEUS, contrast-enhanced ultrasound; TRUS, transrectal ultrasonography.
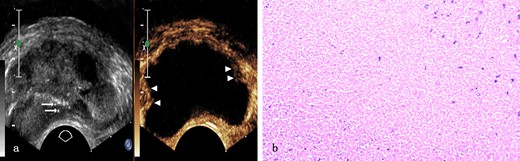
Prostate tuberculosis in a 31-year-old male. a, The axial TRUS examination demonstrated an enlarged prostate of generalized decreased echogenicity and some dotted hyperechoic area (arrows) inside. The axial CEUS examination demonstrated a large sheet-like non-enhanced area with some enhanced area only(arrowheads) in the peripheral zone. b, Photomicrograph shows typical caseous necrosis with some neutrophils inside. (Hematoxylin & eosin, ×100). CEUS, contrast-enhanced ultrasound; TRUS, transrectal ultrasonography.
CEUS examination revealed three types of appearance. First, hypoenhanced suspected lesions in the gland (two cases, right side of Figure 1a). Second, non-enhanced suspected nodular lesions in the gland (four cases, right side of Figure 2a). Third, large non-enhanced suspected lesions occupying more than one-third of the glandular volume or >2 glandular lobes (six cases, right side of Figures 3a and 4a). The incidence rate of non-enhanced lesions was 83.3%.
The performances of PTB on TRUS and CEUS examinations were shown in Table 2.
The performance of prostate tuberculosis on TRUS and CEUS examinations (n = 12)
| Patient | Age, y | The size of the prostate, cm | The number of nodule | The size of the nodulea cm | Distribution | Echogenicity | The amount of calcification | The performance of CEUS |
|---|---|---|---|---|---|---|---|---|
| 1 | 23 | 2.9 × 4.1×2.7 | 1 | 0.92 × 0.53×0.59 | L/P | Hypoechogenicity | 0 | Non-enhanced area in the left side of the peripheral zone |
| 2 | 19 | 3.3 × 3.7×2.5 | 1 | 0.77 × 0.51×0.60 | R/C | Hypoechogenicity | 0 | Non-enhanced area in the right side of the central zone |
| 3 | 24 | 3.2 × 4.3×2.5 | 0 | – | B/P | Hypoechogenicity | 1 | A large sheet-like non-enhanced area in the right of the prostate |
| 4 | 23 | 3.0 × 4.6×2.9 | >3 | 0.90 × 0.51×0.44 | L/P | Hypoechogenicity | 3 | A heterogeneous hypo-enhanced nodule in the left side of the peripheral zone |
| 5 | 56 | 3.2 × 5.2×3.4 | 0 | – | B/A | Hypoechogenicity | >3 | A large sheet-like non-enhanced area while strip-like enhancement in the center of the prostate |
| 6 | 24 | 3.0 × 4.0×2.9 | 0 | – | R/P | Hypoechogenicity | 1 | A large sheet-like non-enhanced area in the right of the peripheral zone |
| 7 | 39 | 2.9 × 4.0×2.8 | 0 | – | B/A | Hypoechogenicity | 0 | Almost non-enhanced throughout the whole gland |
| 8 | 44 | 3.0 × 3.9×2.8 | 3 | 0.70 × 0.43×0.49 | R/C | Hypoechogenicity | >3 | Multiple non-enhanced areas in the right side of the central zone |
| 9 | 17 | 3.3 × 4.8×3.1 | >3 | 1.12 × 0.73×0.48 | B/A | Hypoechogenicity | 0 | Multiple hypoenhanced areas in different zone of the prostate |
| 10 | 31 | 3.5 × 5.6×3.3 | 0 | – | B/A | Hypoechogenicity | >3 | A large sheet-like non-enhanced area with some enhanced area only in the right side of the outer gland. |
| 11 | 36 | 3.2 × 4.5×3.0 | 0 | – | B/A | Hypoechogenicity | 0 | A large sheet-like non-enhanced area while strip-like enhancement in the center of the prostate |
| 12 | 33 | 3.1 × 4.0×2.8 | 2 | 0.40 × 0.33×0.29 | L/P | Hypoechogenicity | 0 | Non-enhanced area in the left side of the peripheral zone |
A, All (peripheral zone and central zone);.B, Both right and left.C, Central zone.CEUS, contrast-enhanced ultrasound; L, Left.P, Peripheral zone.R, Right;TRUS, transrectal ultrasonography..
If the number of the nodules is more than one, it means the size of the largest one.
The detection rate of suspected lesions by TRUS was 50% (6/12), and the diagnosis rate was significantly increased to 100% (12/12) by CEUS (χ2 = 8.000, p = 0.005).
Prostatic biopsy was successfully performed of the 12 patients without complication.
According to pathological findings, tuberculosis granuloma containing epithelioid cells and Langhans giant cells showed staggered distribution with caseous necrosis in the hypoenhanced lesions (Figure 1b). Isolated caseous necrosis was observed around the normal prostate gland (Figure 2b) related to non-enhanced nodular lesions. Caseous necrosis was observed to spread almost throughout the entire prostate gland associated with large non-enhanced lesion (Figures 3b and 4b).
The results of pathological examination, acid-fast staining, culture and Gene Xpert of 12 patients’ specimen were listed in Table 3.
Pathologic results of the specimen, acid-fast staining and Gene Xpert of 12 patients
| No. | Biopsy site | Pathologic findings | Acid-fast staining | Culture | Gene Xpert |
|---|---|---|---|---|---|
| 1 | Non-enhanced nodule | Necrosis, granuloma | − | + | − |
| 2 | Non-enhanced nodule | Necrosis, pus | + | − | − |
| 3 | Non-enhanced area | Massive necrosis | + | − | + |
| 4 | Heterogeneous hypoenhanced area | Granuloma and patches of necrosis | − | − | + |
| 5 | Non-enhanced area and strip-like enhancement | Massive necrosis and granuloma | + | − | − |
| 6 | Non-enhanced area | Massive necrosis, pus | + | − | + |
| 7 | Non-enhanced area | Massive necrosis | − | + | − |
| 8 | Multiple non-enhanced nodules | Granuloma and patches of necrosis | − | − | − |
| 9 | Hypoenhanced areas | Necrosis and granuloma | + | − | + |
| 10 | Non-enhanced area | Massive necrosis | + | − | + |
| 11 | Non-enhanced area and strip-like enhancement | Massive necrosis inclusion granuloma | − | − | − |
| 12 | Non-enhanced area | Granuloma and patches of necrosis | − | + | − |
+, positive.
−, negative.
Discussion
TB continues to have high morbidity and mortality rates worldwide despite preventive measures, and inexpensive and effective treatments.9 PTB is relatively rare, but 77% of males who die of tuberculosis had PTB, which is usually overlooked during their life time.10 Diagnosis of PTB is important as: (a) it is a sexually transmitted disease; (b) it leads to infertility; (c) as in any prostatitis, it results in chronic pelvic pain, which significantly reduces quality of life; and (d) it decreases sexual function, which also reduces quality of life.4 TB can lead to extensive tissue destruction and fibrosis, and early diagnosis and anti-TB chemotherapy may prevent organ damage and loss.11
PTB is primarily a hematogenously spread infection, but it can also be caused by a downward urethral infection or a local spread of genital TB.12 The prostatic artery that supplies blood to the prostate gland mainly originates from the inferior vesical artery, and its end is divided into two branches, including the prostatic capsule artery and the prostatic urethra artery. The capsule branch descends along the posterolateral side of the gland, and the urethra artery enters the prostate gland from the side.13,14 Therefore, TB foci tend to occur in the peripheral zone of the posterior and lateral lobes of the prostate gland.15 In this study, there were five cases with peripheral zone involvement, five cases with peripheral and central zone involvement, and only two cases with central zone involvement. These two patients had a history of urinary TB, and Mycobacterium tuberculosis might initially proliferate and then form a lesion at the opening of the ejaculatory duct.
CEUS can evaluate the microcirculation of solid tissues and organs. It can better reflect and detect the low-speed and small microvessels in the prostate gland, and display the changes of microvessels that cannot be shown by grayscale images.6,16 This study showed that the CEUS manifestations of PTB were related to different pathological processes. Two cases of CEUS showed hypoenhanced lesions, and histopathological analysis mainly showed inflammatory cell infiltration, vascular dilatation, and small tuberculous granulomas around the vessels, indicating that they were in the early stage of catarrhal inflammation. Four cases showed lesions with non-enhanced nodules, pathological examination showed caseous necrosis, no capillary and glandular structures, with a small amount of granulomas and normal glandular structures at the edge. Moreover, with the increase of caseous necrotic substances, the area of affected gland expanded and even occupied the whole gland, presenting a large area with non-enhanced. In this study, there were six such cases. These enhancement phenomena have been reported in CEUS of TB foci in other organs, which suggests that the pathological changes caused by PTB are similar to other organs.17,18 The possible causes for the diverse appearances of CEUS included the following. First, vascular destruction occurred within the TB foci, which manifested as a continuous process from local to overall necrosis. Second, the enhancement pattern was related to the pathological duration, and both the number of granulomas and the size of necrotic foci were linked with the diversity of CEUS. Furthermore, the compression of the hyperplastic central gland and peripheral gland in cases with prostatic hyperplasia might lead to a certain bias in the judgment of CEUS manifestations of the lesions located in the peripheral gland.
Wang et al19 reported the MRI manifestations of diffuse PTB in one case, and T 1WI was manifested as striated low signal, i.e. watermelon rind-like changes, and they believed that this might be a specific sign of PTB. However, Cheng et al20 did not observe this sign. Our study also found no similar imaging presentations, while 83.3% of the cases showed non-enhanced areas, corresponding to the pathologically necrotic areas, which might be the most common CEUS sign of PTB. The possible reason was that the clinical symptoms of PTB were insipid, and necrosis usually occurred when the symptoms appeared. The destruction of blood vessels in the TB foci was a continuous process from local to entire prostate, so there were large or small non-enhanced areas. Half of the cases in this study showed non-enhanced in large areas, or even the whole gland. For such cases, a TB-related laboratory test (Gene Xpert) was performed after needle biopsy, which might help confirm the diagnosis. We recommended that male TB patients could underwent CEUS earlier in order to detect the disease earlier.
Sano et al21 reported that CEUS of prostate cancer showed diversity, such as hyperenhanced, rapid enhancement, abnormal vascular perfusion and hypoenhanced. Due to the disorder of the tumor’s microvascular structure, blood supply was limited and oxygen transport was obstructed, which could lead to ischemia and necrosis.22 However, the necrosis of prostate cancer usually does not involve the whole gland, which is different from the PTB in this study. We found that the pressure of the probe could change the shape of the prostate, and it felt softer than normal. During CEUS, the probe should not be pressurized to prevent the contrast medium microbubbles from entering the glandular blood vessels, causing errors. We hypothesized that a soft gland with non-enhanced area on CEUS might help distinguish PTB from prostate cancer. However, there is a partial overlap due to the diversity of CEUS manifestations of PTB and prostate cancer, and a needle biopsy might be needed for further differentiation.
When the lesions of prostate gland are unclear in TRUS examination, CEUS is an ideal choice for the detection of lesions, which is conducive to the targeted guidance of the biopsy areas.8,23 In this study, 6 out of 12 cases showed heterogeneous glands without definite lesions in TRUS, and clear abnormal enhancement or non-enhanced areas could be observed after injection of contrast agent. Targeted biopsy of the lesion was performed, and all specimens obtained were clearly diagnosed. In this study, a patient who had performed conventional grayscale ultrasound-guided systemic biopsy (six cores) in another hospital, but the diagnosis was not clear. We performed CEUS-guided targeted biopsies on them, targeted biopsies on non-enhancing nodules (three cores), followed by supplementary systematic biopsy (seven cores). We found that the samples were confirmed by Gene Xpert in the targeted biopsy (three cores), whereas supplementary systematic biopsy (seven cores) failed to confirm the diagnosis. These results indicate that CEUS-guided targeted biopsy helps to improve the positive rate of specimen detection and may have the potential to reduce the number of biopsy cores.
TRUS-guided biopsy of the prostate is usually safe, Complications after biopsy are often self-limiting. However, because TRUS-guided prostate biopsy obtains tissues through the rectum, potential risks may occur.24,25 Borghesi et al25 reviewed the variety and incidence of complications after prostate biopsy according to Systematic Review and Meta-analysis, The most frequent complication is minor and self-limiting bleeding (hematuria and hematospermia), aslo including lower urinary tract symptoms, rectal bleeding, temporary erectile dysfunction and infectious complications, etc.24,25 It has been reported that in order to minimize these risks, perform targeted biopsy could reduce the number of biopsy cores taken and, therefore lower complications rates, without compromising detection rates.25 In this study, CEUS-guided targeted biopsy was performed, supplemented by systematic biopsy. Prostatic biopsy was successfully performed in 12 patients without complication.
The following limitations were noted. This study was a separate, qualitative analysis with small sample size, which should be improved in the future. The value of CEUS in differential diagnosis of PTB and conventional bacterial prostatitis needs further study.
Conclusions
In conclusion, the CEUS manifestations of PTB were diverse, which might be related to different pathological stages of the lesions. CEUS improved the detection rate of suspicious lesions compared to TRUS. An enlarged, soft gland in non-enhanced area on CEUS might provide valuable information for the diagnosis of PTB, but it was not a substitute for biopsy due to the diversity of CEUS findings. CEUS should be performed for every male patient with indications, without increasing the patient’s suffering. The suspicious lesions detected by CEUS can further precisely guide the needle biopsy, help to improve the positive rate of specimen detection and may have the potential to reduce the number of biopsy cores.
This work was supported by the Science and Technology plan of Hangzhou [grant numbers 20180533B68]; the Agriculture and Social development plan [grant number 20190101A09].
REFERENCES
