


Early detection of peripheral neuropathy is extremely important as leprosy is one of the treatable causes of peripheral neuropathy. The study was undertaken to assess the role of diffusion tensor imaging (DTI) in ulnar neuropathy in leprosy patients.
This was a case–control study including 38 patients (72 nerves) and 5 controls (10 nerves) done between January 2017 and June 2019. Skin biopsy proven cases of leprosy, having symptoms of ulnar neuropathy (proven on nerve conduction study) were included. MRI was performed on a 3 T MR system. Mean cross-sectional area, fractional anisotropy (FA) and apparent diffusion coefficient (ADC) values of ulnar nerve at cubital tunnel were calculated. Additional ancillary findings and appearance of base sequences were evaluated.
Ulnar nerve showed thickening with altered T 2W signal in all the affected nerves, having an average cross-sectional area of 0.26 cm2. Low FA with mean of 0.397 ± 0.19 and high ADC with mean of 1.28 ± 0.427 x 10 −3 mm2/s of ulnar nerve in retrocondylar groove was obtained. In the control group, mean cross-sectional area was 0.71cm2 with mean FA and ADC of 0.53 ± 0.088 and 1.03 ± 0.24 x 10 −3 mm2/s respectively. Statistically no significant difference was seen in diseased and control group. Cut-off to detect neuropathy for FA and ADC is 0.4835 and 1.1020 × 10 −3 mm2/s respectively.
DTI though is challenging in peripheral nerves, however, is proving to be a powerful complementary tool for assessment of peripheral neuropathy. Our study validates its utility in infective neuropathies.
1. DTI is a potential complementary tool for detection of peripheral neuropathies and can be incorporated in standard MR neurography protocol.
2. In leprosy-related ulnar neuropathy, altered signal intensity with thickening or abscess of the nerve is appreciated along with locoregional nodes and secondary denervation changes along with reduction of FA and rise in ADC value.
3. Best cut-offs obtained in our study for FA and ADC are 0.4835 and 1.1020 × 10 −3 mm2/s respectively.
Introduction
Leprosy is one of the common chronic infective diseases of tropical and subtropical countries, caused by Mycobacterium leprae. The disease predominantly affects the skin, upper respiratory tract and peripheral nerves.1,2 Impairment of nerve function at presentation is seen ~55% of cases.3 Extent of nerve involvement depends on the bacterial load and the immunological response of the host. Early detection of peripheral neuropathy is of utmost importance as this leads to severe disabilities if left untreated.4 This pathogenic bacteria has a tendency to proliferate at cooler sites, hence nerves at superficial locations are most likely to be affected. Ulnar nerve is most commonly affected at the elbow in the cubital tunnel where it is covered only by skin and fascia. It invariably causes enlargement of the affected nerve and can lead onto intraneural or perineural abscess formation.5
Clinical history, electrophysiological studies and histopathology are the mainstay of diagnosis of peripheral neuropathy. However, imaging is also emerging as an important tool for its evaluation. Few studies have been done in the past using ultrasonography as the imaging modality. A study by Jain et al in 2009 compared USG to clinical examination in leprosy patients and concluded ultrasound to be more objective and accurate by determining the nerve echotexture, enlargement and vascularity.6
MR neurography is a well-established and more objective diagnostic modality for peripheral neuropathy. Change in nerve caliber and altered signal intensity on T 2W image are the two most important criteria for diagnosis of peripheral neuropathy.7 The role of diffusion tensor imaging (DTI) in the diagnosis of peripheral neuropathy is still under investigation. It assesses the nerve integrity through a quantitative parameter called fractional anisotropy (FA) and apparent diffusion coefficient (ADC).8 It acts as a functional imaging tool for peripheral nerves, and studies are being undertaken to evaluate its correlation with nerve conduction studies, which are the current standard of diagnosis.
Most of the protons in the body have free diffusion in all directions. Peripheral nerves show the property of anisotropic diffusion, i.e. facilitated diffusion in one direction and restricted in the other transverse planes. This property of anisotropic diffusion is utilized in DTI. Pathological nerves, which have disruption of myelin, will allow diffusion in other directions as well, in addition to the facilitated one, thereby leading to fall in the value of FA and rise in ADC.9
DTI can detect changes of demyelination in the brain earlier than conventional MR sequences. Studies have been taken up to determine if the same can be applied to peripheral nerves. Few recent studies have shown general feasibility of diffusion tensor imaging (DTI) in peripheral nerves.10–15 FA values are obtained which depict directional preference of nerve fibers. ADC in general predicts the restriction of movement in any direction, whereas FA predicts restriction in a particular direction.
This study was undertaken to assess the role of DTI in peripheral neuropathy in Hansen’s disease. In our study, we hypothesized that DTI could be a useful tool in the evaluation of Hansen disease involving the ulnar nerve, with nerve conduction study as the gold-standard. To the best of our knowledge, this is the first case–control study to assess the role of DTI in leprosy.
Methods
This is a case–control study done between January 2017 and June 2019. The results were compared to nerve conduction studies which was chosen as the gold-standard. The study was performed after approval of the institutional ethical committee. Informed consent was taken from the patients enrolled in the study. The study was undertaken on 3T (Philips Ingenia; Philips Healthcare, Netherlands) MRI scanner using knee coil (eight channel). Parameters like FA, ADC and mean cross-sectional area of ulnar nerve at the level of cubital tunnel were assessed by DTI sequence. These imaging biomarkers could potentially help to define prognostic markers in Hansen’s patient with different nerve involvement. Data from this work thus may help in further understanding of Hansen neuropathy and also investigate the role of DTI in peripheral neuropathy.
Study population included patients of Hansen disease (confirmed on skin biopsy) with symptoms of ulnar neuropathy which was confirmed on nerve conduction study. Patients who did not give consent or were non-compliant or had flexion deformity were excluded from study.
Imaging
MR neurography
MRI was performed on a clinical 3.0-T Philips Ingenia system (Philips Healthcare, Amsterdam, Netherlands)) and an 8-channel surface array knee coil. T 1 SE, T 2W with SPectral Attenuated Inversion Recovery, T 2 FS 3D and diffusion-weighted echoplanar imaging for DTI were performed. Ulnar nerve was examined in the cubital tunnel in elbow region. Subjects were made to lie prone in superman’s position for the examination. Knee 8-channel transmit-receive phased-array radiofrequency coil was centered around the area of interest. For DTI, we used a spin-echo echoplanar imaging sequence with b values of 0 and 800. Diffusion gradient was applied in 16 directions for DTI and correction for distortions and eddy currents were done. The study protocol is described in Table 1.
MR neurography sequences
| Sequence | TR | TE | Matrix | Voxel | NSA | Acquisition time |
|---|---|---|---|---|---|---|
| T 2W TSE | 785 | 10 | 304 × 240 | 0.39 × 0.50×3.0 | 2 | 3.5 min |
| 3D T 2W FS | 1500 | 53 | 208 × 206×180 | 0.67 × 0.68×0.68 | 2 | 5.34 min |
| DTI | 2177 | 88 | 128 × 126×30 | 1.17 × 1.19×4.00 | 2 | 6.44 min |
| T 2W SPAIR | 4078 | 60 | 268 × 208×36 | 0.45 × 0.58×3 | 2 | 4.29 min |
DTI, diffusion tensor imaging; FS, fat saturated; SPAIR, SPectral Attenuated Inversion Recovery; TSE, turbo spin echo.
Post-processing and fiber tractography
After acquisition of MR neurography, the images were post-processed and evaluated by two readers in consensus. The readers were trained radiologists having 4 and 6 years of experience in DTI post-processing. After acquisition of MR neurography, images were transferred to the workstation. The DTI images were loaded in advanced fiber tractography software available on Philips workstation. The axial images of DTI sequence were superimposed by basic T 1W sequence for anatomical delineation. Thereafter, ROI was drawn covering the ulnar nerve in cubital tunnel and values of FA and ADC were automatically generated. The 3D images were then made coronal from axial and fiber tractography was performed. Both readers worked together in processing and evaluated the nerves for cross-sectional area (measured where the nerve had maximum diameter in cubital tunnel), T 2 signal, ADC and FA value of nerves.
Analysis
All the affected nerves which showed reduced or abnormal nerve velocity on nerve conduction study, were evaluated for their signal intensity on T 1 and T 2 weighted sequences. Ancillary findings of associated nerve thickening, other nerve involvement, presence of nodes, abscess formation, secondary denervation changes were evaluated on base sequences. Quantitative analysis of the involved nerve ADC and FA values were performed and their mean values and cut-off values were generated.
Statistical analysis
The statistical analysis was performed using R software v. 4.0.3 (R Foundation for Statistical Computing, Vienna, Austria). Non-parametric data were expressed as numbers (percentage) and analyzed using the χ2 test. Continuous data of the patients and control were expressed as mean ± standard deviation (SD). Normality of continuous data was assessed using Shapiro-Wilk test. Student’s t-test was used to compare the continuous variables if the condition of normality of data was fulfilled for the parametric tests, otherwise non-parametric equivalents of parametric tests were used.
The best FA and ADC cut-off values for the diagnosis of leprosy neuropathy were calculated using receiver operating characteristic (ROC) curve analysis. A p-value of less than 0.05 was considered statistically significant.
Results
We included 38 patients and 5 controls in our series. 34 out of 38 patients had bilateral involvement, only 4 had unilateral involvement, thus total of 72 pathological nerves (n) and 10 normal nerveswere evaluated. Table 1 shows the distribution of variables among the two groups (Table 2). Mean age of the patient and control groups was 31.4 ± 9.8 years and 32 ± 5.6 years respectively. There was male preponderance in our study with male to female ratio of 2.4. At the time of presentation, mean duration of symptoms was 2.96 years. Maximum number (n = 30) of patients had symptoms for 3–4 years.
Comparative indices of study and control group
| Dependent: group | Patient | Control | p | |
|---|---|---|---|---|
| Age | Mean (SD) | 31.4 (9.8) | 32.0 (5.6) | 0.9005 |
| Gender | F | 19 (26.39) | 4 (40.00) | 0.6015 |
| M | 53 (73.61) | 6 (60.00) | ||
| FA | Mean (SD) | 0.4 (0.1) | 0.5 (0.1) | 0.15 |
| ADC | Mean (SD) | 1.3 (0.2) | 1.0 (0.2) | 0.08 |
ADC, apparent diffusion coefficient; FA, fractional anisotropy.
The ulnar nerve showed altered T 2W signal in all the patients of leprosy, however 13.8% nerves showed mild signal alteration, whereas the rest showed frank T 2W hyperintensity. 69.4% of pathological nerves showed isointense signal on T 1W images and 30.6% nerves showed hypointense signal on T 1W sequence. Majority of the nerves showed associated thickening, only 2 nerves out of 72 did not show thickening but only altered signal intensity. Abscess formation was seen in 6.9% (n = 5) nerves (Figure 1), whereas in rest 93.1% (n = 67) there was no abscess formation. Of the 72 upper limbs that were evaluated, there was multiple nerve involvement (of median and radial besides ulnar) in 11 cases (Figure 2), whereas rest showed isolated involvement of ulnar nerve. In addition, local lymph nodes were present in 38.8% (n = 28) of cases, whereas the rest did not show any locoregional lymphadenopathy. Secondary denervation changes in the form of either T2 hyperintensity or both T1 and T2 hyperintensity in flexor carpi ulnaris muscle was noted in 26.38% (n = 19) cases. DTI tractography images were also formed which show significant difference in nerve fibers of the affected nerve as compared to other normal nerve in the same section (Figure 3).
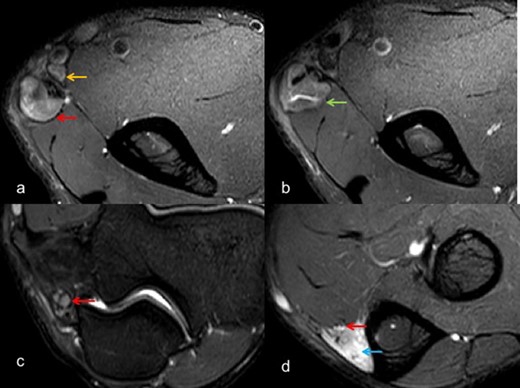
Axial T 2W SE FS images (a-d) depict marked thickening and altered signal intensity of ulnar nerve (red arrow) with large abscess (green arrow) formation. In addition, local nodes can be visualized (yellow arrow), with secondary denervation in flexor carpi ulnaris (blue arrow). FS, fat saturated; SE, spin echo.
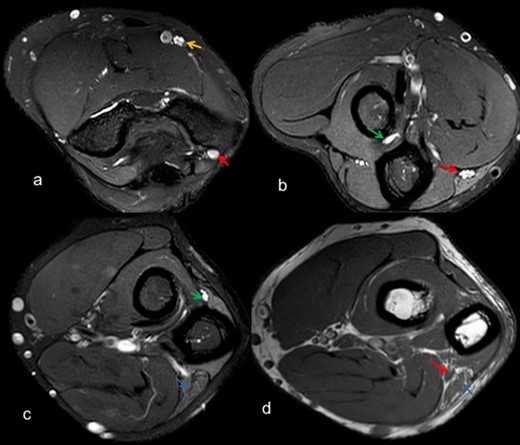
Axial T2 weighted SE FS images (a-c) depict thickening and altered signal intensity of ulnar nerve (red arrow), median nerve (yellow arrow), posterior interosseous nerve (green arrow) along with denervation changes in flexor carpi ulnaris (blue arrow), (d) T 1W SE depicts thickening of ulnar nerve (red arrow) with fatty infiltration in flexor carpi ulnaris (blue arrow). FS, fat saturated; SE, spin echo.
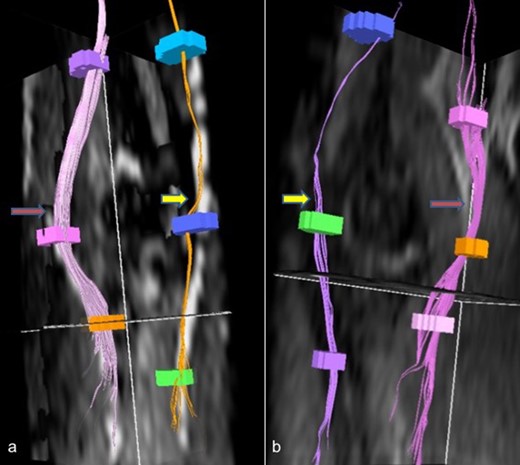
Reformatted DTI images (a, b) shows affected ulnar nerves (yellow arrow) with reduced density of fibers as compared to other normal nerves (red arrow). DTI, diffusion tensor imaging.
The affected ulnar nerves had an average cross-sectional area of 0.26 cm2. Consistently low FA of ulnar nerve was observed in retrocondylar groove in all patients who were having reduced or absent nerve conduction velocity at that level. The value of FA in the diseased group ranged from 0.188 to 0.646 with a mean of 0.397 ± 0.19, whereas the mean in control group was 0.53 ± 0.088. The mean ADC ranged from 0.612 to 2.02 with mean of 1.28 ± 0.427 x 10 −3 mm2/s (Figures 4 and 5), whereas the mean in control group was 1.03 ± 0.24. There was statistically no significant difference in the diseased and control group of FA and ADC with a p-value of 0.15 and 0.08 respectively (t-test, as the data were normally distributed). ROC curves were drawn and area under the graph for FA and ADC is 0.878 and 0.787 respectively (Figure 6). The cut-off obtained for FA to detect neuropathy was 0.4835. Value lower than 0.4835 would signify neuropathy with sensitivity of 90.28%, specificity of 80%, negative predictive value of 97.01% and positive predictive value of 53.33%. The cut-off obtained for ADC to detect neuropathy was 1.1020 × 10 −3 mm2/s. Value lower than 1.1020 × 10 −3 mm2/s would signify neuropathy with sensitivity of 84.72%, specificity of 70%, negative predictive value of 95.31% and positive predictive value of 38.89%. The comparative values of study and control group are described in Table 2.
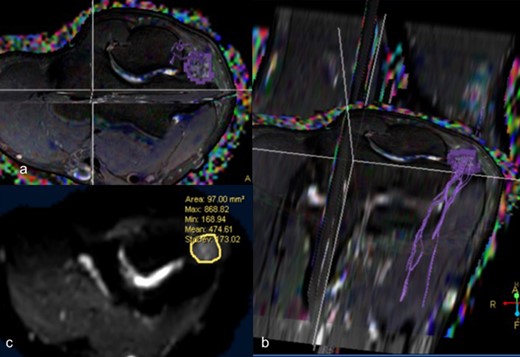
DTI –T2 weighted axial (a) and coronal reformatted (b) images depicting fibers of ulnar nerve at the cubital tunnel (c) Diffusion weighted axial image depicting mean cross-sectional area of 97 mm2 with mean FA of 0.407 and mean ADC of 1.145 × 10⁻³ mm2 /s. ADC, apparent diffusion coefficient; DTI, diffusion tensor imaging; FA, fractional anisotropy.
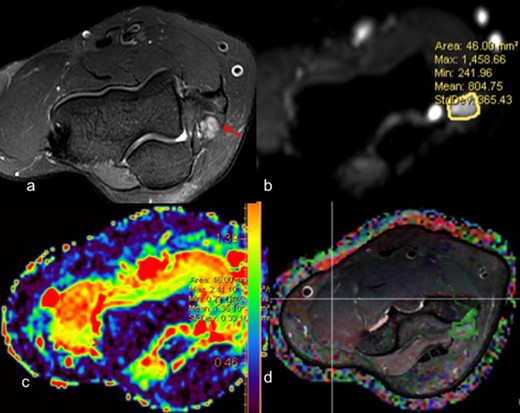
(a)T2 weighted axial fat suppressed image depicts thickening and altered signal intensity of ulnar nerve at the cubital tunnel ; (b) Diffusion-weighted image showing mean cross-sectional area of 46 mm2 with mean FA of 0.59 (c) Corresponding ADC map showing mean ADC of 0.79 × 10⁻³ mm2/s ; (d) DTI images showing fibers of ulnar nerve at cubital tunnel coded in green color. ADC, apparent diffusion coefficient; DTI, diffusion tensor imaging; FA, fractional anisotropy.
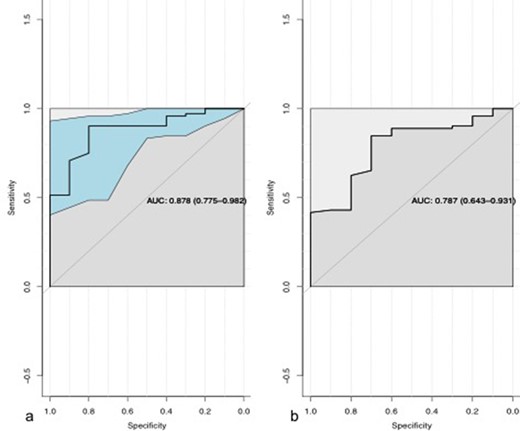
ROC curves of FA (a) and ADC (b). ADC, apparent diffusion coefficient; AUC, area under the curve; FA, fractional anisotropy.
Discussion
Leprosy is a chronic granulomatous disease which is associated with grave disabilities and deformities. Early detection of peripheral neuropathy is important as leprosy is one of the treatable causes of peripheral neuropathy in our country.16 Clinical examination and neurophysiological studies form an important part of the diagnostic protocol in leprosy. Radiological imaging has emerged as an important complementary tool as the neurophysiological studies do not provide spatial information of the nerve. Earlier high-resolution ultrasound was the only imaging modality used for this purpose. However, with advancements in MRI, MR neurography is emerging as the modality of choice for diagnosing peripheral neuropathies.
Magnetic resonance DTI has been mostly utilized for assessing the white matter tracts of the brain. An emerging application of DTI is in tracking the peripheral nerves in few of the recent studies. It acts as a tool of functional imaging for assessing changes of denervation or renervation. DTI has also emerged as an important complementary tool for diagnosis of peripheral neuropathy. Both FA and ADC values can be generated by DTI. Reduced FA values and increased ADC values indicate nerve pathology. In addition, repeated measurements of these two parameters can be done on serial post treatment MR scans to objectively assess for degree of renervation.
Normal nerves show directional diffusion unlike other soft tissues, thereby having high FA values. Few studies in the past have found the FA values in normal nerves to be in the range of 0.5–0.8. A study by Kabakciet al in 2007 found normal value of FA of median nerve in 20 healthy volunteers as 0.709 ± 0.046 (SD) and an ADC of 1.016 ± 0.129 ×10⁻³ mm2/s.15 Another study by Jambawalikar et al in 2010 found FA of ulnar nerve of 10 healthy volunteers to be 0.752 ± 0.067 and the ADC to be 0.96 ± 0.13 × 10⁻³ mm2/s.12Values lower than this suggest myelin disruption/demyelination, hence value of FA drops and that of ADC rises in pathological nerves. Most of the studies done on DTI have been done on the median nerve at the level of carpal tunnel or in peripheral nerve tumors.17–20
First study of DTI on peripheral nerve was conducted by Skorpil et al on sciatic nerve.21 A recent study by Baumer et al shows detection of subclinical ulnar neuropathy in retrocondylar groove by DTI.22
We undertook this study to evaluate the role of DTI (both FA and ADC) in ulnar nerve in leprosy patients. The role of DTI has mainly been studied in compressive neuropathies. Few recent studies have evaluated the role of DTI in systemic diseases23–25 and in peripheral nerve tumors.26 Literature search showed DTI was performed in single case of pure Neuritic Leprosy by Colonna et al in 2016.27 Fiber tracking was done in right median nerve and they found rearranging fibers with small focal abnormalities below elbow which they suggested as a possible sign of nerve remyelination. They suggested that it can be a useful tool to get information about the evolution of the disease and surgical indications.
Our study is unique and first to evaluate quantitative information in the form of FA and ADC values in leprosy-related ulnar neuropathy. On basic MR sequences, abnormal T2 signal and increase in cross-sectional area was demonstrated in all abnormal ulnar nerves in our study, at the level of elbow in cubital tunnel. Ancillary findings of local lymph nodes, other nerve involvement and secondary denervation was also seen in few cases. Reduced FA and raised ADC values were found on DTI in all the affected nerves which showed reduced or absent nerve conduction velocity at the same level. There was no statistically significant difference in FA and ADC values in the patient and control group. Best cut-off values obtained for FA is 0.4835 and that of ADC is1.1020 × 10 −3 mm2/s at fairly high sensitivity and specificity.
A recent study by Edward et al in 2020, evaluated the role of DTI in diabetic neuropathy and obtained statistically significant difference between FA values of patients and healthy volunteers. Also they obtained cut-off of FA and ADC as 0.45 and 1.217 with sensitivity and specificity of over 80%.23
Another similar study evaluating the role of DTI in brachial plexus lesions, authored by Hassan et al in 2018 also showed statistically significant difference in FA and ADC values between diseased and normal sides.28
Another study on DTI done by Nesilahan et al showed statistically significant decrease in FA value focally at the level of carpal tunnel in carpal tunnel syndrome (CTS), and throughout the nerve as well in case of severe CTS.29 The cut-off value of FA was 0.554 for focal carpal tunnel (sensitivity, 80%; specificity, 80%) and 0.660 for whole nerve (sensitivity, 82%; specificity, 80%). No statistically significant difference was seen in ADC value.
DTI provides quantitative information in the form of FA/ADC values and gives qualitative information in the form of tractography images where the integrity and direction of nerve fibers can be well illustrated. However, due to small caliber of the peripheral nerves, poor contrast resolution from adjacent vessels and long duration of scan resulting in motion artifact, DTI is still a challenge.
There were few limitations of our study. We did not evaluate the utility of DTI in the diagnosis of neuropathy as only patients with diagnosed neuropathy on nerve conduction studies were recruited. The aim was only to look at the DTI findings in ulnar neuropathy in patients with leprosy. In this study, we took only single time parameter assessment in account. A repeat measurement of FA and ADC post-treatment and further comparison with nerve conduction study, would be worthwhile to establish the role of DTI in determining renervation or denervation changes. Lack of longitudinal examination of neuropathy on MR neurography was one of the limitation of our study. Also, the long duration of the MR study due to inclusion of both elbows was uncomfortable for patients.
Conclusion
DTI though challenging in peripheral nerves, is proving to be a powerful complementary tool for assessment of peripheral neuropathy. Our study, like the previous studies, also validates its utility in addition to basic MR neurography in infective neuropathies. The current literature has no data evaluating the role of DTI and DWI of Hansen disease of ulnar nerve and the role of ADC value and FA is not defined.
We thank all the technician of Department of NMR, AIIMS, NewDelhi.
This study was supported by a grant from Indian council of Medical Research, New Delhi, India (File.ECD/Adhoc/Lep./2014-2887/FY14-15/23/Delhi/Govt).
Patient consent was taken in all cases
The study was performed after taking approval from Institute Ethics committee
Ankita Aggarwal and Chandan Jyoti Das have contributed equally to this study and should be considered as co-first authors.
REFERENCES
