


To investigate the interobserver reproducibility of contrast-enhanced ultrasound (CEUS) in patients with diabetic nephropathy.
A total of 40 patients with diabetic nephropathy were enrolled in this retrospective study. We measured peak intensity (PEAK), time-to-peak (TP), area under the curve (AUC) and mean transit time (MTT) of renal CEUS in each patient. Each parameter was performed by two independent observers. The interobserver reproducibility was assessed using intraclass correlation coefficients (ICCs) with 95% confidence intervals (CIs) and Bland–Altman plots by mean difference with 95% limits of agreement (LOAs).
The parameters of the left and right kidneys showed moderate or good reliability. The best was the left kidney AUC parameters (ICC,0.945),with a 95% CI of 0.896–0.971.The Bland–Altman plots showed that the mean differences between the right renal parameters (PEAK, TP, AUC and MTT) obtained between the observers 1 and 2 were −6.63%,2.54%,−11.30%,−2.22%, and the 95% LOAs are −30.78 to 17.52%, −30.15 to 35.23%, −43.95 to 21.35%, −44.50 to 40.06%. While the left ones were −2.89%, 0.32%, −8.26%, 1.25% , and the 95% LOAs were −38.50 to 32.72%, −31.98 to 32.62%, −57.89 to 41.37%, −37.21 to 39.71%, respectively.
Quantitative CEUS can show good interobserver reproducibility, which is better for the right kidney. It seems necessary to establish standardized techniques for obtaining contrast-enhanced quantitative analysis of renal blood perfusion.
Quantitative assessment of renal perfusion by CEUS in patients with diabetic nephropathy provides diagnostic information. Furthermore, renal perfusion assessment in patients with diabetic nephropathy using CEUS has good reproducibility.
Introduction
Diabetic nephropathy is one of the most common complications of diabetes; the prevalence rate has increased dramatically with the prevalence of diabetes.1 And, it is a typical type of chronic nephropathy, and has become a major cause of end-stage nephropathy. Its typical features are normal nephron loss, fibroblast and myofibroblast proliferation, extracellular matrix protein accumulation, Kimmelstiel–Wilson nodule formation, basement membrane thickening and tubular fibrosis.2 These typical lesions cause microvascular changes in diabetics, leading to dysfunction of the various cells of the kidneys and eventually progressive kidney failure.3 The evaluation of blood perfusion in chronic nephropathy is of great clinical significance. Especially in the early stage of chronic nephropathy, early diagnosis, intervention and treatment are carried out to affect the outcome of the disease. Conventional ultrasound has limited ability to explore microvascular lesions, but with the innovation and development of ultrasound technology, the emergence of ultrasound technology has a further role. Using ultrasound microbubbles to enhance the scattering in the blood, the contrast agent can enter the organs and tissues with the blood flow, so as to enhance its development, which can more effectively evaluate the renal blood flow in the patients with diabetic nephropathy. The initial stages of diabetic nephropathy can be ascribed to dysfunctions of glomerular capillaries, which clinically manifest as hyperfiltration and microalbuminuria.4,5
Renal biopsy is the gold-standard for determining whether the kidney has abnormal perfusion, invasive lesions and histological procedure, but it is an invasive diagnostic method. MRI can also be used to measure renal perfusion, but the nephrotoxicity of gadolinium contrast agent is its limitation. The diagnosis of contrast-enhanced ultrasound is non-invasive, and the contrast agent is excreted by the lung after liver metabolism, which will not cause kidney burden.6 Doppler can reflect the characteristics of blood perfusion in chronic kidney disease by using the parameters such as blood flow velocity and resistance index of internal renal artery indirectly. While CEUS dynamically shows the microcirculation perfusion of renal parenchyma through contrast medium. The signal intensity of contrast-enhanced ultrasound is related to the microbubble concentration of contrast medium, while the microbubble concentration is related to tissue blood perfusion. CEUS has been widely used in kidney diseases including cancer, vascular diseases, and kidney transplantation.7,8 Previous studies have identified the advantages of CEUS in diagnosis and evaluation of renal microvascular injuries in patients with chronic kidney disease.9 Despite the advantages of CEUS, there are few studies on the stability of its quantitative assessment.
Therefore, the purpose of this study is to investigate the interobserver reproducibility of CEUS in patients with diabetic nephropathy.
Methods and materials
Patients
The Institutional Review Board of Chinese PLA General Hospital approved this retrospective study. All the patients were provided written information consent before CEUS.
The study population consisted of patients scheduled to undergo a diagnostic renal puncture. All the enrolled patients fulfilled these inclusion criteria: (1)qadult patients older than 18 years of age; (2)the patient underwent CEUS examination before the renal puncture; (3)with no malignant nodules or giant cysts and no severe cardiovascular or cerebral vascular disease, severe pulmonary disease; (4)patients with abnormal renal function. Exclusion criteria were: (1)the blood pressure before the CEUS was above 140/90 mmHg. (2)The patient’s breath can not be matched with CEUS. (3)Combined with urinary tract infection and other acute infectious diseases. (4)Renal pathology is not diabetic nephropathy. (5)Pregnant females, and patients with prior kidney biopsy or surgery.
From October 2018 to December 2019, 60 patients were included as the study subjects. After the renal puncture pathological results came out, 43 patients were diabetic nephropathy patients, and 3 of them were excluded who were not satisfied with the image acquisition. Finally, 40 diabetic nephropathy patients were enrolled in the group. A flowchart of study inclusion and exclusion criteria is provided in Figure 1.
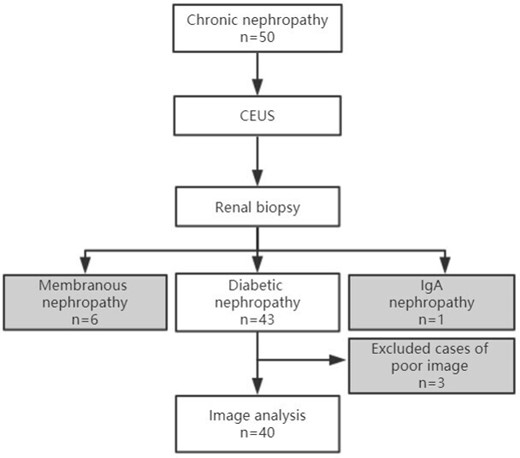
:Study flowchart. CEUS, contrast-enhanced ultrasound.
CEUS assessment
Before examination, individuals had blood pressure controlled below 140/90 mmHg, and above 100/60 mmHg. During the ultrasound examination, an ultrasound instrument (Siemens, S2000, Germany) was used, using a convex multifrequency transducer (4–6 MHz). Both right and left side of kidneys were scanned by conventional ultrasound sequentially; first for the right kidney, and after a time interval for about 20 min, the same CEUS procedure was performed for the left kidney; the ultrasound was oriented at the largest section of kidneys and the renal cortex area; Sulphur hexafluoride (Sono Vue, Bracco, Italy) was used as ultrasound contrast agent: 0.5 ml of the agent was injected, followed by a flush of 5 ml 0.9% sodium chloride solution. The signal changes from kidneys were observed for 180 s, and the images were perserved in the meantime.
Two physicians (Observer A, Li with more than 10 year experience in renal ultrasound and CEUS; Observer B, Tian with 3 year experience in renal ultrasound and CEUS) separately performed CEUS examination and analyzed the images of diabetic nephropathy patients. They were trained to use an identical protocol. Each observer performed analysis of the CEUS parameters only once. Observer A proceeded to analyze the images. Then, Observer B performed the same procedure without observing the results of the former.
In order to obtain the video images of CEUS more accurately, the region of interest (ROI) was placed in the longitudinal section, and the focus was positioned behind the kidney to make microbubbles display more obvious. For statistical analysis, three regions of interest were selected in the renal cortex (Figure 2a) during image analysis. By Dynamics software analysis, four parameters are given as Peak (Peak intensity),TP (Time-to-peak), AUC (Area under curve) and MTT (Mean transit time) (Figure 2b). Interobserver reproducibility was assessed by calculating ICCs. We established Bland–Altman plots and performed the consistency test. The significance level used in this study was p < 0.05 (α = 5%) with a CIs of 95%.
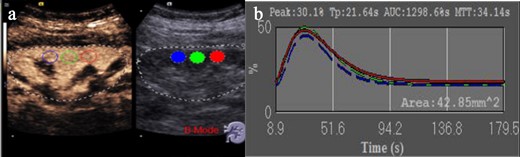
Quantitative analysis of CEUS. (a) CEUS image acquisition and frame selection of three ROI regions, which are in the renal cortex. (b) Contrast-enhanced ultrasound parameters in three regions of interest, including peak renal TP, PEAK, MTT, and the AUC. AUC, area under the curve; CEUS, contrast-enhanced ultrasound; MTT, mean transit time; PEAK, peak intensity; TP, parenchyma time.
Statistical analysis
Statistical analysis was performed using the SPSS statistical software (v. 21.0). Continuous data were expressed as mean ± SD (range). The interobserver reliability was assessed using intraclass correlation coefficient (ICC) with 95% confidence intervals (CIs) and Bland–Altman analysis. ICC was based on absolute agreement, two-way random effects model, and it reflects the ratio between real and total variability. A high measurement reproducibility is indicated by an ICC near 1.00 where the variability is only due to the between subject variance. Based on the 95% confident interval of the ICC estimate, values less than 0.5, between 0.5 and 0.75, between 0.75 and 0.9, and greater than 0.90 are indicative of poor, moderate, good, and excellent reliability, respectively.10 Bland–Altman analysis was expressed as the mean difference with 95% limits-of-agreement (LOA, mean difference ±1.96 SD). A difference with p < 0.05 was considered as statistically significant.
Results
The 40 patients included 12 women and 28 men with a mean age of 54.6 years (range, 36–70 years). The characteristics of the patients are shown in Table 1.
Baseline characteristics of the 40 patients with diabetic nephropathy
| Parameters | Mean ± SD |
|---|---|
| Age (years) | 54.6 ± 9.4 |
| Male/Female | 28/12 |
| BMI (kg/m2) | 26.60 ± 3.68 |
| HbA1c (%) | 7.39 ± 1.53 |
| BUN (mmol/L) | 9.95 ± 3.62 |
| Serum Creatinine (mmol/L) | 176.27 ± 108.64 |
| Urine Creatinine (mmol/L) | 5.29 ± 2.32 |
| Parameters | Mean ± SD |
|---|---|
| Age (years) | 54.6 ± 9.4 |
| Male/Female | 28/12 |
| BMI (kg/m2) | 26.60 ± 3.68 |
| HbA1c (%) | 7.39 ± 1.53 |
| BUN (mmol/L) | 9.95 ± 3.62 |
| Serum Creatinine (mmol/L) | 176.27 ± 108.64 |
| Urine Creatinine (mmol/L) | 5.29 ± 2.32 |
Means and SDs of the CEUS parameters obtained by observers 1 and 2 are summarized in Table 2.
CEUS parameters obtained by observer 1 and 2
| Right kidney | Left kidney | |||
|---|---|---|---|---|
| Observer 1 | Observer 2 | Observer 1 | Observer 2 | |
| PEAK (%) | 21.84 ± 5.48 | 23.29 ± 5.60 | 22.82 ± 7.12 | 23.31 ± 6.74 |
| TP (s) | 20.01 ± 5.94 | 19.38 ± 5.11 | 21.10 ± 5.81 | 21.21 ± 5.74 |
| AUC (%s) | 1639.10 ± 607.27 | 1804.96 ± 626.15 | 2014.09 ± 902.12 | 2112.90 ± 810.17 |
| MTT (s) | 53.33 ± 14.10 | 54.76 ± 15.58 | 55.80 ± 13.90 | 55.06 ± 13.89 |
The consistency of the left kidney is slightly better than that of the right kidney. The repeatability is judged by calculating the ICCs and 95% CIs, which are showed in Table 3.
The ICCs, 95% CIs and Bland-Altman plot analysis obtained by observer 1 and 2
| ICC | 95% CIs | Mean ± SD(%) | 95% LOA(%) | |
|---|---|---|---|---|
| RPEAK | 0.914 | 0.836–0.954 | −6.63 ± 12.32 | −30.78 ~ 17.52 |
| RTP | 0.881 | 0.775–0.937 | 2.54 ± 16.68 | −30.15 ~ 35.23 |
| RAUC | 0.941 | 0.889–0.969 | −11.30 ± 16.66 | −43.95 ~ 21.35 |
| RMTT | 0.841 | 0.699–0.916 | −2.22 ± 21.57 | −44.50 ~ 40.06 |
| LPEAK | 0.918 | 0.844–0.956 | −2.89 ± 18.17 | −38.50 ~ 32.72 |
| LTP | 0.872 | 0.759–0.933 | 0.32 ± 16.48 | −31.98 ~ 32.62 |
| LAUC | 0.914 | 0.896–0.971 | −8.26 ± 25.32 | −57.89 ~ 41.37 |
| LMTT | 0.879 | 0.771–0.936 | 1.25 ± 19.62 | −37.21 ~ 39.71 |
According to the Bland–Altman plot analysis, the mean differences ± standard deviation between the right and left renal parameters (PEAK, TP, AUC and MTT) obtained between the observers 1 and 2 were showed in Table 3. And, the Bland–Altman plot are showed in Figures 3 and 4.
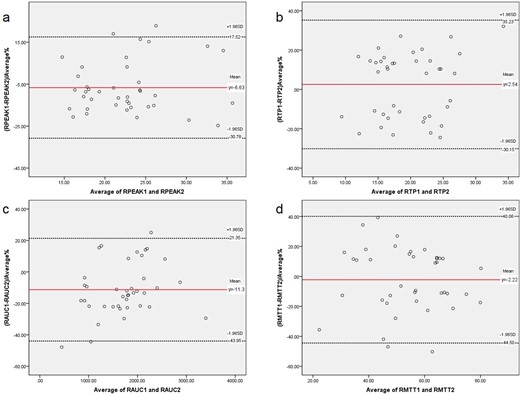
Bland–Altman plots of the differences between the right Contrast-enhanced ultrasound parameters obtained by observers 1 and 2 (y-axis) and the mean of the parameters (x-axis). a. RPEAK; b. RTP; c. RAUC; d. RMTT. The red solid line indicates the mean value of all measurements (n = 40), and black dotted lines denote 95% LOA (mean ± 1.96 SDs). AUC, area under the curve; CEUS, contrast-enhanced ultrasound; LOA, limits-of-agreement; MTT, mean transit time; PEAK, peak intensity; TP, parenchyma time.
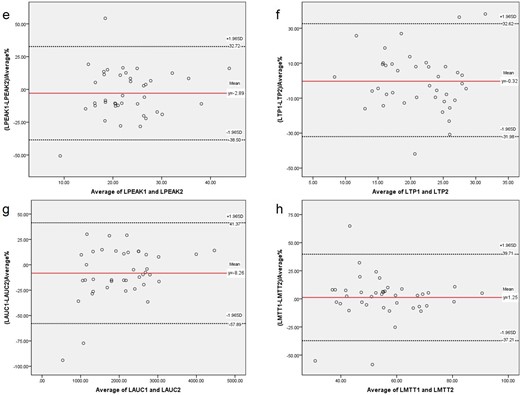
Bland–Altman plots of the differences between the left. Contrast-enhanced ultrasound parameters obtained by examiners 1 and 2 (y-axis) and the mean of the parameters (x-axis). e. LPEAK; f. LTP; g. LAUC; h. LMTT. The red solid line indicates the mean value of all measurements (n = 40), and black dotted lines denote 95% LOA (mean ± 1.96 SDs). AUC, area under the curve; CEUS, contrast-enhanced ultrasound; LOA, limits-of-agreement; MTT, mean transit time; PEAK, peak intensity; TP, parenchyma time.
All the patients were tolerable to the CEUS procedure. No side-effects or complications occurred during or after CEUS.
Discussion
Renal blood perfusion is an important index of clinical concern.11 Verzola12 pointed out the correlation between the renal microvascular injury and the magnitude of tubulointerstitial fibrosis in Type II diabetic nephropathy, and renal microvascular injury had a significant impact on renal disease progression. Moreover, Cankurtaran13 noted that evaluation of retinal microcirculation may help detect early changes related to microvascular complications in Type II diabetic patients. Therefore, diabetic nephropathy is primarily the involvement of microvascular injury. If microcirculation changes are detected early, it is helpful for the early diagnosis of diabetic nephropathy.
Although CT and MRI were also able to assess renal blood perfusion, the conventional application of CT was limited because of its ionizing radiation and nephrotoxic contrast agents, while MRI was more expensive to examine and had longer acquisition time. Doppler ultrasound can visualize most of the blood vessels in the kidney, but the imaging ability of the fine blood vessels is weak. As a new technique in recent years, CEUS can achieve a relatively small vascular structure, which can produce resonance at a certain rate of evaluation and enhance the resolution of the image.14–16 The imaging ability of the tiny blood vessels in the kidney with abundant blood vessels is improving gradually, which can evaluate the perfusion of the kidney macroscopically. Dong17 et al used CEUS to examine patients with diabetic nephropathy was helpful for early diagnosis, and considered that the imaging parameters AUC and DPI (peak intensity) were of certain value. Wang et al.18 suggested that renal microvascular perfusion was associated with clinical serum laboratory tests, especially in patients with hyperuricemia.
In addition, the safety of contrast agent is more reliable. It can be used in diagnosis by cavitation in human body,19 and be excreted through respiration. Since there is no nephrotoxicity, the assessment of changes in renal perfusion in patients with renal dysfunction leads to a feasible imaging diagnostic pathway. At present, no particularly serious complications of contrast agents have been found, and it can even be used to diagnose the disease of pregnant females.20
The CEUS of acute kidney injury is more intuitive for the examiner,21many scholars have done research on CEUS. Jin et al22 use CEUS to predict the possibility of acute rejection in kidney transplantation, and RT (rising time) and TP are regarded as sensitive indexes of perfusion in the transplant kidney, which also have good repeatability. The similar results were also found in this study, we included more parameters. But what about the repeatability of CEUS for chronic kidney disease? The results of this study on the four parameters of renal CEUS showed moderate to good reproducibility by 95% CIs. A comparison between the Bland–Altman plots of the parameters obtained by CEUS on the right and left corroborates the finding of greater interobserver agreement for left compared to right kidney measurements. This slight difference in interobserver variability between left and right renal parameters (good reproducibility: RAUC, RPEAK, RTP, LAUC, LPEAK, LTP, LMTT; moderate reproducibility: RMTT) may be explained by the anatomic features. The left kidney is larger than the right kidney,23 which makes the left kidney have more areas of interest to choose from at the same resolution. Moreover, the right kidney is more likely to be affected by contrast agents from the liver. The quantitative analysis of CEUS plays a more important role in chronic kidney diseases, which can be used to reflect relatively small differences. In addition, Bland–Altman method is used to analyze for consistency test in this study, and it is found that 2–3 points of some parameters fall outside the LOA. The incidence of exceeding the upper and lower limits was 2.5% ~ 5% (acceptable limit 5%). The incidence of LTP and LMTT exceeding the upper and lower limits was 7.5%, which needs to be fully compared in combination with specific clinical allowable errors. This will be the next research plan and will be further analyzed after expanding the sample size.
This study proved that the quantitative analysis of CEUS can evaluate the blood perfusion of diabetic nephropathy patients more stably, and can provide help for clinical diagnosis. Fioretto et al.24 conducted a 5–10-year follow-up study of diabetic nephropathy patients with PTA (pancreatic transplantation), found that glomerular lesions significantly improved after 10 years, suggesting that diabetic nephropathy is likely to be reversed, while CEUS, using its nephrotoxicity-free and quantitatively assessing the characteristics of renal blood flow, can be used as a means to assess the recovery of postoperative nephropathy in patients with PTA. So, quantitative CEUS can help judge the subtle outcome of renal blood flow in patients with diabetic nephropathy based on the degree of variation of its value.
Although different ultrasound instruments and different doses of contrast agent can affect the parameters of CEUS, examinations at different times in the same patient will give a comparison. Perhaps in the near future, it could give the corresponding range of reference values on different ultrasound instruments, as in the laboratory tests.
The limitation of the study was its relatively small sample size. There are relatively few patients who perform renal biopsy due to chronic kidney disease. More case collections would be helpful in this study. Besides, this study is limited to the same kind of ultrasound instrument. The consistency analysis among different ultrasonic instruments needs further study.
Our study shows that CEUS parameter evaluation has good interobserver reproducibility. CEUS parameter evaluation can be used as a reliable indicator of renal microvascular perfusion with some stability. With the continuous development of contrast-enhanced microbubbles and the development of more analytical software technology, it provides a broader application platform for further dynamic study of renal microvascular perfusion.
This study was supported by the Beijing Science and Technology Major Project of China(no.D17110700280000, D171100002817006), the Open Project Program of the State Key Laboratory of Kidney Diseases in PLA General Hospital (no.KF2018-13), the National Natural Science Fund of China (no.81700629).
The authors Lin Lin and Yiru Wang contributed equally to the work.
REFERENCES
