


Summary
The Hyperhidrosis Quality of Life Index (HidroQoL©) is a validated patient‐reported outcome measure capturing the quality of life of people affected by hyperhidrosis.
We aimed to extend the validity evidence to physician‐confirmed diagnosis of primary axillary hyperhidrosis.
Data from a phase III randomized placebo‐controlled clinical trial were used (n = 171). Confirmatory factor analysis was carried out to confirm the a priori two‐factor structure of the HidroQoL. Internal consistency was assessed using Cronbach’s α. Intraclass correlation coefficients (ICCs) were calculated to evaluate test–retest reliability after days –7 to –4. Convergent validity was assessed using correlations with the Dermatology Life Quality Index (DLQI), the Hyperhidrosis Disease Severity Scale (HDSS) and gravimetric sweat production. Known groups were analysed to evaluate discriminative validity. Responsiveness after 29 days was assessed and minimal important difference (MID) values were calculated using both anchor‐ and distribution‐based approaches. All analyses were carried out for total HidroQoL and its two domains.
The two‐factor structure of the HidroQoL was confirmed. Internal consistency and test–retest reliability were strong (Cronbach’s α 0·81–0·90; ICCs 0·89–0·93). Correlations with other outcome measures were in line with a priori hypotheses. The HidroQoL discriminated between different severity groups (P ≤ 0·001) and showed sensitivity to change towards improvement (P < 0·001). An MID value of 4 is proposed for the total scale.
This study supports excellent measurement properties including clinical applicability of the HidroQoL in primary axillary hyperhidrosis and suggests a MID of 4 be applied to clinical trial data.
Hyperhidrosis is a disorder of the autonomic nervous system that is characterized by excessive sweating beyond physiological needs. It is classified as either primary, due to a sympathetic dysregulation leading to disproportionate sweating, or secondary, as a result of an underlying medical condition or the use of prescription medications.1 Primary hyperhidrosis can be generalized or focal, whereby focal hyperhidrosis is typically symmetrically localized to the axillae (axillary hyperhidrosis), hands and feet (palmar and plantar hyperhidrosis), but may also involve other areas of the body, such as the face (craniofacial hyperhidrosis).2, 3 In the USA, a prevalence of 2·8% was reported, of which around half have axillary hyperhidrosis.4 In another study in Germany, the prevalence was 16·3% including 6·1% of patients with frequent or continuous disturbing sweating.5 It ranges in severity from being a little bit damp to extreme dripping. Therefore, hyperhidrosis can substantially impair the quality of life (QoL) of affected patients, such as limitations in daily activities, social relationships, study and work, life and emotional well‐being.1, 6, 7
To measure QoL, patient‐reported outcome measures (PROMs), which means self‐completed questionnaires, are used in clinical trials to reflect the patient’s perspective.8 Several PROMs capturing the perspective of patients with hyperhidrosis have been identified in a review,2 such as the Hyperhidrosis Quality of Life Questionnaire (HQLQ),9 the Hyperhidrosis Impact Questionnaire (HHIQ),10 the Hyperhidrosis Questionnaire (HQ)11 and the Hyperhidrosis Quality of Life Index (HidroQoL©).12, 13 In this review, the HidroQoL was the preferred instrument by a small group of patients with moderate‐to‐severe hyperhidrosis as it covered everything important and was easy to complete.2
The HidroQoL assesses QoL impacts in hyperhidrosis. With 18 items on two domains, it is a short, but comprehensive measure. The first domain with six items refers to daily life activities and the second domain with 12 items covers the psychosocial life of the patients (Figure 1). Each item has three response options (no, not at all = 0; a little = 1; very much = 2), with a total score range from 0 to 36. The recall period is 7 days. It was developed recently by a group of researchers in the UK. Patients with self‐reported hyperhidrosis (different types) were involved in the item elicitation.7 In its initial validation, it showed evidence for excellent measurement properties (structural validity, internal consistency, test–retest reliability, construct validity and responsiveness) and its use in both routine clinical practice and in research for the assessment of QoL impacts in different types of self‐reported hyperhidrosis. Furthermore, minimal important difference (MID) values for the total HidroQoL were established.12, 13
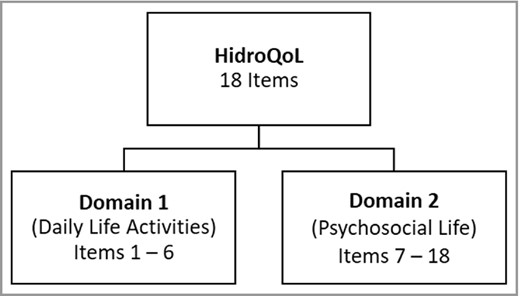
Composition of the Hyperhidrosis Quality of Life Index (HidroQoL).
The aims of this study were (i) to evaluate the psychometric properties of the HidroQoL in patients with physician‐confirmed primary hyperhidrosis, thus extending the initial validity evidence generated by Kamudoni et al.;13 and (ii) to examine the clinical application as well as establish the MID threshold of the HidroQoL in this population.
Patients and Methods
Patients with severe primary axillary hyperhidrosis were asked to complete the HidroQoL four times during the phase III randomized placebo‐controlled part of a clinical trial investigating the effects of a topical cream containing 1% glycopyrronium bromide. The safety and efficacy of this topical cream was reported recently.14 The study was registered (ClinicalTrials.gov identifier: NCT03658616) and ethical approval was given by the corresponding ethics committees of the different countries.
A translation office produced seven linguistically validated versions of the HidroQoL. Cognitive debriefing interviews with a representative sample of the target population revealed that items were easily understood by the participants, which supported conceptual and linguistic equivalence as well as cultural appropriateness.
The phase III trial was multicentre (n = 34) and multicountry (Germany, Austria, Poland, Hungary, UK, Sweden and Denmark). Data were collected using the HidroQoL, the Hyperhidrosis Disease Severity Scale (HDSS) and the Dermatology Life Quality Index (DLQI). The HDSS is a scale for the assessment of disease severity and daily life impairment in patients with hyperhidrosis. It is a single item asking the patient to rate the severity of their hyperhidrosis on a four‐point scale.4, 15 The DLQI consists of 10 questions concerning patients’ perception of the impact of skin diseases on aspects of their QoL over the last week.16 It is the most frequently used PROM in randomized controlled trials (RCTs) in dermatology. In addition, gravimetric sweat production was measured in milligrams for a duration of 5 min according to an internal standard operating procedure/manual and as already performed in the previous trial.14 Data of the HidroQoL and the HDSS were collected at all four timepoints [days –7 to –4 (screening), day 1 (baseline), day 15 and day 29], DLQI data were collected from day 1 to day 29 and gravimetric sweat production was assessed at screening, baseline and day 29 (Figure 2). The study was sponsored by Dr. August Wolff GmbH & Co. KG Arzneimittel.
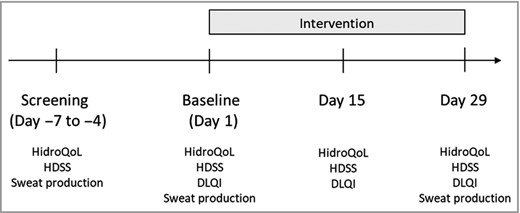
Data collection. DLQI, Dermatology Life Quality Index; HDSS, Hyperhidrosis Disease Severity Scale; HidroQoL, Hyperhidrosis Quality of Life Index.
Data analysis
Psychometric analyses were performed to evaluate structural validity, internal consistency, test–retest reliability, construct validity, responsiveness (ability to detect change over time) and MID values. All statistical analyses were performed using SAS 9·4 and IBM SPSS Statistics 25·0.
Structural validity
A confirmatory factor analysis (CFA) was carried out at screening (days –7 to –4) to confirm the two‐factor structure of the HidroQoL in the current study population. The following goodness‐of‐fit indices were used: comparative fit index ≥ 0·95, root mean square error of approximation < 0·08, standardized root mean square residual < 0·08 and Chi square/degrees of freedom ratio (χ2/df) < 3 (see Table 1).17–19
Goodness‐of‐fit indices for the HidroQoL (n = 169)
| Goodness‐of‐fit index | Acceptable model fit | HidroQoL | |
| CFI | Comparative fit index | ≥ 0·95 | 0·815 |
| RMSEA | Root mean square error of approximation | < 0·08 | 0·084 (90% CI 0·071–0·097) |
| SRMR | Standardized root mean square residual | < 0·08 | 0·074 |
| χ2/df | Chi squared/degrees of freedom ratio | < 3 | 2·179 |
CI, confidence interval; HidroQoL, Hyperhidrosis Quality of Life Index
Internal consistency
Cronbach’s α was calculated for the HidroQoL total and the two domain scales. Cronbach’s α ≥ 0·7 was considered to be appropriate.19
Test–retest reliability
Patients were classified as stable when they had no change in their HDSS score. Test–retest reliability was assessed twice, once before the intervention was started (from screening to baseline) and once when the intervention had started (from baseline to day 15). Intraclass correlation coefficients (ICCs) with 95% confidence intervals (CIs) were calculated. An ICC ≥ 0·7 was considered to be acceptable.19
Convergent and discriminant validity
We assumed that our PROM validly measures the construct to be measured, which is hyperhidrosis‐specific QoL. This was evaluated by estimating the magnitude of correlations with the DLQI, HDSS and the gravimetric sweat production at baseline. We formulated a priori hypotheses and expected Spearman rank correlations with the DLQI ≥ 0·5 because both instruments measure a similar construct, namely health‐related QoL. The HDSS measures severity, which is a related, but dissimilar construct to health‐related QoL. We expected correlations of between 0·3 and 0·5. The gravimetric sweat production was classified as an objective measure and, therefore, an unrelated construct, and correlations were expected to be low (< 0·3).
Known‐groups validity
We assessed whether there were differences in the HidroQoL scores between clinically or demographically distinct groups, i.e. sex, age categories and disease severity, at baseline. We did not expect any differences between male and female patients and between different age categories (18–29, 30–39, 40–49, 50–59, ≥ 60 years). However, we expected significant differences between different severity levels according to the HDSS. A Mann–Whitney U‐test and Kruskal–Wallis one‐way anova were carried out.
Responsiveness
The HidroQoL’s responsiveness was assessed using two alternative approaches, including (i) a comparison of scores across patients according to change in HDSS scores before and after the intervention; and (ii) a correlation of the HidroQoL scores against corresponding HDSS and DLQI change scores and change in the gravimetric sweat production.
Firstly, we compared HidroQoL scores before and after the intervention. The HDSS change score after day 29 served as an anchor. In order to see if the anchor could be considered appropriate, the HDSS change score was correlated with the HidroQoL change scores and a correlation > 0·3 was considered to be appropriate.20 Afterwards, patients were grouped according to the anchor. A Kruskal–Wallis test over all HDSS change score groups was carried out and we expected those groups to significantly differ from each other in their HidroQoL scores. Furthermore, scores before and after the intervention were compared using nonparametric Wilcoxon matched‐pair tests (because the data were not normally distributed). A significant improvement in QoL scores for the improving conditions (where HDSS improved) was expected. Finally, effect sizes were calculated to define the magnitude of those effects (r = Z/√N; with r < 0·3: small, 0·3 < r < 0·5: moderate, r > 0·5: large effect).
Secondly, the HidroQoL change scores were compared with other outcome measurement instruments. The HidroQoL change scores were correlated with other outcome measure change scores (again HDSS, DLQI and gravimetric sweat production) using the Spearman rank correlation coefficient. The following a priori hypotheses were tested:
Correlations with changes in instruments measuring similar constructs (DLQI) should be ≥ 0·5.
Correlations with changes in instruments measuring related, but dissimilar constructs (HDSS) should be lower (between 0·5 and 0·3).
Correlations with changes in instruments measuring unrelated constructs (gravimetric sweat production) should be < 0·3.
Estimation of minimal important difference
MID is the smallest difference in scores that patients perceive as beneficial.21 It can be seen as a threshold and any change greater than this threshold can be interpreted to be clinically meaningful.22 We used three approaches to define MID values: an anchor‐based approach, a distribution‐based approach and an integration of both.
Using the anchor‐based approach, the HDSS and the DLQI served as anchors because their change scores had shown an acceptable correlation with the HidroQoL change scores (> 0·3). Using the HDSS as an anchor, patients were grouped according to their HDSS change scores. Because the DLQI is a multi‐item tool, two different methods were used when defining what is minimally improved in order to group the patients according to the anchor. Firstly, an established banding was applied to the DLQI.23 A one‐category change towards improvement was considered to be slightly improved and patients were grouped according to their DLQI category change scores. Secondly, given MID values for the DLQI in patients with hyperhidrosis (2·2–5·0)24 were used to form five different groups. For all approaches, the mean score change in the slightly improving group provided the MID estimate.12, 25 The mean change method is also one of the most commonly found in the literature.
The distribution‐based approach is based on the statistical characteristics of the baseline sample. Two methods have been proven to provide valid MID values, the half SD26 and the standard error of measurement [SEM = σx√(1−rel)], where σx = SD of the scale or subscale and rel = reliability of the scale or subscale (internal consistency).27
The integrated approach integrates the anchor‐based and distribution‐based methods using the upper bound of a one‐tail 95% CI for the mean score change in the ‘no change’ group. The following formula was used: mean score change in the patient group that did not change + 1·645 × standard error (SE).12, 28 Patients were equally grouped as when using the classical anchor‐based approach.
Results
Demographic characteristics of the study participants
The sample consisted of 171 patients with severe primary axillary hyperhidrosis. Eighty‐seven (50·9%) patients were male and 84 (49·1%) were female. The patients had a mean ± SD age of 37·57 ± 12·09 and a median of 36 (range 18–65) years.
Distribution of response categories
The distribution of responses was assessed. The items showed a negative skew reflecting some ceiling effects. This was not surprising as only patients with severe primary axillary hyperhidrosis were included in the study. The highest response category was chosen by 26–91% of the patients.
Structural validity
Goodness‐of‐fit indices for the HidroQoL indicated an acceptable model fit as two indices were below the a priori stated cut‐off values (Table 1). Regarding the first three indices, at least one criterion should be met for a sufficient structural validity rating,19 which was fulfilled by the HidroQoL. Standardized factor loadings for the corresponding factors were high (> 0·3), except for item 1 where the SE was the highest (Table 2).
Standardized factor loadings and standard errors (SE)
| Factor 1 | Factor 2 | |||
| Estimate | SE | Estimate | SE | |
| Item 1 | 0·1668 | 0·0831 | – | – |
| Item 2 | 0·6923 | 0·0512 | – | – |
| Item 3 | 0·7609 | 0·0455 | – | – |
| Item 4 | 0·4556 | 0·0699 | – | – |
| Item 5 | 0·5300 | 0·0646 | – | – |
| Item 6 | 0·6599 | 0·0540 | – | – |
| Item 7 | – | – | 0·4851 | 0·0652 |
| Item 8 | – | – | 0·5296 | 0·0618 |
| Item 9 | – | – | 0·5449 | 0·0606 |
| Item 10 | – | – | 0·5351 | 0·0614 |
| Item 11 | – | – | 0·3692 | 0·0726 |
| Item 12 | – | – | 0·5617 | 0·0592 |
| Item 13 | – | – | 0·5851 | 0·0572 |
| Item 14 | – | – | 0·4378 | 0·0685 |
| Item 15 | – | – | 0·6303 | 0·0532 |
| Item 16 | – | – | 0·5642 | 0·0590 |
| Item 17 | – | – | 0·6371 | 0·0525 |
| Item 18 | – | – | 0·7060 | 0·0459 |
Internal consistency
We found a Cronbach’s α of 0·90 for the HidroQoL total scale, 0·81 for the first domain (daily life activities) and a Cronbach’s α of 0·87 for the second domain (psychosocial life) (n = 169). The findings were consistent with those of Kamudoni et al.13
Test–retest reliability
The ICCs from screening to baseline without any intervention were strong and almost identical with the findings of Kamudoni et al.13 (Table 3). From screening to baseline, 95 patients were stable in their HDSS; from baseline to day 15, 144 patients were stable. From baseline to day 15, ICCs were lower because the intervention had started and the time interval was longer, although patients reported no change in their HDSS score (Figure 3).
Intraclass correlation coefficients for the Hyperhidrosis Quality of Life Index total and the two domain scores before and with intervention
| Intraclass correlation coefficient (95% CIs) | |||
| Before intervention: from screening to baseline (days –7 to –4) | With intervention: from baseline to day 15 (14 days) | Kamudoni et al.13 | |
| Total score | 0·93 (0·897–0·954) | 0·61 (0·280–0·771) | 0·93 (0·89–0·95) |
| Domain 1 | 0·89 (0·841–0·929) | 0·53 (0·173–0·710) | 0·88 (0·83–0·92) |
| Domain 2 | 0·92 (0·879–0·947) | 0·66 (0·383–0·800) | 0·91 (0·87–0·94) |
CI, confidence interval.
bold indicates values are sufficient (P > 0·7), not significant
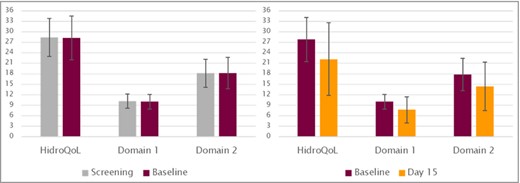
Hyperhidrosis Quality of Life Index (HidroQoL) mean scores for stable patients from screening to baseline (n = 95, left diagram) and from baseline to day 15 (n = 144, right diagram).
Convergent and discriminant validity
All correlations between HidroQoL scores and other subjective/objective measures were in line with our hypotheses (Table 4).
Correlations of the HidroQoL total and the two domain scores with the HDSS, DLQI and the gravimetric sweat production (GSP)
| HidroQoL total | Domain 1 | Domain 2 | HDSS | DLQI | GSP | |
| HidroQoL total | 1 | 0·81 | 0·97 | 0·45 | 0·69 | 0·08 |
| Domain 1 | 1 | 0·67 | 0·47 | 0·62 | 0·07 | |
| Domain 2 | 1 | 0·40 | 0·65 | 0·09 | ||
| HDSS | 1 | 0·35 | 0·15 | |||
| DLQI | 1 | 0·07 | ||||
| GSP | 1 | |||||
| n = 170 | n = 170 | n = 170 | n = 169 | n = 170 | n = 166 |
bold indicates hypotheses confirmed.
DLQI, Dermatology Life Quality Index; HDSS, Hyperhidrosis Disease Severity Scale; HidroQoL, Hyperhidrosis Quality of Life Index.
Known‐groups validity
We were able to confirm all our expectations. There were no significant differences in the HidroQoL total and the two domain scores between sexes (P ≥ 0·216) and different age categories (P ≥ 0·485). However, differences between different severity groups (HDSS = 2, 3, 4) were significant for the total and the two domain scores (n = 169, P < 0·001). This is in line with the findings of Kamudoni et al.13 The HidroQoL is capable of distinguishing between patients experiencing different levels of self‐reported disease severity (based on the HDSS scores).
Responsiveness
Using the first approach, the HidroQoL total change score had a correlation of 0·53, domain 1 (daily life activities) had a correlation of 0·56, and domain 2 (psychosocial life) had a correlation of 0·48 with the HDSS change score (n = 162). The anchor was therefore considered as appropriate and patients were grouped according to their HDSS change scores. The Kruskal–Wallis tests disclosed that patients with different HDSS change scores differed significantly in their HidroQoL scores (n = 162; P < 0·001). There was a significant difference (P < 0·001) in the HidroQoL total change and the two domain change scores in those reporting a change (HDSS change score ≤ –1) vs. those reporting no change (HDSS change score = 0). Single Wilcoxon U‐tests were calculated for the ‘no change’ group (HDSS change score = 0), the ‘slightly better’ group (HDSS change score = –1) and the ‘somewhat better’ group (HDSS change score = –2). For the ‘slightly worse’ group (HDSS change score = 1) and the ‘a good deal better’ group (HDSS change score = –3) only descriptive statistics are presented because the sample size was small (Table 5). Even patients experiencing no change according to their HDSS, significantly improved in their HidroQoL scores after day 29. Effect sizes were moderate to high.
HidroQoL responsiveness using HDSS change scoresa
| Anchor | Change scores | |||||||
| HDSS cs | Patient group | n | Scale | Mean baseline ± SD | Mean day 29 ± SD | Z | P‐valueb | ES |
| 0 | No change | 90 | HidroQoL total | 27·71 ± 5·95 | 24·79 ± 8·78 | –5·035 | < 0·001 | –0·531 |
| Domain 1 | 9·978 ± 2·08 | 8·75 ± 3·27 | –4·742 | < 0·001 | –0·500 | |||
| Domain 2 | 17·73 ± 4·34 | 16·04 ± 5·93 | –4·221 | < 0·001 | –0·445 | |||
| –1 | Slightly better | 38 | HidroQoL total | 27·47 ± 6·06 | 20·68 ± 8·07 | –5·059 | < 0·001 | –0·821 |
| Domain 1 | 10·05 ± 1·93 | 7·11 ± 2·82 | –5·101 | < 0·001 | –0·828 | |||
| Domain 2 | 17·42 ± 4·48 | 13·58 ± 5·58 | –4·522 | < 0·001 | –0·734 | |||
| –2 | Somewhat better | 23 | HidroQoL total | 28·30 ± 7·65 | 10·91 ± 9·20 | –4·107 | < 0·001 | –0·856 |
| Domain 1 | 10·30 ± 2·62 | 3·57 ± 2·83 | –4·113 | < 0·001 | –0·858 | |||
| Domain 2 | 18·04 ± 5·58 | 7·39 ± 6·63 | –4·019 | < 0·001 | –0·838 | |||
cs, change score; ES, effect size; HDSS, Hyperhidrosis Disease Severity Scale; HidroQoL, Hyperhidrosis Quality of Life Index.
an < 10 for the patient groups ‘slightly worse’ (HDSS change score = 1) and ‘a good deal better’ (HDSS change score = –3); bWilcoxon matched‐pair test.
Using the second approach, correlations with other outcome measure change scores were mostly in line with our hypotheses (Table 6).
Correlations of the Hyperhidrosis Quality of Life Index (HidroQoL) total change score and the two domains with the HDSS change score, DLQI change score and change in the gravimetric sweat production (GSP)
| HidroQoL total cs | Domain 1 cs | Domain 2 cs | HDSS cs | DLQI cs | Change in GSP | |
| HidroQoL total cs | 1 | 0·88 | 0·95 | 0·53 | 0·55 | 0·18 |
| Domain 1 cs | 1 | 0·72 | 0·56 | 0·52 | 0·11 | |
| Domain 2 cs | 1 | 0·48 | 0·53 | 0·22 | ||
| HDSS cs | 1 | 0·37 | 0·11 | |||
| DLQI cs | 1 | 0·21 | ||||
| Change in GSP | 1 | |||||
| n = 163 | n = 163 | n = 163 | n = 162 | n = 163 | n = 152 |
bold indicates hypotheses (almost) confirmed.
cs, change score; DLQI, Dermatology Life Quality Index; HDSS, Hyperhidrosis Disease Severity Scale.
Estimation of minimal important difference values
Using different approaches, several MID values were calculated and are presented in Table 7. Kamudoni12 proposed a MID of 3 for the HidroQoL total score. We found MID values for the total score from 1·9 to 6·8 and tend to suggest a MID of 4 which is 1 point above the MID proposed by Kamudoni.12
Minimal important difference (MID) values using different approaches
| Anchor‐based approach | Distribution‐based approach | Integrated approach | ||||||
| HDSS | DLQIa | DLQIb | ½ SD | SEM baseline | HDSS | DLQIa | DLQIb | |
| HidroQoL total | 6·8 | 4·5 | 3·4 | 3·09 | 1·93 | 3·79 | 3·43 | 3·79 |
| Domain 1 | 2·9 | 1·9 | 1·5 | 1·05 | 0·91 | 1·57 | 1·57 | 1·64 |
| Domain 2 | 3·8 | 2·6 | 1·9 | 2·27 | 1·65 | 2·29 | 1·96 | 2·25 |
DLQI, Dermatology Life Quality Index; HDSS, Hyperhidrosis Disease Severity Scale; HidroQoL, Hyperhidrosis Quality of Life Index; SEM, standard error of measurement.
acategory change, bMID change.
Discussion
All results were consistent with the initial validation of Kamudoni et al.12, 13 and confirmed the psychometric properties of the HidroQoL.
We could confirm the two‐factor structure of the HidroQoL with an acceptable model fit. The scale and the two subscales showed strong internal consistency, and test–retest reliability between screening and baseline was excellent. The results regarding construct validity were in line with all our hypotheses. We showed that the HidroQoL is capable of discriminating between patients experiencing different levels of change, and single Wilcoxon U‐tests demonstrated that all patients whose HDSS score improved had significantly better HidroQoL scores at day 29. Even when the patients did not report any change in their HDSS score, HidroQoL scores significantly improved. This shows that the HidroQoL is a more sensitive tool towards change than the HDSS and allows us to assess responsiveness to improvement. In order to interpret change scores and to make them useful for routine clinical practice, we calculated cut‐off scores, namely MID values. Using different approaches and two anchors (HDSS and DLQI), several MID values were found. We synthesized our findings and agreed on a MID value of 4 for the HidroQoL total score (Kamudoni12 proposed a MID value of 3 for the HidroQoL). This can be justified by the fact that this validation study used data from an RCT with physician‐diagnosed primary axillary hyperhidrosis with a more homogeneous sample than the sample used by Kamudoni et al.,12, 13 who included patients with self‐reported hyperhidrosis, encompassing patients with different manifestations of their hyperhidrosis (not just axillary hyperhidrosis, but also palmoplantar and generalized hyperhidrosis). For these reasons, it is not surprising that a ‘higher’ change score of 4 compared with the proposed 3 is needed to be perceived as beneficial by the patients.
Regarding PROMs in hyperhidrosis, recent advances included the development of the Axillary Sweating Daily Diary29 or the Hyperhidrosis Disease Severity Measure‐Axillary.30 Those two instruments were developed and validated to assess axillary sweating severity. Health‐related QoL is a different, more complex construct than severity and, therefore, a multi‐item, multidomain PROM is needed. For this reason, the HidroQoL is a true QoL instrument and its use is following the most appropriate scientific approach.
A strength of this study is the clinical confirmation of the patient’s diagnosis. Because the study was conducted in the context of an RCT that was compliant with good clinical practice guidelines, almost all patients from baseline completed the consecutive follow‐up assessments. The sample size of 171 patients was adequate. A larger sample size (> 300) would have allowed for the application of item response (modern test) theory approaches to provide additional evidence for validity as Kamudoni et al.13 have carried out. Furthermore, SAS codes were quality‐controlled to reduce susceptibility to errors. As a limitation of this study, the use of the HDSS and the DLQI as anchors can be mentioned. The HDSS for example is a single item combining two concepts in one question. Even the DLQI has several serious issues, e.g. double‐barrelled and redundant items and evidence for insufficient measurement properties.31, 32 In this study, data were collected across multiple countries using different language versions of the HidroQoL. Validating a PROM across different countries is challenging as cultural differences might bias the data. However, prior to use in this study, the original HidroQoL developed in English (UK) was linguistically validated to support different language versions. The results of the cognitive interviews in the context of the linguistic validation also provide a bridge from the original content validation in hyperhidrosis in general to axillary hyperhidrosis. Another limitation is the fact that only patients with moderate‐to‐severe hyperhidrosis with a HDSS of 3 or 4 were included in the study population. Patients with mild hyperhidrosis were not represented in the sample.
Data from an ongoing phase IIIb study will be used to extend the evidence presented by further psychometric analyses.
In conclusion, this study showed good measurement properties of the HidroQoL in terms of validity reliability and responsiveness to change. Findings from our analyses are consistent with the validity evidence generated in the original development and validation of the HidroQoL. It can be used in RCTs for the assessment of QoL impacts in primary axillary hyperhidrosis.
References
Author notes
Funding sources
The study was funded by a grant from Dr. August Wolff GmbH & Co. KG Arzneimittel.
Conflicts of interest
C.Ap. has received institutional funding from Dr. August Wolff GmbH & Co. KG Arzneimittel, and consultancy fees from Dr. August Wolff GmbH & Co. KG Arzneimittel and Sanofi Genzyme. He is a member of the executive committee of the Harmonising Outcome Measures for Eczema (HOME) initiative. C.J. and K.S. are employees of FGK, the clinical research organization that was hired by Dr. Wolff GmbH to conduct the clinical trial. C.M. and C.Ab. are employees of Dr. August Wolff GmbH & Co. KG Arzneimittel. P.K. is a developer of the HidroQoL and is an employee of Merck Healthcare KgaA. S.S. is a joint developer of the HidroQoL, has received unrestricted educational grants from GlaxoSmithkline, European Hematology Association, Novartis, Bristol Meyer Squib, Sanofi and Celgene, and consultancy fees from Pfizer and Agios.
*Plain language summary available online
