


Summary
Several pieces of evidence indicate that a complex relationship exists between constitutional telomere length (TL) and the risk of cutaneous melanoma. Although the general perception is that longer telomeres increase melanoma risk, some studies do not support this association. We hypothesize that discordant data are due to the characteristics of the studied populations.
To evaluate the association of TL with familial and sporadic melanoma.
TL was measured by multiplex quantitative polymerase chain reaction in leukocytes from 310 patients with melanoma according to familial/sporadic and single/multiple cancers and 216 age‐matched controls.
Patients with sporadic melanoma were found to have shorter telomeres compared with those with familial melanoma. In addition, shorter telomeres, while tending to reduce the risk of familial melanoma regardless of single or multiple tumours, nearly trebled the risk of single sporadic melanoma.
This is the first time that TL has been correlated to opposite effects on melanoma risk according to the presence or absence of familial predisposition. Individual susceptibility to melanoma should be taken into account when assessing the role of TL as a risk factor.
Telomeres are dynamic nucleoprotein complexes located at the ends of chromosomes, which maintain genomic stability by protecting the chromosomes against degradation, end‐to‐end fusion and atypical recombination.1 Telomeres consist of nucleotide repeats that shorten with each cell division; when they reach a critical short length, cells undergo senescence or apoptosis, providing a barrier against cancer development.2,3 However, telomere erosion may lead to genomic instability, a key event in carcinogenesis.4 Several epidemiological studies have analysed the potential role of telomere length (TL) on the risk of cancer, and their results indicate that the relationship between TL and tumorigenesis is complex and probably tumour‐type specific.5 Regarding cutaneous melanoma, much evidence supports the important role of telomere biology in the onset and progression of disease.6,7,8,9,10,11,12,13
Although most studies indicate a positive relationship between TL and melanoma risk (reviewed by Caini et al.14), others do not,8,15 or else they show an association in particular subgroups. For instance, Han et al.10 reported a weak positive association between TL and melanoma risk after examining female patients of whom 36·5% had a family history of skin cancer. Anic et al.6 also reported a significant association between TL and melanoma risk among women, but not in men, whereas Nan et al.13 described such a relationship in a cohort of 120 male subjects. Bodelon et al.,8 analysing a pool of sporadic and familial cases of melanoma, found no association between TL and melanoma risk, although Burke et al.9 described a significant positive association between TL and melanoma risk in familial melanoma cases without mutations in the CDKN2A gene, but not in CDKN2A mutation carriers. The positive relationship between TL and number of melanocytic naevi, a well‐known risk factor for melanoma, is also still under debate.7,8,9,16
Melanoma is a complex disease with multifaceted aetiology, involving phenotypic (e.g. light phototype, number of melanocytic naevi), genetic and environmental factors, and their combination and prevalence generates different pathways for the development of melanoma. In the presence of mutations in high penetrance melanoma predisposition genes (e.g. CDKN2A), familial clustering of cases is observed. Environmental factors, such as sun exposure and sunburn, are the major risk factors for sporadic melanoma cases.17,18 Both the number of naevi and presence of dysplastic naevi are predominant risk factors in multiple primary melanoma.19 Although melanomas occurring in a familial setting do not seem to have significantly different prognostic factors and survival rates when compared with sporadic melanoma,20 several studies highlight some differences among groups, such as earlier age at onset, absence of clinically detected sun damage, lower Breslow thickness and higher rate of multiple primary melanomas in familial cases.21,22,23
We hypothesized that the discordant results in the literature between TL and melanoma risk are due to the characteristics of the studied populations, with special regard to the presence or absence of familial predisposition. Thus, the aims of this study were to investigate whether TL was differentially correlated with familial or sporadic and multiple or single melanoma.
Materials and methods
Study population
This case–control study comprised 310 patients with melanoma referred to the Melanoma and Sarcoma Unit of the Veneto Institute of Oncology in Padova, Italy, between 2007 and 2013. All cases of melanoma diagnosis were confirmed by pathology reports; naevus count was calculated as patients with < 10, 10–50, or > 50 melanocytic naevi, according to physical examination by a trained dermatologist. Patients with a family history of melanoma (defined by personal interviews as having at least one other confirmed case of melanoma among first‐ or second‐degree relatives) were grouped as familial melanomas (FM), and patients with no such family history as sporadic melanomas (SpM). All patients with more than one subsequent melanoma were included in the multiple primary melanoma group (MPM) (median follow‐up: 3·5 years, range 0·2–21·1 years). Patients were included in the single primary melanoma group (SiM) if they had not had a second melanoma within at least a 3‐year period from the first diagnosis (median follow‐up: 7·9 years, range 3·0–34·3 years). Details of sex, age at blood sampling and naevus count are listed in the Supporting Information (see Table S1). No patient showed spread of disease or was under chemotherapy at the time of blood sampling. All melanoma cases were screened for germline mutations in the CDKN2A gene, as previously described,24 and no mutations were found. Controls were 216 healthy individuals without personal or familial antecedents of cancer, collected between 2011 and 2012 at the Blood Collection Centre, Hospital Transfusion Centre of Padova. They were frequency‐matched by age and sex to cases (n = 94, 43·5% men; n = 122, 56·5% women; 53·8 ± SD = 13·9 years, mean age at blood sampling). All patients and controls were of Caucasian origin. Written informed consent was obtained from all participants, as approved by the local institutional ethics committee.
Telomere length measurement
Relative TL was determined by monochrome quantitative multiplex polymerase chain reaction (PCR) assay,25 with minor modifications. All DNA samples were extracted from leukocytes with the QIAmp DNA kit (Qiagen; Milan, Italy) and their quality and concentration were assessed by both ultraviolet (UV) spectroscopy and agarose gel electrophoresis. The primer pair employed for telomere amplification were: TELG 5′‐ACACTAAGGTTTGGGTTTGGGTTTGGGTTTGGGTTAGTGT‐3′, and TELC 5′‐TGTTAGGTATCCCTATCCCTATCCCTATCCCTATCCCTAACA‐3′. The primer pair for amplification of single‐copy gene albumin were: ALBU 5′‐CGGCGGCGGGCGGCGCGGGCTGGGCGGAAATGCTGCACAGAATCCTTG‐3′ and ALBD 5′‐GCCCGGCCCGCCGCGCCCGTCCCGCCGGAAAAGCATGGTCGCCTGTT‐3′. Single‐copy gene albumin was amplified simultaneously with the telomere template in the same well and used as a reference, to adjust for differing amounts of DNA in different samples. Each PCR reaction was performed in a final volume of 25 μL, containing 5 μL sample (1 ng DNA μL−1) and 20 μL reaction mix containing 0·75 × SYBR Green I (Invitrogen, Milan, Italy), 10 mmol L−1 Tris–HCl pH 8·3, 50 mmol L−1 KCl, 3 mmol L−1 MgCl2, 0·2 mmol L−1 each dNTP (Applied Biosystems; Foster City, CA, U.S.A.), 1 mmol L−1 DTT, 0·625 U AmpliTaq Gold DNA polymerase, 1% DMSO (Sigma‐Aldrich; Milan, Italy) and 900 nmol L−1 of each primer. PCR reactions were performed on a LightCycler®480 real‐time PCR detection system (Roche Applied Science; Milan, Italy). The thermal cycling profile was 15 min at 95 °C, two cycles of 15 s at 94 °C and 15 s at 49 °C, followed by 40 cycles of 15 s at 94 °C, 10 s at 62 °C, 15 s at 74 °C, 10 s at 84 °C and 15 s at 88 °C, with signal acquisition at the end of the 74 °C and 88 °C steps. A standard curve was generated at each PCR run, consisting of DNA from the RAJI cell line, serially diluted from 100 to 0·41 ng μL−1.26 All DNA samples and reference samples were run in triplicate. LightCycler raw text files were converted to grid format with LC480Conversion free software developed by the Heart Failure Research Centre, Amsterdam, the Netherlands (http://www.hartfaalcentrum.nl/index.php?main=files&fileName=LC480Conversion.zip&description=LC480%20Conversion&sub=LC480Conversion). The converted data were analysed with LinRegPCR free software developed by Ruitjer et al.27 All DNA samples, from both cases and controls, were blind and consecutively run in triplicate together with reference samples. The intra‐ and inter‐assay reproducibility of both telomere and albumin PCR results was evaluated with dilutions of the reference curve and three DNA samples from patients. The SD of cycle threshold (Ct) values was ≤ 0·19 (% coefficient of variation ≤ 0·94) in six replicates of samples amplified in the same PCR run, and ≤ 0·28 (% coefficient of variation ≤ 1·31) among mean values of triplicates in different PCR runs. Mean Ct values were used to calculate the relative TL, with the telomere/single‐copy gene ratio according to the formula: ΔCtsample = Cttelomere−Ctalbumin, ΔΔCt = ΔCtsample−ΔCtreference curve (where ΔCtreference curve = Cttelomere_RAJI−Ctalbumin RAJI) and then T/S = 2−ΔΔCt.26
Statistical analysis
Linear regression was used to model the relationship between TL and covariates, i.e. diagnosis of melanoma, family history, presence of multiple lesions and number of naevi, with adjustments for age as a continuous variable and its first‐order interaction with each covariate considered. The association between TL and the risk of each melanoma case‐type status (i.e. melanoma, familial melanoma, sporadic melanoma, etc.) was determined with a set of logistic regressions, adjusted for age and sex. TL was used as a categorical variable to account for a potential nonlinear relationship between TL and melanoma risk, and classified according to the quartiles of telomere distribution of controls; the fourth quartile, the longest TL, was used as the reference. All tests were two‐sided and a P < 0·05 was considered statistically significant. Statistical analyses were performed with SAS, version 9·1·3 (SAS Institute; Cary, NC, U.S.A.).
Analysis of false‐positive report probability (FPRP) was conducted to assess the probability of finding a false positive in a statistically significant test.28 The FPRP value for a given association was calculated with a prior probability of 0·2 and the statistical power to detect an odds ratio (OR) of 0·5. An association with an FPRP value below 0·2 was declared noteworthy.
Results
Telomere length in sporadic and familial melanoma
We analysed TL from 109 familial (FM) and 201 sporadic (SpM) cases of melanoma, and found that FM samples had longer telomeres than those of SpM cases (Fig. 1a). The age‐adjusted linear regression of TL was calculated (Fig. 1b), and significant differences emerged between the groups [mean TL_FM vs. mean TL_SpM: 1·075, 95% confidence interval (CI): 1·024–1·125 vs. 0·958; 95% CI: 0·921–0·995; P < 0·001]. Notably, the rate of telomere shortening by age in FM was higher than in SpM (slope TL_FM vs. slope TL_SpM: −0·011, 95% CI: −0·015 to −0·008 vs. −0·005, 95% CI: −0·007 to −0·002; P = 0·005).
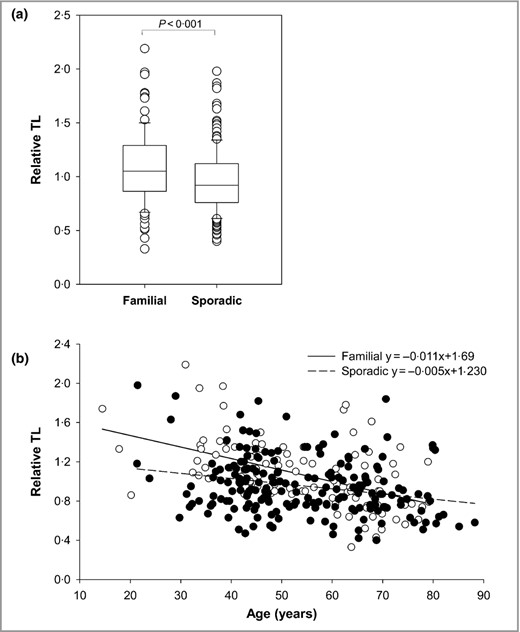
Comparison of telomere length (TL) between cases of familial and sporadic melanoma. (a) Box plots showing distribution of raw values of TL in cases of familial (109) and sporadic (201) melanoma. Upper and lower limits of the boxes show 75th and 25th percentiles, respectively; horizontal bar across the box indicates the median. (b) TL distribution as a function of age for cases of familial (white circles) and sporadic (black circles) melanoma. Regression lines and respective equations are shown.
Interestingly, when the TL of both groups was compared with that obtained from a control cohort of 216 healthy individuals (mean TL_controls: 1·013; 95% CI: 0·976–1·049), frequency‐matched for age and sex, FM and SpM were observed to have TL longer and shorter than controls, respectively (Fig. 2). No differences emerged when the TL of overall cases was compared with controls after adjusting for age and sex (P = 0·602; Fig. S1; see Supporting Information).
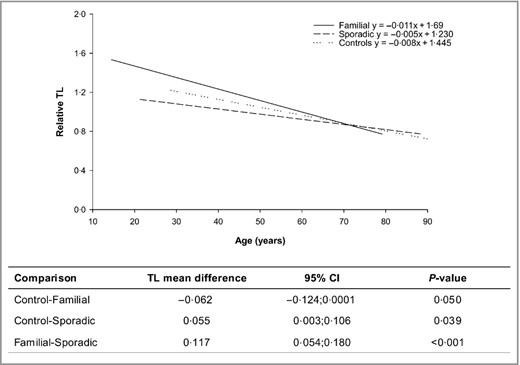
Correlation between telomere length (TL) and age in sporadic and familial melanoma cases and controls. Multiple linear regression model for each group and pairwise mean TL differences with 95% confidence intervals are shown.
Hence, familial and sporadic melanomas are characterized by different TLs, and a significant opposite interaction emerged between melanoma groups with respect to controls, suggesting an opposite effect on melanoma risk.
Telomere length in patients according to number of naevi and presence of multiple melanoma
We analysed the association between TL and naevi, as well as the occurrence of multiple melanomas. Matching previous reports,7 age‐adjusted TL turned out to be positively associated with increased naevus count (P = 0·011) (Fig. S2; see Supporting Information), whereas TL did not significantly differ between patients with multiple (MPM) or single melanoma (SiM) (Fig. S3; see Supporting Information). However, multivariate analysis including all available covariates showed that TL was significantly correlated with family history (SpM vs. FM P = 0·009) but not with naevus count or presence of MPM (Table 1). Hence, both single and multiple melanoma cases were analysed separately according to familial characteristics. In this subgroup analysis, we found that the age‐adjusted TL in the SiM group significantly differed between sporadic and familial cases (SiSpM vs. SiFM; 0·93 vs. 1·08; P < 0·001), whereas in the MPM group no difference emerged between sporadic and familial cases (MSpPM vs. MFPM; 1·00 vs. 1·06; P = 0·312) (Table 2).
Multiple linear regression model to test effects of family history, naevus count and presence of multiple melanoma on age‐adjusted telomere length (TL)
| Characteristics | Cases, n (%) | TL, meana (95% CI) |
| Melanoma group | ||
| Sporadic (SpM) | 183 (66·5) | 0·96 (0·92–1·00) |
| Familial (FM) | 92 (33·5) | 1·06 (0·99–1·12) |
| P‐value | 0·009 | |
| Naevus count | ||
| < 10 | 47 (17·1) | 0·97 (0·88–1·06) |
| 10–50 | 123 (44·7) | 0·99 (0·94–1·05) |
| > 50 | 105 (38·2) | 1·06 (1·05–1·12) |
| P‐value | 0·185 | |
| Number of melanomas | ||
| 1 = Single (SiM) | 161 (58·5) | 1·01 (0·96–1·06) |
| ≥ 2 = Multiple (MPM) | 114 (41·5) | 1·01 (0·94–1·07) |
| P‐value | 0·946 | |
aEstimated mean TL values with 95% confidence intervals (CI). P‐values of differences between groups are reported.
Subgroup analysis to test effects of family history and presence of multiple melanoma on telomere length (TL) by age‐adjusted multiple linear regression model
| Subgroup patients | Cases, n (%) | TL Meana (95% CI) |
| Single melanoma | ||
| Sporadic (SiSpM) | 121 (39·0) | 0·93 (0·88–0·98) |
| Familial (SiFM) | 69 (22·3) | 1·08 (1·01–1·14) |
| P‐value | < 0·001 | |
| Multiple melanoma | ||
| Sporadic (MSpPM) | 80 (25·8) | 1·00 (0·94–1·07) |
| Familial (MFPM) | 40 (12·9) | 1·06 (0·97–1·15) |
| P‐value | 0·312 | |
aEstimated mean TL values with 95% confidence intervals. P‐values of differences between groups are reported.
The opposite association between TL and familial or sporadic melanoma was emphasized by the results of FPRP analysis. The association with TL was in fact found in both sporadic and familial melanoma and in single sporadic and familial melanoma, supporting the findings of a reduced risk of being sporadic and single sporadic melanoma for every one‐unit increase in TL, after adjusting for age (Table S2; see Supporting Information).
Telomere length and melanoma risk
We then estimated the effect of TL on melanoma risk for the familial and sporadic patient group, using a model adjusted for age and sex. Cases were categorized into quartiles based on the TL distribution of controls. As Table 3 shows, shorter TLs were observed to be associated with a decreased risk in familial cases (FM: OR = 0·46; 95% CI: 0·23–0·95) and an increased risk in sporadic cases (SpM: OR = 1·74; 95% CI: 1·00–3·04) compared with longer TL, whereas TL did not modify the risk of melanoma when all cases were taken into account.
Association between telomere length and melanoma risk in overall and stratified patients
| Telomere length | Cases, n (%) | OR (95% CI) | P‐values |
| All melanoma | |||
| First quartile < 0·831 | 99 (32) | 1·14 (0·69–1·88) | 0·677 |
| Second quartile 0·831–0·967 | 58 (19) | 0·67 (0·40–1·11) | |
| Third quartile 0·968–1·134 | 66 (21) | 0·76 (0·46–1·24) | |
| Fourth quartile ≥ 1·135 | 87 (28) | 1 | |
| Familial melanoma (FM) | |||
| First quartile < 0·831 | 23 (21) | 0·46 (0·23–0·95) | 0·046 |
| Second quartile 0·831–0·967 | 22 (20) | 0·47 (0·24–0·92) | |
| Third quartile 0·968–1·134 | 21 (19) | 0·47 (0·25–0·90) | |
| Fourth quartile ≥ 1·135 | 43 (40) | 1 | |
| Sporadic melanoma (SpM) | |||
| First quartile < 0·831 | 76 (38) | 1·74 (1·00–3·04) | 0·049 |
| Second quartile 0·831–0·967 | 36 (18) | 0·83 (0·46–1·49) | |
| Third quartile 0·968–1·134 | 45 (22) | 1·02 (0·58–1·79) | |
| Fourth quartile ≥ 1·135 | 44 (22) | 1 | |
| Single sporadic melanoma (SiSpM) | |||
| First quartile < 0·831 | 51 (42) | 2·61 (1·34–5·10) | 0·008 |
| Second quartile 0·831–0·967 | 21 (17) | 1·04 (0·51–2·15) | |
| Third quartile 0·968–1·134 | 28 (23) | 1·37 (0·69–2·71) | |
| Fourth quartile ≥ 1·135 | 21 (17) | 1 | |
OR, odds ratio estimated by logistic regression analysis adjusted for age and sex; CI, confidence interval. P‐values of the trend are reported.
When the analysis was performed in subgroups of melanoma cases also taking into account the presence or absence of MPM, the increase in melanoma risk in sporadic melanoma cases with shorter TL was more evident in patients with single melanoma (SiSpM: OR = 2·61; 95% CI: 1·34–5·10, P = 0·008) but the risk was not related to TL in cases of multiple sporadic melanomas (MSpPM: OR = 1·04; 95% CI: 0·50–2·17, P = 0·909). In the familial subgroups, the association between decreased risk and shorter telomeres did not vary according to the presence or absence of multiple melanomas, although it did not reach statistical significance, probably because of the small sample size (SiFM: OR = 0·48, 95% CI: 0·21–1·07, P = 0·168; MFPM: OR = 0·42, 95% CI: 0·14–1·30, P = 0·078).
Discussion
To our knowledge, this is the first study examining the relationship between TL and melanoma risk according to familial or sporadic status, also taking into account the occurrence of multiple or single tumours. We observed that constitutive TL was significantly longer in familial than in sporadic melanoma, and that different kinetics of TL shortening with age emerged between the groups, indicating the different role played by TL in the pathogenesis of familial or sporadic melanoma. We also found that TL, which was longer and shorter in FM and SpM than controls, respectively, plays the opposite role in melanoma risk, according to the presence or absence of familial predisposition. Short telomeres reduced the risk of familial melanoma by more than half, regardless of single or multiple tumours, but they nearly trebled the risk in sporadic cases with only one melanoma. This effect was not detected in sporadic cases with multiple lesions, suggesting that other risk factors are involved in these melanoma‐prone individuals. Thus, on one hand, our data confirm previous results showing a direct association between TL and melanoma risk in melanoma‐prone families;9 on the other, they add the new finding of an inverse association between TL and melanoma risk in single sporadic cases.
Approximately 10% of cutaneous melanomas occur in a familial setting, and a different aetiology arises between familial and sporadic melanoma, as certain inherited traits play a critical role in the onset of the former and environmental factors in the latter. In this regard, the role of exposure to sunlight, an important environmental risk factor for melanoma, is under discussion in families with high disease susceptibility,17,18 in which genetic determinants are more predictive of cancer risk. It is interesting in this context to examine the hypothesis of Whiteman et al.,29 that cutaneous melanoma develops along two diverging pathways: one naevus‐dependent, in which melanocytes of naevus‐prone individuals are induced to proliferate by host factors contributing to melanomagenesis with little sun exposure; and the other UV light‐dependent, in which melanocytes become malignant after intense sun exposure. According to its clinical and histopathological characteristics, familial melanoma has been associated with the former pathway,21 matching previous data showing that sun exposure is not associated with melanoma risk in melanoma‐prone families.17,18
Iles et al.30 recently demonstrated that germline genetic determinants underlying long telomeres increase the melanoma risk in a large cohort of patients preferentially selected for family history or multiple primary tumours. Long telomeres, characterizing familial cases, may confer a high cellular replicative potential, which in turn favours additional genetic mutations and the development of melanoma. Conversely, in the absence of constitutive predisposing factors, as in the case of single sporadic melanoma, telomere shortening may contribute to melanoma development by inducing genetic instability, as reported for other tumour histotypes.31 This opposite effect of TL on melanoma risk according to familial or sporadic status may reproduce the dual roles of telomere biology in tumorigenesis32 and support the divergent pathways hypothesis in melanomagenesis.29 Genetic determinants that favour long telomeres and cluster in a familial setting do increase replicative potential,30 favouring the naevus‐dependent pathway of melanoma, whereas environmental factors, such as exposure to the sun, induce telomere shortening33 and genetic instability, favouring a UV light pathway in sporadic melanoma.
Following the model very recently advanced by Rode et al.,34 the association between short telomeres and sporadic cancer that we observed may also be considered as an observational analysis due to a confounding factor, such as UV exposure, which can lead independently to both telomere shortening and increased melanoma risk. Conversely, the association between long telomeres and familial melanoma is more probably due to genetic disposition, and the effect of melanoma risk derives from the sum of alleles leading to long telomeres, which may increase cancer cell replication.
Unfortunately, in the present study we could not evaluate interactions between telomere and environmental risk factors, such as exposure to sunlight, because some patient information was missing. Larger studies on familial and sporadic melanoma will be required to confirm the association among genetic and environmental determinants, TL and familial status. Another limitation of our study is that the family history was ascertained primarily through personal interviews, and these findings should therefore be validated in other familial and sporadic melanoma sample sets. Nonetheless, our considerations should be contextualized according to tumour histotype, in that short telomeres seem to be associated with an increased cancer risk in both familial and sporadic cases in ovarian cancer35 and in hereditary but not sporadic cases in breast cancer.36
In conclusion, the role of telomeres in the genesis of melanoma is complex, and both short and long telomeres may increase the individual risk of melanoma, depending on other predisposing/risk factors. Emerging and future studies on the genetics of telomere biology will help to better define the complex relationship between TL and the risk of cutaneous melanoma.
References
Author notes
Funding sources This study was partially funded by a grant from AIRC (no. 14258) and Association Piccoli Punti Onlus of Padova.
Conflicts of interest None declared
Plain language summary available online
