-
PDF
- Split View
-
Views
-
Cite
Cite
A. A. Dahaba, H. Bornemann, B. Holst, G. Wilfinger, H. Metzler, Comparison of a new neuromuscular transmission monitor compressomyograph with mechanomyograph, BJA: British Journal of Anaesthesia, Volume 100, Issue 3, March 2008, Pages 344–350, https://doi.org/10.1093/bja/aem379
Close - Share Icon Share
Abstract
We developed a new neuromuscular transmission monitor, the compressomyograph (CMG, European patent number: EP 06018557.6, US patent number: US 60/824.541). This is the first preliminary report comparing neuromuscular block monitored by CMG and the Relaxometer® mechanomyograph (MMG).
The two monitors were randomly allocated to the left or right hands of 16 patients. T1, first twitch of the train-of-four (TOF) expressed as percentage of control response, and the TOF ratio (T4:t1) were used to evaluate the neuromuscular block produced by rocuronium 0.6 mg kg−1.
The CMG monitor exhibited no pre-relaxation reverse fade (T4>T1) or T1 exceeding 100%. There was no significant difference in mean (sd) onset time, Dur25 (time to T1 25% recovery), or Dur0.9 (time to 0.9 TOF ratio recovery) measured by the CMG [2.4 (0.9), 22.6 (4.1), 43.1 (10.3) min, respectively] compared with MMG [2.1 (0.9), 22.9 (3.3), 43.3 (10.0) min, respectively]. According to Bland and Altman analysis, the bias (upper and lower limits of agreement) for T1% was −0.3% (+13.4% and –13.8%) and for TOF ratio was –0.009 (+0.068 and −0.085). CMG showed 100% sensitivity and 75% specificity in indicating full relaxation for tracheal intubation, and 80% sensitivity with 86% specificity in predicting MMG 0.9 TOF ratio.
The CMG could be a reliable clinical monitor in the daily anaesthesia practice that does not require time to set up or rigid support of the arm.
Mechanomyography (MMG) is regarded as the standard method for precise quantification of neuromuscular block.1 The conventional MMG measures the exact force of muscle contraction in response to electric stimulation of the ulnar nerve. MMG quantifies the neuromuscular function via measurement of force displacement. The equipment is rather bulky, takes time to set up, and requires a rigid support of the arm in an often-crowded operating room. This limits its clinical use in daily anaesthesia practice. On the other hand, several integrated modules in anaesthesia machines or stand-alone neuromuscular monitoring devices are currently available. These include either acceleromyographic devices (based on the quantification of the acceleration of a piezo-electrode) such as the TOF-Guard2 and TOF-Watch3 (Organon, Oss, The Netherlands) or kinemyographic devices (based on the quantification of the bending of a piezo-electric ceramic-wafer) such as the ParaGraph (Vital Signs, Totowa, NJ, USA),4 or the AS/5 M-NMT (Datex Ohmeda, Helsinki, Finland).5 Versatility and mobility comes at the expense of accuracy as these monitors were shown not to accurately correlate to MMG, and compared with MMG, it is well documented that the methods could not be used interchangeably.1–5 This is because these monitors are based on physiologically different phenomena than the force displacement of the MMG. Thus, the techniques currently available have several pitfalls; MMG devices are not commercially available, whereas the methods that are available seem to be less reliable than MMG.
Using pressure created in a balloon to monitor neuromuscular block has been previously utilized in a different fashion, as Hemmerling and colleagues6 used a small 2.5 cm air-filled balloon, glued to the skin area above the eyebrow, to monitor rocuronium neuromuscular block. In our centre, we developed a neuromuscular transmission monitor, the compressomyograph (CMG, European patent number: EP 06018557.6, US patent number: US 60/824.541) that quantifies pressure changes generated from hand contraction.
The aim of our study was to compare the neuromuscular block of rocuronium 0.6 mg kg−1 (twice the 95% effective dose, ED95) monitored by the CMG with that monitored by the Relaxometer® mechanomyograph (Groningen University, Groningen, The Netherlands)7 and to evaluate the new system for its diagnostic accuracy.8
Methods
Description of the compressomyograph
The new CMG neuromuscular transmission monitor consists of a nerve stimulator unit, a pressure transducer connected to a balloon, a pressure-monitoring unit, and a data processing unit. The balloon (placed between two plastic strips in the patient’s hand and held by a fastener strap) is inflated with 20 ml of air, using a 20 ml syringe, giving an overpressure of about 20 mbar monitored via a manometer attached to the three-way connector valve (Fig. 1a). The patient’s fingers do not directly touch the balloon, but rather touch the two plastic strips that are, in turn, uniformly in contact with the balloon (Fig. 1a–c). This ensures a uniform deformation of the spherical balloon with each hand contraction. In our ex vivo studies removing the balloon after measurement and placing it again in the patient’s hand for repeated measurement yielded near identical responses.
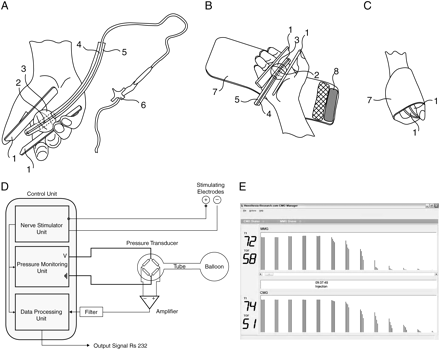
(a) The CMG quantifies the pressure changes in a hand-held balloon as a measure of the force created by the hand contraction. 1, two plastic strips; 2, aperture for air delivery to the balloon; 3, balloon; 4, inner tubing for air delivery to the balloon; 5, outer rigid tubing to hold the balloon in place; 6, three-way valve connector for air delivery to the balloon. (b) The CMG monitor’s hand strap. 7, hand strap; 8, hook and loop fastener strap. (c) The CMG monitor after closing the fastener strap. (d) CMG architecture and hardware connections. (e) Displayed TOF of the CMG and MMG.
The CMG measures pressure changes generated from the hand contraction in response to electric stimulation of the ulnar nerve at the wrist, mainly resulting from the adductor pollicis muscle’s powerful adduction of the thumb as it opposes the rest of the digits in gripping movement. The flexor digiti minimi brevis and opponens digiti minimi hypothener muscles flex the little finger and oppose it to the thumb. The medial two lumbricals flex the metacarpo-phalangeal joints of the little and ring fingers. In addition, the palmaris brevis muscle contraction tightens the handgrip as a whole.
The pressure change in the balloon could be measured using a standard strain-gauge pressure transducer (KPY63 AK sensor, sensor signal: 25–250 mV, pressure range 0–1.6 bar, R≈5 kΩ, 50–150 µV mbar−1 at U=5 V). The pressure change causes a small membrane in the pressure transducer to be deformed. The change in the membrane resistance, as a result of its deformation, is measured using a Wheatstone bridge configuration (four resistors integrated using lithography) (Fig. 1d). The transducer output is a voltage signal proportional to the pressure change, which is then amplified to a signal in the voltage range and filtered through a low-pass filter with a cut-off frequency of 20 Hz. Initially, the pressure response to the supramaximal current is set to 100%. The pressure responses to all following stimulations are given relative to this 100%, similar to the procedure used in the MMG where the force corresponding to the supramaximal current is set to 100%. The final signal is displayed and recorded using a RS 232 interface connecting the monitoring unit to a lap top computer (Fig. 1e).
The maximum pressure change in the balloon is 0.6 mbar. Because the balloon we used is made of thin flexible latex, quite similar to the texture of the cuff of an endotracheal tube, it gave a linear response to an ascending sequence of externally applied pressures in our preliminary testing of the balloon. Our ex vivo studies showed a similar linear response to ascending forces created by the hand contraction. Since pressure=force/area, thus as long as the area over which the force of the contracting hand is applied remains constant (balloon’s contact area with the two plastic strips), therefore, pressure change in the balloon will be directly proportional to the force. Simple geometrical calculations showed that this condition is fulfilled for small pressure changes where the deformation of the balloon is small relative to its total volume. MMG measurements provided the clinically relevant muscle force range. In our present design, the relative volume change of the balloon is <3% for the clinically relevant range of nerve stimulations up to 60 mA.
Study
A prospective consecutive study (study registration number at Medical University of Graz: 17–190 ex 05/06) was conducted in accordance with the 2005 Stockholm revision of the guidelines of the ‘Good Clinical Research Practice (GCRP) in Pharmacodynamic Studies of Neuromuscular Blocking Agents II’1 and ‘Standards for Reporting of Diagnostic Accuracy’ (STARD) criteria.8 After ethics committee approval, all patients who agreed to participate in the study gave written informed consent. Exclusion criteria were history of neuromuscular disease, small joint arthritis, or patients on treatment with drugs thought to interfere with neuromuscular transmission. Sixteen consecutive patients, aged 18–59 yr, BMI 18.5–24.9,1 ASA I–II, and undergoing short elective surgical procedures of approximately 1 h in the supine position were included in the study.
Midazolam, 7.5 mg p.o., was administered 1 h before operation for premedication. Anaesthesia was induced with propofol 2–3 mg kg−1 and fentanyl 1.5 µg kg−1 until the eyelash reflex was obtunded. A ProSeal laryngeal mask airway was inserted and after capnographic confirmation of correct positioning, the lungs were ventilated mechanically with 40% oxygen in air. Ventilation was adjusted to maintain end-tidal carbon dioxide of 4–5.5 kPa. Anaesthesia was maintained with propofol 100–150 µg kg−1 min−1 and remifentanil 0.1–0.2 µg kg−1 min−1 infusions. Patients were warmed using a forced-hot-air-blanket to maintain core temperature ≥35°C and skin temperature above 32°C.1
Both arms were comfortably positioned on arm boards. To level out the effect of dominance of one hand, the two monitors were randomly allocated to the left or right hands according to a computer-generated scheme. The force transducer of the Relaxometer was attached to one hand, and the preload on the thumb was maintained within 200–400 g throughout the whole procedure according to the manufacture’s instructions.7 The CMG balloon was placed between the two small plastic strips in the other hand and held by the specially designed ‘hook and pile Velcro®’ fastener strap for simultaneous monitoring. The balloon was then inflated with 20 ml of air. The stimulating electrodes were silver/silver chloride surface electrodes placed 4 cm apart on the ulnar nerve at the wrist.1 In response to evoked stimulation of the ulnar nerve, the pressure changes in the air-filled balloon generated a voltage potential across the pressure transducer that is directly proportional to the force created by the hand contraction. In an ascending sequence of electric stimulations starting from 10 mA, supramaximal currents were determined as the stimulation intensity +20% higher than the current that produced maximal response in the MMG (force) and CMG (pressure).1 After supramaximal current determination by both monitors, the ulnar nerves were stimulated by train-of-four (TOF) stimuli (2 Hz, pulse width 200 µs, square wave for 2 s) at 12 s intervals. T1, first twitch of the TOF expressed as percentage of control response, and the TOF ratio (T4:t1) were used for evaluating the neuromuscular block.
The MMG and CMG data were simultaneously collected and stored on a lap top computer using the ‘AZG-Relaxometer 5.0 program’ and the ‘CMG data collection software’. After stable control responses (variation ≤5% T1 for the last 2 min),1 rocuronium 0.6 mg kg−1 (twice the 95% effective dose, ED95) was administered and patients were allowed to recover spontaneously from the neuromuscular block until a stable recovery signal occurred, defined as TOF ratio of ≥0.9 with response variation ≤5% for 2 min.1 Lag and onset times (time from start of rocuronium administration until the first measurable and maximal neuromuscular blocks), Dur25 and Dur0.9 (time from start of rocuronium administration until T1 25% and 0.9 TOF ratio recoveries), Dur25–75 and Dur25–0.9 (time from 25% T1 to 75% T1 and 0.9 TOF ratio recoveries) time-course of action variables were calculated.1
There are no data on CMG monitoring to enable an a priori sample size to be calculated. Thus, our a priori power analysis was based upon a previous study in which Dur25 using the MMG was 20.2 (6.3) min compared with 25.6 (8.0) min using the M-NMT.5 Our power analysis (α=0.05) showed that a sample size of nine patients would be required to reveal a statistically significant difference between the two monitors with >90% power. The sample size was increased by >50% to 16 patients in a preliminary study. Student’s t-test was used to compare the differences in the time-course of action variables. Data were expressed as mean (sd). P<0.05 was considered statistically significant.
To assess the sensitivity, specificity, and positive/negative predictive values (PPV/NPV) of the CMG, we used three clinically relevant end-points, namely MMG T1 5% at induction for tracheal intubation,1,9 MMG T1 25% recovery for repeat neuromuscular blocking agents (NMBAs) administration, and MMG 0.9 TOF ratio for full recovery from neuromuscular block.1
Data collected during recovery from neuromuscular block were further analysed using the statistical method of Bland and Altman.10 Although mechanomyography might be regarded as the standard method for quantification of neuromuscular block,1 still Bland and Altman analysis considers both techniques subject to experimental error. The limits of agreement are defined as the bias (1.96 sd) in which 95% of the differences between the two monitors are expected to lie.10
Results
The mean (sd) (range) age of the patients was 44.9 (30.3–58.4) yr, weight 65 (8) kg, and height 173 (13) cm. There were 11 males and five females. MMG preload was constant during the whole measurement period (range 244–367 g). There was no significant difference in the stimulating currents of the two monitors. After the stabilization period of 3.9 (0.5) min before rocuronium administration, mean MMG T1 exceeded 100% [104.14 (1.95)], whereas mean CMG T1 did not [98.5 (0.8)]. The mean pre-relaxation MMG [0.97 (0.012)] and CMG [0.98 (0.008)] TOF ratios did not exceed 1.0.
After rocuronium administration, T1% and TOF ratios of both monitors started to decrease simultaneously. Full neuromuscular block was reached in all patients independent of the monitoring technique. All recovery T1 indices were not ‘normalized’1 as they were determined in relation to T1 control baseline and not T1 at full recovery. There were no significant differences in the two monitors’ time course of action parameters (Table 1).
Rocuronium time course of action variables (min). Values are mean (sd), MMG, mechanomyograph; CMG, compressomyograph; bias, difference between the two monitors; limits of agreement=bias (1.96 sd); lag time, time from start of rocuronium administration until first measurable effect of neuromuscular block; onset time, time from start of rocuronium administration until maximum suppression of first response of TOF (T1); Dur25, time from start of rocuronium administration until 25% T1 recovery; Dur25–75, time from 25% to 75% T1 recovery; Dur0.9, time from start of rocuronium administration until 0.9 TOF ratio recovery; Dur25–0.9, time from 25% T1 to 0.9 TOF ratio recovery. There were no significant differences between the two monitors in lag time, onset time, Dur25, Dur25–75, Dur0.9, and Dur25–0.9
| . | MMG . | CMG . | Bias . | Limits of agreement . | |
|---|---|---|---|---|---|
| . | . | . | . | Upper . | Lower . |
| Lag time (min) | 0.9 (0.4) | 1.0 (0.4) | −0.1 (0.2) | 0.25 | −0.45 |
| Onset time (min) | 2.1 (0.9) | 2.4 (0.9) | −0.3 (0.2) | 0.09 | −0.69 |
| Dur25 (min) | 22.9 (3.3) | 22.6 (4.1) | 0.3 (1.9) | 4.02 | −3.42 |
| Dur25–75 (min) | 8.8 (3.5) | 8.2 (3.4) | 0.6 (0.9) | 2.36 | −1.16 |
| Dur25–0.9 (min) | 20.4 (8.7) | 20.5 (9.0) | −0.1 (2.4) | 4.53 | −4.70 |
| Dur0.9 (min) | 43.3 (10.0) | 43.1 (10.3) | 0.2 (1.3) | 2.79 | −2.45 |
Our study demonstrated that the CMG showed high sensitivity and specificity in indicating time for tracheal intubation, rocuronium re-injection, and full recovery from neuromuscular block (Table 2).
Compressomyograph sensitivity, specificity, and positive and negative predictive values. Values are mean (sd); MMG, mechanomyograph; CMG, compressomyograph; PPV, positive predictive value; NPV, negative predictive value; T1, first response of train-of-four; TOF, train-of-four. MMG TOF ratio was 0.891 (0.048) at CMG 0.9 TOF ratio recovery
| . | Sensitivity (%) . | Specificity (%) . | PPV (%) . | NPV (%) . | CMG . |
|---|---|---|---|---|---|
| MMG at 5% T1 induction | 100 | 75 | 67 | 100 | 13.9% (6.3) |
| MMG at 25% T1 recovery | 88 | 75 | 88 | 75 | 26.9% (6.8) |
| MMG at 0.9 TOF ratio recovery | 80 | 86 | 80 | 86 | 0.918 (0.049) |
| . | Sensitivity (%) . | Specificity (%) . | PPV (%) . | NPV (%) . | CMG . |
|---|---|---|---|---|---|
| MMG at 5% T1 induction | 100 | 75 | 67 | 100 | 13.9% (6.3) |
| MMG at 25% T1 recovery | 88 | 75 | 88 | 75 | 26.9% (6.8) |
| MMG at 0.9 TOF ratio recovery | 80 | 86 | 80 | 86 | 0.918 (0.049) |
According to Bland and Altman analysis, during recovery from neuromuscular block, T1 bias was −0.3% (Fig. 2) and TOF ratio bias was –0.009 (Fig. 3). The T1% and TOF ratio regression plots showed a linear relationship between the two monitors (Figs 4 and 5).
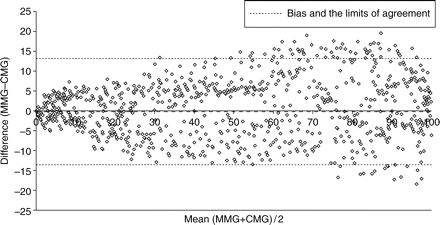
Bland and Altman scatter plot of the difference between the first twitch (T1%) of the MMG and the compressomyograph CMG against the mean of the two measurements, during recovery from neuromuscular block.
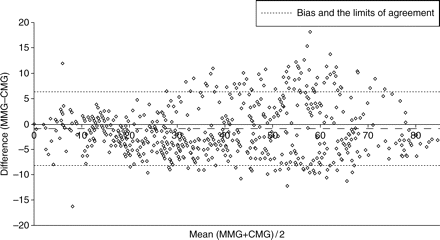
Bland and Altman scatter plot of the difference between the TOF percentage of the MMG and the CMG against the mean of the two measurements, during recovery from neuromuscular block.
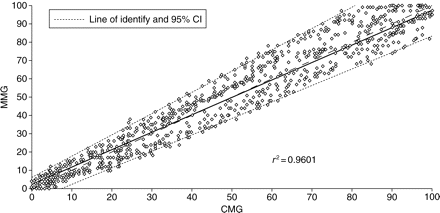
Regression plot of the first twitch (T1%) of MMG against CMG during recovery from neuromuscular block.
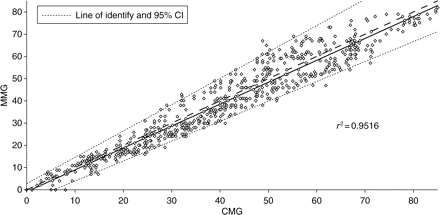
Regression plot of the TOF percentage of MMG against CMG during recovery from neuromuscular block.
After full recovery from neuromuscular block, mean MMG T1 exceeded 100% [112.2 (5.1)], whereas CMG T1 [97.6 (1.3)] did not.
Discussion
In our study, there were no significant differences between the CMG and the MMG time course of action parameters. Compared with MMG, we demonstrated that the upper and lower limits of agreement of CMG Dur25 (3.9 and −3.4 min), and Dur25–75 (2.4 and 1.1 min) were considerably narrower than the TOF-Guard Dur25 (8 and 5 min) and Dur25–75 (11 and –7 min).2
During the stabilization period before rocuronium administration, CMG did not exhibit the phenomenon of pre-relaxation ‘reverse fade’ in which T4 exceeds T1, nor did the CMG T1 exceed 100%. The ‘reverse fade’ phenomenon was previously reported with the kinemyographic ParaGraph,4 with the acceleromyographic TOF-Guard,2 and several earlier models such as the Acceleration transducer,11 or the Mini-Accelograph12 (Biometer, Copenhagen Denmark), as the TOF ratio was constantly >1.0 before NMBA administration.
Pre-relaxation reverse fade could be attributed to the fact that, despite the period of stabilization before NMBA administration, the non-relaxed free-moving thumb of the above-mentioned monitors2,4,11,12 might not necessarily always return to exactly the same position after each stimulus.2 Originally, unrestricted movement of the thumb was considered a prerequisite for the use of acceleromyographic monitors. The Copenhagen GCRP Conference lately acknowledged the fact that acceleromyographic devices are highly prone to errors resulting from movements,1 including those caused inadvertently by the surgeon or other operating room personnel.1,13 On the other hand, the ‘contained’ CMG hand movement might explain the lack of pre-relaxation ‘reverse fade’, as the CMG fastener strap freely allows the hand contraction during evoked stimulation while at the same time restricting the hand from sliding off the original position in-between stimulations. Furthermore, this ‘contained’ design provides greater flexibility and freedom in positioning of the patient’s measuring hand without disturbing neuromuscular monitoring, which is often an operating room requirement.
We demonstrated that the upper and lower limits of agreement of CMG TOF ratio (0.06 and −0.08) are considerably narrower than those of the Mini-accelerograph (0.30 and –0.30)12 or the kinemyographic M-NMT (0.22 and −0.28),5 compared with MMG in previous studies. This probably indicates that the discrepancies between the above-mentioned monitors5,12 and MMG are largely due to an inherent difference in their fundamental fade characteristics, which might not be the case with CMG.
One of the main objectives of neuromuscular monitoring is the detection of residual paralysis. Our study demonstrates that, in addition to the CMG reliably indicating the time for endotracheal intubation with 100% sensitivity and 75% specificity, the CMG could indicate MMG 0.9 TOF ratio full recovery with 80% sensitivity and 86% specificity (Table 2). This could be attributed to the fact that the two monitors quantify the neuromuscular function based upon two equivalent principles, namely the force transducer of the MMG detecting the force displacement of the thumb and the pressure transducer of the CMG detecting the force created by the hand contraction.
Appropriate monitoring devices for the precise detection of residual paralysis in the clinical setting are still lacking as the ‘drift’ phenomenon, in which T1 recovery deviates above the 100% control value, was reported with the kinemyographic ParaGraph4 and M-NMT5 monitors, and the acceleromyographic TOF-Watch3 and Mini-Accelerograph12 monitors. This was lately acknowledged by the Copenhagen GCRP Conference1 for the TOF-Watch and TOF-Watch−S monitors that do not display the actual erroneous ‘drift’ readings.1,3 Recovery T1% drift, in which T1 recovery deviates above the 100% control value, was suggested to be a sequence of the reverse fade manifested in the pre-relaxation stabilization period.2 In our study, MMG was prone to reverse fade in the pre-relaxation stabilization period and consequently manifested recovery T1% drift. On the other hand, T1% of CMG recovered to baseline value and was not prone to ‘drift’. The design of the CMG seems to evade the phenomenon of pre-relaxation reverse fade at induction and consequently the drift phenomenon at recovery. Thus, in a clinically relevant context, the CMG could reliably detect residual paralysis.
In conclusion, the CMG could be a reliable clinical monitor in the daily anaesthesia practice that does not require time to set up or rigid support of the arm. The CMG could detect the time for tracheal intubation, repeat dose administration, and full recovery from neuromuscular block as indicated by MMG.
Acknowledgements
The authors would like to thank Dr Roland Lammegger, Institute of Experimental Physics, Graz University of Technology, and Dr Gerhard Hoebarth, Department of Laboratory Medicine, Medical University of Graz, for their valuable technical advice and guidance. The authors would also like to thank Eugenia Lamont for reading and streamlining the manuscript and Head Nurse Lisa Hofstaetter for her great efforts in data collection.


