-
PDF
- Split View
-
Views
-
Cite
Cite
E. Deflandre, V. Bonhomme, P. Hans, Delta down compared with delta pulse pressure as an indicator of volaemia during intracranial surgery, BJA: British Journal of Anaesthesia, Volume 100, Issue 2, February 2008, Pages 245–250, https://doi.org/10.1093/bja/aem361
Close - Share Icon Share
Abstract
Delta pulse pressure (DPP) and delta down (DD) are indicators of volaemia. The threshold value of DPP for discriminating between responders and non-responders to fluid loading (FL) is 13%. This study aimed at comparing DD with DPP during intracranial surgery.
Twenty-six adult patients undergoing scheduled intracranial surgery under general anaesthesia were enrolled. DD and DPP were simultaneously measured every 10 min. A DPP>13% on two consecutive occasions prompted a 250 ml FL. Pairs of data were analysed using regression analysis, receiver operating characteristics (ROC) curve, and prediction probability (Pk).
We found a significant correlation between DD and DPP (R2=0.5431, P<0.001). ROC curve analysis revealed an excellent accuracy of DD in predicting a DPP value higher or lower than 13% (area under the curve: 0.967, se: 0.013). The DD threshold associated with the best sensitivity (0.90) and specificity (0.99) was 5 mm Hg. The Pk of DD to predict a DPP value higher or lower than 13% was 0.97 (se: 0.01). A total of 41 FL performed in 19 patients resulted in a decrease of DD and DPP below 5 mm Hg and 13%, respectively, in all but one occasion.
DD is as efficient as DPP to assess hypovolaemia and predict responsiveness to FL in patients undergoing intracranial surgery. A 5 mm Hg DD value can be considered as a valuable threshold for initiating FL. These results support its use during intracranial surgery.
Intraoperative fluid optimization improves outcome after surgery.1–4 However, there is no general rule for perioperative fluid administration in clinical practice. Each patient is considered individually for one type of surgery, and fluid administration is usually based on the so-called ‘goal-directed fluid therapy’.3 Candidates presenting for intracranial surgery may be at risk of hypovolaemia for different reasons, including insufficient fluid intake, physiological compensation for arterial hypertension, and ongoing diuretic therapy. In those patients, mannitol administration induces a phase of hypervolaemia which may be rapidly followed by hypovolaemia in the case of uncompensated diuresis.5 Hence, evaluation of volaemia to guide fluid administration is of clinical relevance in most of intracranial surgical procedures.
The delta pulse pressure (DPP) and the delta down (DD) have been proposed as indicators of volaemia and used to predict the haemodynamic response to volume expansion in mechanically ventilated patients. Those indices are based on the variation in arterial pressure associated with mechanical ventilation.6 DPP is calculated as the difference between the maximal and minimal pulse pressure during one breathing cycle, divided by their mean7 (Fig. 1). It has a sensitivity of 94% and a specificity of 96% in assessing hypovolaemia.7 Its threshold value for discriminating between responders and non-responders to fluid loading (FL) is estimated to be 13%,7 based on the fact that this value discriminates between patients responding or not to FL by a more than 15% increase in cardiac index. This value has been further confirmed in patients undergoing off-pump coronary artery bypass grafting (13.5%)8 and in patients undergoing major hepatic surgery (12.5%).9 The interest of DPP as an indicator of hypovolaemia has been shown in several studies.10–15
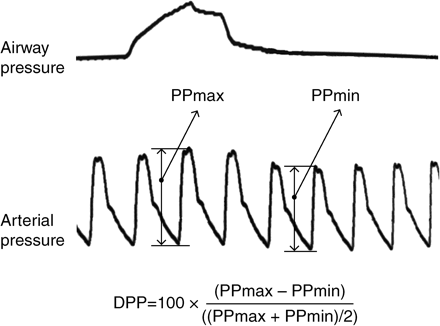
Illustration of the DPP measurement. First line represents the upper airway pressure and the second line represents the invasive arterial pressure. DPP, delta pulse pressure; PP, pulse pressure. Equation is explained in the text.
DD is defined as the difference between the systolic arterial pressure at the end of a 5 s respiratory pause, immediately before lung inflation, and its minimal value during the course of one mechanical breath16 (Fig. 2). It is considered to reflect the decrease in left ventricular ejection volume due to the increase in intrathoracic pressure. DD appears as an interesting index which deserves evaluation, notably in neurosurgical patients.
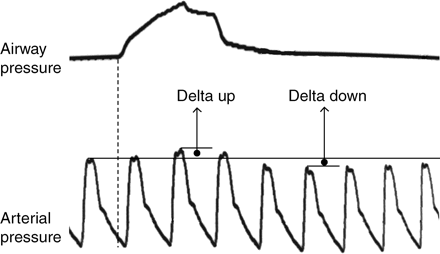
Illustration of the Delta up and DD measurements. First line represents the upper airway pressure and the second line represents the invasive arterial pressure. Explanations can be found in the text.
The present study was designed to compare DD with DPP as indicators of volaemia and to determine the respective ability of both indices for predicting fluid responsiveness in patients undergoing scheduled intracranial surgery.
Methods
After approval by the Regional Hospital Ethics Committee and informed consent, 26 adult patients (14 men and 12 women) undergoing scheduled intracranial surgery were enrolled in this prospective study. All of them were in regular sinus rhythm. Patients with a history of cardiovascular disease or taking beta-blocking agents were excluded. Surgery was preceded by a 6 h fasting period. Premedication consisted of alprazolam 0.5 mg and atropine 0.5 mg given orally with a small amount of water 1 h before surgery. Upon arrival in the operating room, non-invasive arterial pressure monitoring, ECG, and pulse oximetry were instituted in all patients (Datex-Ohmeda S/5™, Helsinki, Finland).
General anaesthesia was induced using propofol and remifentanil target-controlled infusions (propofol TCI, model of Marsh,17 Diprifusor™, and remifentanil TCI, model of Minto,18 Asena Pk syringe-pump™, respectively, Alaris Medical System, Hants, UK). Initial targets were set at 3 µg ml−1 and 6 ng ml−1 for propofol and remifentanil, respectively. After the induction phase, the remifentanil target was reduced to 4 ng ml−1. Neuromuscular relaxation was achieved using rocuronium at a dose of 0.6 mg kg−1. Patients were intubated with an oro-tracheal tube and mechanically ventilated with a Kion ventilator (Siemens-Elema AB, SE-171 95, Solna, Sweden). Controlled mechanical ventilation was maintained at a frequency rate of 12 min−1 and an inspiratory:expiratory ratio of 1:2, to achieve an end-tidal Pco2 between 4 and 4.5 kPa. During DD and DPP acquisition, the tidal volume was set at 8 ml kg−1 and the frequency rate was reduced to 4 min−1 to mimic the conditions of a respiratory pause, as recommended for the measurement of DD.16
All patients were equipped with a 20-G radial arterial catheter (Indwelling Polyurethane Catheter 20 Ga, Arrow International, Inc., Reading, PA, USA). DD and DPP were measured after insertion of the arterial catheter and then every 10 min until completion of surgery.
For DD and DPP calculation, the systemic arterial pressure input signal was recorded as a ‘pulmonary arterial pressure’ signal on the monitor (Datex-Ohmeda S/5™), allowing the anaesthetist to freeze the arterial curve (the cPAP screen giving simultaneously the arterial pressure and the upper airway pressure). For the sake of precision, the upper limit of the scale of this ‘pulmonary’ pressure was set 30 mm Hg higher than the systolic arterial pressure.
Basically, a crystalloid solution (Plasmalyte A®) was infused at a rate of 1 ml kg−1 h−1 to all patients. During surgery, a 0.5 mg kg−1 bolus of mannitol 20% was given to 21 patients upon request of the neurosurgeon. A DPP>13% on two consecutive occasions prompted a 250 ml colloid (hydroxyethyl starch 6%) FL over a period of 10 min, regardless of the DD value. Two consistent DPP>13% were considered to establish hypovolaemia in order to limit the risk of random and false positive assessment. The incidence of FL was calculated as the number of FL per patient for each hour of procedure, that is, per six pairs of DPP measurement. The incidence during each hour was added to the preceding one to obtain a cumulative value. The proportion of patients who needed FL was compared between those having received mannitol and those who did not, using a χ2 test.
The correlation between DD and DPP was evaluated using the curve fit analysis of the SPSS software (15.0 version for Windows). The ability of DD to predict a DPP value higher or lower than 13% was evaluated using receiver operating characteristics (ROC) curve analysis and prediction probability (Pk).19 As a backup test, the relationship between DD and the probability of observing a concomitant DPP value higher than 13% was calculated using logistic regression (SPSS Software). A two-tailed P-value of <0.05 was considered statistically significant.
Results
Demographic characteristics of patients are reported in Table 1. All patients were ventilated with a tidal volume >8 ml kg−1, except for one obese patient. Doses of mannitol ranged between 0.50 and 0.62 mg kg−1 (Table 1).
Demographic and perioperative characteristics of the 26 patients enrolled in the study
| Male/female | 14/12 |
| ASA I/II | 2/24 |
| Age (yr), mean (range) | 55 (86–21) |
| Weight (kg), mean (sd) | 75.81 (13.06) |
| Height (cm), mean (sd) | 169 (9) |
| Body mass index (kg m−2), mean (range) | 26.54 (37.92–19.84) |
| Number of measures per patient, mean (range) | 31 (75–13) |
| Tidal volume (TV) (ml), mean (range) | 625 (820–500) |
| TV weight−1 (ml kg−1), mean (range) | 82.9 (9.3–7.3) |
| Mannitol weight−1 (g kg−1), mean (range) | 0.55 (0.62–0.50) |
Overall analysis and agreement between DPP and DD
A total of 802 paired measurements of DD and DPP were performed. The model that best fitted the relationship between DPP and DD was a cubic relationship (equation: DD in mm Hg=1.694+0.042 DPP+0.018 DPP2−0.0004 DPP3; R2=0.5431, F(3,798)=316.168, P<0.001) (Fig. 3). ROC curve analysis revealed an excellent accuracy of DD to predict a DPP value higher or lower than 13% (area under the curve: 0.967, se: 0.013) (Fig. 4). The DD threshold associated with the best sensitivity (0.90) and specificity (0.99) was 5 mm Hg (0.67 kPa). This threshold was further confirmed by the logistic regression analysis (Fig. 5): the DD value associated with a 50% probability of the corresponding DPP value higher than 13% was 5.4 (0.72 kPa). The Pk of DD to predict a DPP value higher or lower than 13% was 0.97 (se: 0.01). Only 14 of the 802 paired measurements (1.7%) gave disagreeing information (DPP>13% and DD<5 mm Hg, n=10; or DPP<13% and DD>5 mm Hg, n=4).
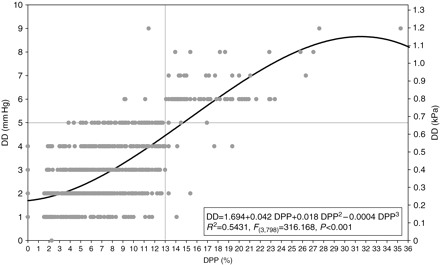
Relationship between DD and DPP. The regression line between them and its equation are displayed. Grey lines indicate the thresholds of DPP (13%) and DD (5 mm Hg).
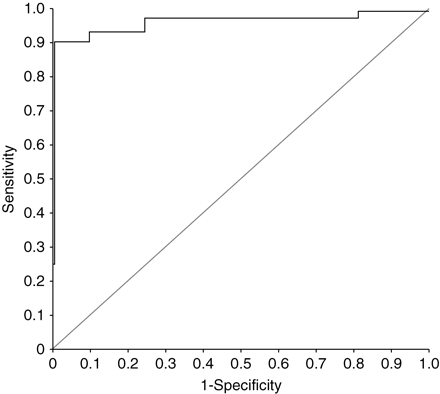
ROC curve of DD for discriminating patients with a DPP value higher or lower than 13%.
![Logistic regression between DD and the probability of DPP being higher than 13%. The equation of the regression curve is logit(P)=−12.661+2.318×DD, where logit(P)=log [P/(1−P)], and P, probability of DPP being higher than 13%. The DD value associated with a 50% probability is 5.4.](https://oup.silverchair-cdn.com/oup/backfile/Content_public/Journal/bja/100/2/10.1093/bja/aem361/2/m_aem36105.gif?Expires=1747965068&Signature=Wy5l0166kmbKcdEJgHbg66fRP6Hv~wud2yuYg6UbWj1Zz0aiSb4N9bodlUvvF4Yry9A448ENaxEWlMu33ifQSFFerlDdCtXd5giKFzz8bQJjFUkALm4C5rWgQc2XqIiLE1MooPreNxWpbh8W~0Vj~pftrsfT3LaCJyD7l-zLEY9up7HfZWkOetaGwjZKTDVk75Pp3st2dLDHryOjEQQKmvOm6tTnPhXy~7VlK0Rjg6IXLU5sAdtefr1BD6TLNPIkEtqDcEtsfWxG6vmhmTsb9lH8VE~Xs~5SjN-gQvg7VACX6OHGAA4cvp4zLeXCDHIVsV9UpCzkX-uXGFb95ygfyw__&Key-Pair-Id=APKAIE5G5CRDK6RD3PGA)
Logistic regression between DD and the probability of DPP being higher than 13%. The equation of the regression curve is logit(P)=−12.661+2.318×DD, where logit(P)=log [P/(1−P)], and P, probability of DPP being higher than 13%. The DD value associated with a 50% probability is 5.4.
Fluid loading
Out of the 802 DPP measurements, 98 values were >13%. Two consecutive DPP>13% were observed 41 times in 19 patients and prompted a FL. The DD value corresponding to these 82 measures was always >5 mm Hg. The 41 fluid challenges resulted in a DPP decrease below its threshold value of 13% 40 times, and in a DD decrease below 5 mm Hg 41 times (Fig. 6). On 16 occasions, a DPP>13% was observed in only one measurement (the next value obtained 10 min later being <13%). The corresponding DD values were >5 mm Hg on six occasions and ≤5 mm Hg 10 min later. In three out of the four occasions where a DPP value <13% and a corresponding DD value >5 mm Hg were measured, the two consecutive measurements (after 10 and 20 min) revealed a DPP value >13% and a DD value >5 mm Hg, leading to a FL which resulted in a decrease of DD and DPP below their respective threshold.
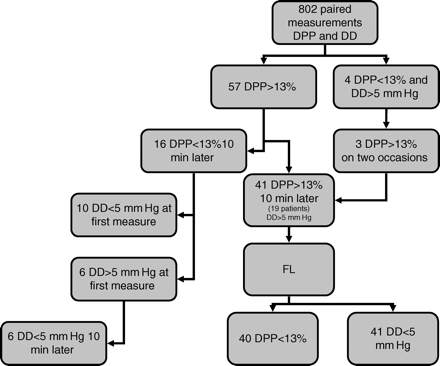
Flow chart of DPP measurements having led to a fluid loading. Out of the 802 paired measurements of DPP and DD, two consecutive measures of DPP>13% were observed 41 times, leading to FL. The corresponding DD were >5 mm Hg. FL resulted in a decrease of DPP below 13% 40 times and in a decrease of DD below 5 mm Hg 41 times. A single value of DPP>13% was observed 16 times. Among those, DD was >5 mm Hg six times, the following measure of DD being <5 mm Hg 10 min later. Simultaneous observation of a DPP<13% and DD>5 mm Hg occurred on four occasions. In three of those observations, the two following measurements of DPP gave values >13% and led to FL.
FL occurred at variable moments during the course of surgery. However, the cumulative incidence of that event increased regularly over time and did not reach a plateau, as displayed in Figure 7. The maximum cumulative incidence was <1 per patient and per hour.
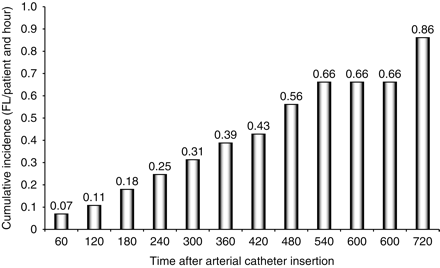
Cumulative incidence of FL as a function of time after radial catheter insertion. The incidence is the number of FL per patient per hour of observation, that is, per five paired consecutive measures of DPP.
FL was not significantly more frequent in patients having received mannitol. The proportion of patients requesting FL was 15/21 (71%) in those having received mannitol and 4/5 (80%) in the others (χ2(1)=0.15, P=0.70).
Discussion
The results of the present study consistently show that in patients undergoing intracranial surgery under general anaesthesia and mechanical ventilation: (i) there is a significant correlation between DD and DPP used as indicators of volaemia, (ii) DD reveals to be an excellent predictor of a DPP value higher or lower than 13%, (iii) the DD threshold associated with the best sensitivity and specificity is 5 mm Hg, as previously reported in the literature,6,20 (iv) FL in patients suspected of hypovolaemia results in a consistent decrease of DPP and DD below their threshold values, and (v) a measurement rate of DPP or DD of 1 per hour of procedure seems to be reasonable to assess the adequacy of volaemia in the absence of bleeding or excessive diuresis.
During surgery, volaemia is not directly measured but indirectly evaluated through different parameters and techniques which are more or less invasive. The major aims of the present study were to compare DD with a validated indicator, namely DPP, and to compare the ability of both indices to predict responsiveness with FL. We strongly demonstrated that DD significantly correlates with DPP. Using ROC and Pk analyses, we also showed that the value of DD is very efficient at predicting a DPP value higher or lower than 13%. The results of this study are in agreement with the study of Tavernier and colleagues,20 as far as we also confirmed the 5 mm Hg threshold of the DD in a neurosurgical patient population, different from the previously studied patient populations in terms of respiratory compliance and underlying pathology. Finally, both DD and DPP values revealed consistency in their response to FL.
Goal-directed fluid optimization is an important challenge for anaesthetists, but data regarding intracranial surgery patients are relatively scarce. In 2001, Berkenstadt and colleagues21 reported the use of a PiCCO monitor (Pulsion®), which requires a central venous pressure catheter, for the intraoperative assessment of volaemia in neurosurgical patients. These authors found a poor sensitivity and a poor specificity of indices such as the central venous pressure, the heart rate variability, and the non-invasive arterial pressure to predict fluid responsiveness in those patients.21 Static parameters such as right atrial pressure, pulmonary artery occlusion pressure, right ventricular end-diastolic volume, and left ventricular end-diastolic area often fail to predict fluid responsiveness in ICU patients,11 and those findings have been confirmed in normal subjects.22 In neurosurgical patients, diuresis monitoring cannot be used as an indicator of volaemia as far as mannitol administration, after having induced a phase of hypervolaemia through its osmotic effect, artificially forces urine output independently from actual volaemia, and therefore breaks the link between diuresis and volaemia. For all these reasons, we decided to use the so-called ‘dynamic parameters’ (i.e. parameters which evaluate the patient's status beat after beat and, by extension, the index derived from the changes in arterial pressure induced by the mechanical ventilation), for assessing volaemia during intracranial surgery. In those conditions, two parameters can be obtained from the patient routine monitoring equipment: the DD, easy to use but poorly validated in anaesthesia practice, and the DPP, more studied,7,23 but not so easy to calculate.
In this study, two consecutive measures of DPP>13% occurred at variable moments during the procedure. The observed cumulative incidence of that event increased regularly over time, and did not reach a plateau. The maximum observed cumulative incidence was less than 1 per patient and per hour of procedure. We were not able to evidence any significant difference between patients having received mannitol and those having not. However, given the small number of patients having not received mannitol (five patients), this finding probably deserves additional investigation for power reason. All these elements stress the fact that hypovolaemia may occur at any time during the procedure, and that the probability of hypovolaemia increases with the length of surgery. Several factors such as those mentioned above (fasting, mannitol, bleeding, diuresis, …) may affect the incidence of hypovolaemia. Therefore, we can reasonably recommend the measurement of DPP or DD at a rate of 1 h−1 during the procedure. However, the rate of measurement could be increased, according to bleeding or excessive diuresis.
In addition to the excellent comparative results obtained in this study, there are two reasons for proposing to use DD instead of Delta PP as an index of volaemia in neurosurgical patients. The first reason is its facility and rapidity for use at any time, compared with DPP, which requires more complicated mathematical operations (Fig. 2), and also its use for more sophisticated techniques such as transoesophageal echocardiography,12 or abdominal echography of the inferior vena cava.24 The second reason relies on what has been called the Delta Up by Perel and colleagues16 (Fig. 1). This index corresponds to the amount of blood ‘sequestered’ in the lung and driven out in the left heart during mechanical inspiration.6 This sequestered amount of blood, which does not actually contribute to the effective volaemia, influences the calculation of the DPP but not that of the DD. Finally, it is interesting to note that when DD was >5 mm Hg and DPP<13% in this study, the two following measures showed a DD>5 mm Hg and a DPP>13%. This observation could reflect a more rapid variation of DD than DPP in response to hypovolaemia, but this hypothesis deserves additional investigation. In these four cases, the DPP was between 8% and 13%, which could be in agreement with the intermediary zone of DPP described by Solus-Biguenet and colleagues.9
In conclusion, the present study showed that DD performs equally to DPP to assess hypovolaemia and predict responsiveness to FL in patients undergoing intracranial surgery. Regarding DD, a threshold of 5 mm Hg can be considered as a valuable value for the diagnosis of hypovolaemia and for initiating FL. The facility of DD calculation when compared with DPP and the results of the present study support its use during intracranial surgery.
Funding
Department of Anaesthesia and ICM, CHU de Liège, Sart-Tilman, Liege, Belgium.


