


Abstract
Despite knowing the threats posed by biological invasions, governments struggle to effectively prevent and control invasive species. To mitigate the negative impacts of invasive species, a coordinated response, grounded in the best available science and attentive to the dynamics of policymaking, is critical. To evaluate patterns in state policies, we conducted a comprehensive survey of invasion-related laws and regulations in 21 eastern US states. We identified 706 policy chapters and found that most were enacted after 1970. The policies on terrestrial invasions outnumbered those for aquatic habitats, although the states farther east generally had a higher proportion of aquatic policies. Across all of the chapters, we identified 1200 unique species, 523 of which are listed as introduced or invasive. The state policies were inconsistent in which invasive species they name, especially for invertebrate taxa. Our conclusions indicate that effective, coordinated actions on invasives require improving communication, collaboration, and data sharing within and across domains.
Biological invasions critically threaten natural and anthropogenic systems on a global scale. These invasions not only endanger biological diversity and ecosystem services, but they also adversely affect infrastructure, transportation, public health, and food security (Meyerson and Reaser 2003, McBeath and McBeath 2010, Mazza et al. 2013, Marsh et al. 2021). The escalating rate of nonnative introductions across taxonomic groups and biomes is anticipated to exacerbate the severity of invasive species impacts (Pyšek et al. 2020). Invasive species already incur significant economic costs stemming from direct and indirect socioecological impacts and management expenses (Diagne et al. 2021, Cuthbert et al. 2022a). North American jurisdictions have cumulatively spent more than US|${\$}$|520 billion on invasive species since 1970, and annual costs are rising (Diagne et al. 2021). Furthermore, the intricate links between invasive species and human activities, including the movement of people and goods (Levine and D'Antonio 2002, Epanchin-Niell et al. 2021), create a challenging regulatory landscape.
Regulatory efforts to prevent and control invasive species help mitigate biological invasions but ultimately fall far short of preventing all introductions and their subsequent impacts (Haack et al. 2014, Rabaglia et al. 2019, Branco et al. 2021). Key barriers to successful management include the lack of communication, collaboration, and data sharing among stakeholders (Epanchin-Niell et al. 2010, Barney et al. 2019, Reaser et al. 2019, Beaury et al. 2020). In the United States, this challenge is increasingly addressed through the creation of interinstitutional entities such as the National Invasive Species Council (NISC). One of the aims of the NISC is to increase the domestic capacity to respond to invasive species through policy recommendations and coordination among diverse stakeholders. Central to these efforts is the shared access to and collaborative synthesis of data (DOI 2016, Wallace et al. 2020). However, such efforts can be hampered by intermittent financial support (Simpson et al. 2006, Jarnevich et al. 2015). For example, the US Federal Invasive Species Advisory Council was defunded in 2019 (Simberloff et al. 2020) and reestablished in 2021 (National Invasive Species Information Center 2023). A lack of consistent funding for data-sharing services can limit the scope and relevance of information. This is especially concerning for invasive species prevention and management, in which agencies and other actors require immediate access to up-to-date information for coordinated rapid response efforts across levels of government (DOI 2016).
The need for better communication and information systems is evinced by the lack of cohesion in invasive species policies. Previous work has examined policy consistency among US states for various invasive taxa, including plants (McCubbins et al. 2013, Quinn et al. 2013, Fox and Gordon 2017, Lakoba et al. 2020, Beaury et al. 2021, Bradley et al. 2021), aquatic species (Doelle 2003), animal diseases (Allen 2012), and insects (Klizentyte et al. 2021). These studies have largely found that state policies are incongruous, even among adjacent states. For example, Beaury and colleagues (2021) found that, on average, a mere 17% of invasive or noxious plant species are regulated between pairs of neighboring states. Some states wholly lack regulatory mechanisms for an invasive taxa, such as Georgia, which does not have a state noxious weed list, although its adjacent states have lists of 9 (Tennessee) to 56 (Florida) species (Lakoba et al. 2020).
In the present article, we undertake a holistic, open-ended examination of codified policies relevant to invasive species for 21 US states. This approach complements and builds on previous research that focused on specific taxa and demonstrates the utility of policy analyses to communicate key themes to a wide range of stakeholders. We first compiled a comprehensive repository of statutes and regulations relevant to invasive species for 21 contiguous eastern US states from Maine to Florida. We focused our efforts on statutes and regulations because they are codified and therefore publicly available on state websites and in legal databases. Codified laws and regulations are organized in comprehensive, unified frameworks, making these codes some of the most accessible policy documents for stakeholders. Within and among these 21 states, we evaluated trends, including when codified policies were enacted, the habitats to which they apply, and the species listed (if any). This approach allows us to examine policy consistency across taxonomic groups to better identify gaps in legislation and the regulation of invasive species across states. An understanding of such inconsistencies is important because they may lead to inadequate and incongruous responses to invasive species, which can have serious ecological, economic, and cultural impacts (Doelle 2003, McCubbins et al. 2013, Quinn et al. 2013, Grove and Moltz 2019, Beaury et al. 2021, Bradley et al. 2021). Furthermore, identifying these gaps can help guide efforts to improve communication, coordination, and data sharing across governments, agencies, and stakeholders.
Structure of state policies
Federal and state governments have two types of codified policies. Statutes are laws enacted by a legislative body, whereas regulations are rules written by administrative agencies without direct legislative review. Regulations are granted legal authority through statutes and therefore carry the force of law (Allen 2012). We chose to restrict our analysis to codified statutes and regulations because they are consolidated into current, reliable legal databases (e.g., Thomson Reuters Westlaw) and because they represent directly enforceable laws (Coupette et al. 2021). We did not include other policy documents, such as constitutions, court rulings, guidance documents, and uncodified regulated species lists maintained by state agencies. Although this approach will miss some actions on invasive species, it provides a comprehensive framework of policy information that is accessible and collated, which is not always the case. For example, most states have noxious weed lists (Lakoba et al. 2020), but the location and authorities of these lists vary, with some states including them in their regulatory codes (e.g., Alabama), statutes (e.g., Connecticut), or elsewhere. The Massachusetts noxious weed list is not codified and can only be found through their government website. Similarly, Virginia has an invasive plant list in addition to their noxious weed list, but the former is only available via the state's Department of Conservation and Recreation website.
Although codified policies provide a good framework to compare invasive species laws among states, there are still organizational differences that must be considered. Statutory codes are formatted similarly across states, but the structure of regulatory codes varies drastically among and, at times, within state codes. For example, North Carolina's Department of Agriculture and Consumer Services regulations are organized into chapters and subchapters, whereas Mississippi's agriculture and commerce regulations are divided into parts, subparts, and chapters. To control for such differences, we aggregated state policies in the database to a roughly common unit following the methodology of the State RegData data set version 4.0 (McLaughlin and Nelson 2021). The common unit, hereafter referred to as a chapter, is appropriate for among-state analyses, because chapters have similar levels of topic specificity (e.g., division of fish and wildlife: wildlife; environmental protection: water resources, invasive plants) that retain policy detail while minimizing variability from structural differences in state codes.
State policy database
We identified invasive species-related policies in our targeted 21 eastern US states (table 1) using the Thomson Reuters Westlaw database. We conducted our data extraction between May 2020 and August 2021. We did not include policies that had been repealed prior to the search period. To identify relevant policies, we used a suite of search terms containing common synonyms for invasive species, akin to those described by Herrick (2019). Our final search terms were invasive, weed, pest, introduced, nuisance, non(-)indigenous, non(-)native, exotic, alien, noxious, and quarantine. We manually reviewed policy text to ensure that they included at least one search term in the context of invasive or introduced species before adding to the database. This approach allowed us to quickly exclude policies not relevant to invasive species, such as human quarantines, nuisance sound levels, and exotic dance venues (figure 1).
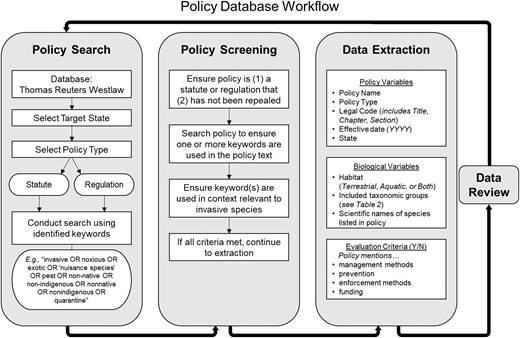
Workflow for searching, screening, and extracting data from invasion-related policies. We identified policies using the Thomson Reuters Westlaw database using key search terms relevant to biological invasions. We then screened policies to ensure that they used one of the search terms in the policy section text in an invasion context before extracting data and evaluating the content criteria. After initial extraction, all database entries were reviewed by a single screener.
List of the 21 states in the invasive species policy database and the number and percentage of chapters that contain policies pertaining to invasive species, including the number of statutory and regulatory chapters.
| All Chapters | Statutes | Regulations | |||||
|---|---|---|---|---|---|---|---|
| State | Abbreviation | Count | Percentage | Count | Percentage | Count | Percentage |
| Florida | FL | 78 | 2.32 | 21 | 3.31 | 57 | 2.09 |
| Virginia | VA | 46 | 1.81 | 15 | 1.12 | 31 | 2.56 |
| South Carolina | SC | 25 | 1.69 | 18 | 1.42 | 7 | 3.29 |
| Vermont | VT | 36 | 1.56 | 19 | 1.46 | 17 | 1.68 |
| Delaware | DE | 32 | 1.46 | 17 | 1.49 | 15 | 1.43 |
| New Hampshire | NH | 32 | 1.41 | 12 | 0.94 | 20 | 2.00 |
| Mississippi | MS | 25 | 1.39 | 15 | 1.30 | 10 | 1.55 |
| Rhode Island | RI | 43 | 1.26 | 15 | 0.65 | 28 | 2.51 |
| Connecticut | CT | 26 | 1.21 | 14 | 1.49 | 12 | 1.00 |
| Massachusetts | MA | 26 | 1.08 | 5 | 0.83 | 21 | 1.17 |
| New Jersey | NJ | 29 | 1.02 | 10 | 0.54 | 19 | 1.89 |
| North Carolina | NC | 26 | 1.00 | 16 | 0.69 | 10 | 3.48 |
| Maine | ME | 41 | 0.97 | 22 | 1.04 | 19 | 0.90 |
| Tennessee | TN | 26 | 0.96 | 9 | 0.76 | 17 | 1.12 |
| Georgia | GA | 15 | 0.89 | 8 | 0.93 | 7 | 0.70 |
| Kentucky | KY | 39 | 0.88 | 8 | 1.77 | 31 | 0.77 |
| Alabama | AL | 28 | 0.87 | 10 | 0.74 | 18 | 0.97 |
| Pennsylvania | PA | 32 | 0.86 | 15 | 0.84 | 17 | 0.87 |
| Maryland | MD | 33 | 0.82 | 12 | 1.74 | 21 | 0.63 |
| New York | NY | 47 | 0.66 | 19 | 0.82 | 28 | 0.58 |
| West Virginia | WV | 21 | 0.58 | 8 | 0.41 | 13 | 0.78 |
| Mean | 33.62 | 1.17 | 13.67 | 1.16 | 19.76 | 1.52 | |
| Total | 706 | 1.10 | 288 | 1.00 | 418 | 1.18 | |
Note: The states are arranged from the highest to lowest percentage of invasion-related policy chapters in their legal codes.
After screening, we extracted the following variables from relevant policies (figure 1): state, policy name, type of policy (statutory or regulatory), legal code, effective date (year), habitat (aquatic, terrestrial, or both), and the scientific names of included taxa. The policies were checked by at least two reviewers to ensure that all statutes and regulations within a state were recorded and correct. For our analysis, we only included policies relevant to invasive or introduced flora and fauna, excluding those only relevant to pathogens. This choice is consistent with other invasion biology publications (e.g., Pyšek et al. 2008, Jeschke et al. 2013, Dunn and Hatcher 2015, Vilcinskas 2015). Despite removing pathogenic species, we still captured many policies relevant to invasive pathogens, because these policies included the pathogens’ vectors, many of which are invasive species. Indeed, the ability to spread disease can be a primary reason an introduced species is characterized as invasive (e.g., mosquito species; Chinchio et al. 2020, Foster et al. 2021, Najberek et al. 2022).
We cross-referenced scientific names with the Global Biodiversity Information Facility (gbif.org) to obtain the taxonomic classification (kingdom, phylum, class, order, and family), to correct misspellings, and to update the species to match their accepted scientific names and remove synonyms. Because we were focused on invasion-related policies and not the species themselves, we retained all taxa listed in a policy, even those that are not invasive or introduced in the United States. For example, many states have policies on exotic pets, which contain lists of vertebrate species that are prohibited or that require permits in that state. Such lists tend to include both problematic invasives and species of conservation or safety concern. For example, in Kentucky's regulation on prohibited exotic wildlife, they have a list of species prohibited because of their potential to be injurious (e.g., nutria) and a list of species prohibited because they are inherently dangerous (e.g., Komodo dragons; Kentucky General Assembly 1974). However, other states group all prohibited species into a single list (e.g., New Jersey; Legal Information Institute 1991).
We compared species lists among all states, regardless of their invasion status, to determine whether certain species or taxa were more consistently named in invasion-related policies than others. We also assessed whether these patterns changed for the subset of species that are introduced or invasive. To determine invasion status, we compiled a reference list from the US Register of Invasive and Introduced Species (US-RIIS) version 2.0 for the contiguous United States (Simpson and Eyler 2018, Simpson et al. 2022) and from the USGS Nonindigenous Aquatic Species database (NAS; Nico et al. 2022) for the 21 states we examined. We integrated species from the NAS because the US-RIIS only includes species that are not native to any part of the United States, whereas the NAS includes aquatic transplants within the country. For example, Oncorhynchus mykiss (rainbow trout) is native to West Coast watersheds but is invasive elsewhere in the United States (Hartman and Larson 2022, Fuller et al. 2023). The NAS added an additional 255 species not included in the US-RIIS.
We analyzed policy data to identify patterns vis-à-vis the hypotheses introduced in the next section. For all analyses, we used R statistical software v4.1.1 (R Core Team). In cases in which we tested the relationships between variables, we used a generalized linear model with a quasibinomial distribution, which accounts for over- or underdispersed proportion data, implemented in the MASS package in R (Venables and Ripley 2002) and estimated explained variance using McFadden's pseudo-R2 (residual and null deviance).
Guiding hypotheses for invasive species policy
Our analyses were guided by several hypotheses concerning differences among states. By addressing these hypotheses, we aim to offer a comprehensive understanding of the intricate dynamics surrounding invasive species policies and reveal actionable insights for targeted and more effective policy interventions.
The first hypothesis is that the number and proportion of invasion-related chapters in policy codes vary among states and between regulatory and statutory codes. Understanding the variation in invasion-related chapters can identify disparities in regulatory approaches and indicate the relative importance of invasive species management among states. To find the proportion of invasion chapters in a state's code, we calculated the total number of unique chapter documents from State RegData (McLaughlin and Nelson 2021).
The second hypothesis is that the number of newly enacted policies related to introduced and invasive species varies over time, indicating a temporal trend in policy focus on these issues. Investigating the temporal patterns invasive species policies can provide insight into the evolving recognition of these ecological threats in a broader historical context. We modeled temporal changes in policy effective dates using the proportion of new policy chapters passed each year as our response variable. We included the effective year and policy type (regulation or statute) as predictors. Because sections of the policy chapters may have different effective dates, we estimated the effective year for a chapter by taking the geometric mean of dates for its constituent sections.
The third hypothesis is that the proportion of policies explicitly applied to aquatic systems varies among states on the basis of their geography, reflecting regional differences in policy emphasis. We were interested in policies relevant to aquatic invasive species for several reasons. First, the states we surveyed include the country's richest hotspots for freshwater biodiversity (Jenkins et al. 2015), and freshwater systems are among the most imperiled by global change (Ricciardi and Rasmussen 1999, Jenkins 2003). Recent research on aquatic invasive species has shown that they are among the most economically costly (Cuthbert et al. 2021, Fantle-Lepczyk et al. 2022). In the present article, our response was the proportion of aquatic chapters within each state and the predictor variables were the latitude and longitude of states’ centroids (Rogerson 2015) and their interaction. Prior research on regulated plant lists did not reveal spatial patterns among state policies for shared species (Lakoba et al. 2020, Beaury et al. 2021), but this has not been investigated for habitat type across taxa.
The fourth hypothesis is that the taxonomic classification (plant, invertebrate, vertebrate) influences the frequency of invasive species named in state codes, leading to variations in policy attention across different taxa. As we previously mentioned, past research shows that states’ noxious weed and invasive plant listings are discordant (McCubbins et al. 2013, Quinn et al. 2013, Fox and Gordon 2017, Lakoba et al. 2020, Beaury et al. 2021, Bradley et al. 2021). However, this question has not been addressed for codified state policies or for invasive animal species. Using our database, we not only expand among-state comparisons to nonplants, but we are also able to directly compare the degree of consistency among taxa and contribute to an informed understanding of taxon-specific policy concerns for invasive species. For this analysis, we delineate between all species listed in an invasion-related policy and those species that appear in the US RIIS or NAS databases.
The current state of invasive species policy in the eastern United States
Across the 21 states in our database, we identified patterns in invasive species policy that reflect both the range of industries and sectors affected by introduced and invasive species and the complexities of state-level policymaking. The nature and scope of invasive species policies varies among the 21 surveyed states. We identified 706 invasion policy chapters, and policies per state ranged from 15 in Georgia to 78 in Florida. State-level differences in legal code structure and organization preclude the direction comparison of policy count data among the states. For example, Florida had the highest proportion of invasion chapters within its policy codes (2.3%), whereas West Virginia had the lowest (0.6%), consistent with differences in policy count. In contrast, New York had 47 invasion chapters, the most after Florida, but these policies make up only 0.7% of New York's legal codes, the second lowest across the 21 states (table 1).
Collectively, the 706 chapters in our database span 112 years of invasive species policymaking. The earliest chapter to be enacted is a New York statute from 1910, which calls for the removal of the creeping thistle Cirsium arvense and other noxious weeds. The rate of new invasive species policies has accelerated over time, driven in part by an increase in regulatory policies starting in the 1970s (pyear < .0001, ppolicy type< .0001, pseudo-R2 = .39; figure 2). The timing coincides with the rapid spread of invasive species over the past half century (Seebens et al. 2017, Seebens et al. 2018) and the consequent increase in invasion-related research beginning in the 1980s (Pyšek and Richardson 2010, Meyerson et al. 2022).
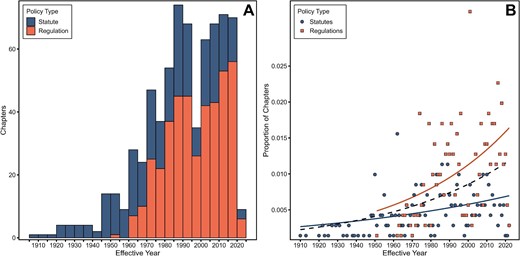
Relationship between the number of new statutory and regulatory policy chapters and effective date. The histogram (A) shows the increase in new policies, particularly regulations, starting in the 1970s. (B) Both year and policy type are correlated with the proportion of newly enacted state invasion policies (pyear < .0001, ppolicy type < .0001, pseudo-R2 = .39; quasibinomial distribution). The dashed black line shows the trend between year and new policies irrespective of policy type, whereas the solid lines show the correlation between year and new regulations or statutes.
We identified two important inflection points in the history of invasive species policy. The first occurred within the same decade that Elton coined the term invasive species (figure 2; Elton 1958, Richardson and Pyšek 2008). The next wave of invasive species policies began in the 1970s (figure 2). This increase is coincident with President Carter's 1977 “Exotic Organisms” Executive Order (Federal Register 1977) and several important environmental acts in the United States, such as the National Environmental Policy Act (NEPA; 1969), the Clean Water Act (1972), the Endangered Species Act (1973), and the creation of the federal Environmental Protection Agency in 1970. These acts all have important implications for invasive species management, although they may not reference invasive species explicitly (Johnson et al. 2017, Herrick 2019). They also emphasize the conservation-related threats posed by invasive species, whereas most prior federal policy primarily centered around agriculture, with some exceptions such as the 1900 Lacey Act (Johnson et al. 2017, Herrick 2019). For example, NEPA requires federal agencies to consider the environmental impacts of potential actions, including those from invasive species (Johnson et al. 2017). Although the mechanism for the concurrent trends between states’ invasive species policies and these federal acts is not clear, the net effect was an increase in legislation aimed at managing invasive species.
We also found variation in the timing and pace at which states accumulated policies related to invasive species. Among the adjoining triad of Alabama, Georgia, and Florida, Florida passed its first invasive species policy in 1959, more than 30 years after Alabama (1927) and Georgia (1920). However, Florida presently has more chapters on invasive species than both states, both in count and proportion of total policy chapters (table 1). This discrepancy underscores that the timing, motivation, and significance of invasive species action can differ among states, regardless of proximity.
Invasion policies focus on terrestrial systems
Despite recent investment in aquatic invasion research (Havel et al. 2015, Gallardo et al. 2016, Cuthbert et al. 2022b), invasive species policies primarily concern terrestrial systems. Only 15.4% of chapters across all states apply solely to aquatic environments, whereas nearly half (351 chapters, 49.7%) exclusively address terrestrial environments. The remaining 246 chapters on invasions either reference both habitats or do not specify the system. Only one state, New Hampshire, had more aquatic policies than terrestrial (10 versus 9 chapters, respectively, with 13 chapters applied to both habitats). In contrast, 10 out of 15 of Georgia's policies were exclusive to terrestrial habitats, and none explicitly concerned aquatic invasions, despite having an aquatic nuisance species management plan (Georgia's Aquatic Nuisance Species Advisory Committee 2009).
The proportion of a state's invasion policies in aquatic systems was related to its geographic position: states farther east have more chapters on aquatic invasions (plongitude = .001, pseudo-R2 = .42; figure 3). This trend may reflect coastal states’ dependence on shipping trade and fisheries, which can be affected by invasions (Levine and D'Antonio 2002, Hulme et al. 2008, Hulme 2009).
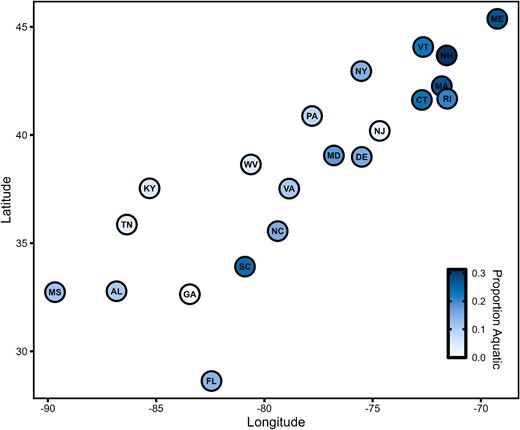
Patterns in the proportion of policy chapters focused exclusively on aquatic invasive species. State centroidal latitude and longitude correlated with the proportion of policy chapters focused exclusively on aquatic invasive species. States farther east had a greater fraction of aquatic policies (plongitude = .001, pseudo-R2 = .42; quasibinomial distribution).
It is unclear whether the uneven proportion of aquatic to terrestrial policies reflects or challenges scientific understanding of biological invasions. On one hand, aquatic organisms only represent approximately 26% of invasive species (Cuthbert et al. 2021). If the number of invasion-related policies in each habitat corresponds to the number of invasive species in that habitat, then US state policies align with biological knowledge. Certainly, the taxonomic classifications of aquatic invasive species listed in state policies match those of the region. We identified 187 unique species from invasion policies on aquatic systems, the majority (56%) of which were fishes. This trend is consistent with biological surveys conducted by Cuthbert and colleagues (2022b), which found that ray-finned fishes (class Actinopterygii) were the most common class of vertebrate invaders in the Chesapeake Bay and the Great Lakes and St. Lawrence River.
Another consideration is the significant impact of terrestrial invasions on key industries such as agriculture and forestry. These industries have demonstrated their ability to successfully lobby for attention to address these threats (Crystal-Ornelas et al. 2021). However, the proportion of policies on a particular system or species may not reflect the budget and on-the-ground effort dedicated to management. Invasive species costs and impacts depend on both the species and the invasion context (Kumschick et al. 2014, Diagne et al. 2021). For example, Florida allocates more funds to manage invasive aquatic plant species than it does to terrestrial plants (Hiatt et al. 2019).
There is an array of potential explanations for the described trends, ranging from biological to economic to sociopolitical. However, we cannot evaluate potential drivers from this work. Further inquiry into this question illustrates an opportunity for transdisciplinary engagement and collaborative, actionable research on invasive species.
Disparities in regulated species and taxa
Supporting previous studies on invasive and noxious plant policies (McCubbins et al. 2013, Quinn et al. 2013, Fox and Gordon 2017, Lakoba et al. 2020, Beaury et al. 2021, Bradley et al. 2021), our analyses show a lack of consistency among state regulated species lists across a broader range of taxa. In fact, animal and invertebrate species listings were even more disparate than plants among states.
Less than half (44%) of policies name a specific organism at the species, genus, or family level. Many policies refer to taxa at a higher classification. For example, policies related to plant pests may define pest as plants and invertebrate animals that injure beneficial plants. Other policies did not refer to specific taxa at all. Common cases include policies that use blanket terms such as pest and invasive without a definition or taxonomic specification. Regulations are more likely to name species than statutes (50.2% and 35.4% of policies, respectively), reflecting their different purposes and policy processes. Statutes are generally enacted more slowly than regulations because they are written and passed through state legislative bodies, which require proposals, debate, amendments, and multiple votes before reaching the governor for approval. Consequently, they are often designed to issue broad statutory authority. In contrast, regulatory policies can be codified more quickly and typically address more specific issues.
Across all policies, we identified 1200 unique species in 926 genera: 708 animals and 492 plants (table 2). There were 452 vertebrate species in the database, making up 64% of animals and 38% of all species. Of the species named, 523 (44%) are also listed in either the US-RIIS or the NAS. It is difficult to assess the status of the remaining 677 species wholly. These two lists are not comprehensive, especially for nonaquatic organisms that are native somewhere in the United States but are invasive elsewhere. Of the species not on the US-RIIS or NAS listed, 467 appear in only one state. The more common species include native noxious weeds, such as Solanum carolinense (Carolina horsenettle, 18 states), the invasive subspecies, such as Apis mellifera scutellata (hybridized honeybee, 15 states), and hybridized plant species, such as Sorghum almum (Columbus grass, 10 states). Of the species that are characterized as introduced or invasive in the US-RIIS and the NAS, there were 317 plants, 133 invertebrates, and 73 vertebrates. Therefore, of all the plants, invertebrates, and vertebrates we identified, 51.9%, 64.4%, and 16.2%, respectively, are listed as introduced or invasive.
Count and percentage of all species and of the invasive and introduced species in the policy database, divided by taxonomic groups.
| All | IIS | |||
|---|---|---|---|---|
| Taxon | Count | Percentage | Count | Percentage |
| Plant | 491 | 41.2 | 317 | 60.6 |
| Animal | 701 | 58.8 | 206 | 39.4 |
| Vertebrate | 444 | 37.2 | 72 | 13.8 |
| Fish | 238 | 20.0 | 31 | 5.9 |
| Amphibian | 14 | 1.2 | 4 | 0.8 |
| Reptile | 40 | 3.4 | 8 | 1.5 |
| Bird | 62 | 5.2 | 16 | 3.1 |
| Mammal | 90 | 7.6 | 13 | 2.5 |
| Invertebrate | 257 | 21.6 | 134 | 25.6 |
| Mollusk | 22 | 1.8 | 13 | 2.5 |
| Arthropod | 231 | 19.4 | 119 | 22.8 |
| Insect | 180 | 15.1 | 101 | 19.3 |
| Crustacean | 23 | 1.9 | 9 | 1.7 |
| All | 1192 | 100.0 | 523 | 100.0 |
Note: We classified a species as introduced or invasive if it was listed in either the United States Register of Introduced and Invasive Species (US-RIIS; Simpson et al. 2018, 2022) or the USGS Nonindigenous Aquatic Species database (US Geological Survey 2023). Abbreviation: IIS, introduced and invasive species.
The relative paucity of invasive vertebrates compared with plants and invertebrates is due in part to our decision to include all species listed in a policy; the focus of the database is invasion-related policies and not specifically invasive species themselves. The species lists therefore include both endangered and exotic (but not necessarily established) species, and such species are primarily macrofauna. There are two common policy types that contribute to the high proportion of noninvasive vertebrates. First, many states have extensive lists of fish that can and cannot be used as bait, including both native and nonindigenous species. Second, several states have policies on ownership and trade of exotic animals that include extensive species lists. Captive and companion vertebrates are more highly regulated than invertebrates (Harrington et al. 2021, Mazzamuto et al. 2021). In addition, both the federal government and many states regulate species through blacklist laws. The contents of these laws only apply to species explicitly named therein, as opposed to whitelist laws, where the policy applies to all species unless they are listed as exempt (Patoka et al. 2018).
As opposed to vertebrates, invertebrate species are underrepresented in state policies. Invertebrates make up 49% of the species listed in the US-RIIS and NAS databases but only 25% of the introduced and invasive species in state policies (table 2). Invertebrates are often referenced in these policies at broad taxonomic levels not included in our analyses (e.g., “thrips,” “nematodes”), or colloquially with terms related to their impact, rather than their taxonomy (e.g., “wood destroying organisms,” “leaf miners”). The policies that do name specific invertebrates tend to do so in the context of noncodified quarantine orders and emergency management efforts directed at a single or small group of species.
In addition, policy codes are inconsistent in which species they regulate among states. Of the 1200 species in our database, 706 are named solely in one state, and only 32 species appear in policies of 10 or more states, just 2.7% of the species in the database. One potential explanation for inconsistency of regulated invasive plants is that the United States only allows for species to be added to the federal noxious weed list if there are control or prevention methods already in place (Code of Federal Regulations 2010), and some states’ noxious weed lists are limited to the federal list (e.g., Rhode Island; Lakoba et al. 2020). Three species were listed in all 21 states: Cirsium arvense (creeping thistle), Elymus repens (quackgrass), and Apis mellifera (western honeybee). Interestingly, all three species are nonnative to the United States, but although the two plant species are invasive and considered economically and ecologically detrimental, the nonnative honeybee is valued for its pollination services. The honeybee was included in our database because policies in all states included verbiage related to nonnative pests, competitors, and parasites of the species, such as Apis mellifera scutellata (hybridized honeybee, listed in 15 states) and Acarapis woodi (tracheal mite, listed in 11 states). Therefore, Apis mellifera is included in policies to elicit protection, further underscoring the challenges of conducting policy analysis in this domain.
Of the 523 out of 1200 species considered introduced or invasive in the US-RIIS and NAS, 239 are listed in a single state. More intriguing, however, is the possibility that an introduced or invasive species will be named in only one state is related to its taxonomy: Invertebrates are the most likely to be identified in a single state (59% of 135 species), whereas vertebrates are the least (33% of 78 species). The lack of continuity among state policy codes on invasive insect species is incompatible with the level of damage invasive arthropod pests incur in the United States (Aukema et al. 2010, 2011, Lovett et al. 2016). Some of the discrepancy may be due to the geographic ranges of invasive insects and the habitat suitability of the invaded areas (Liebhold et al. 2013). However, this explanation is unlikely to fully account for the underrepresentation of invertebrate taxa. Invasive insects are estimated to cost the United States |${\$}$|126 million annually and are the most expensive taxon to the forest industry in both the North- and Southeast (Fantle-Lepczyk et al. 2022). Relatedly, Liebhold and colleagues (2013) found that invasive forest pest species are most concentrated in the Northeast. In contrast, the two states that listed the most invasive invertebrates in their policies were Mississippi (61 species) and Florida (47 species). Concerningly, many invasive insects are already found in the contiguous United States, even if they are absent in certain states (Paini et al. 2010). These species therefore not only pose a high risk of establishment in new states but are also less likely to be subject to the same biosecurity and sanitation protocols as populations imported internationally (Paini et al. 2010, Lovett et al. 2016). Collectively, these threats demonstrate a need for coordinated action among states, although this is not reflected in state policy codes.
These inconsistencies also reflect different levels of policy action among states. There are regulatory mechanisms to control invasive species outside state statutory and administrative codes, including noxious weed lists, emergency quarantine actions, management plans, and federal laws. For example, the red imported fire ant Solenopsis invicta has been detected in 10 of the states in our database (EDDMaps 2023), but it is named in only five policy codes (Alabama, North Carolina, South Carolina, Tennessee, and Virginia). However, all states within the fire ant's distribution are required to regulate the species under federal rule 7 CFR 301 subpart P (Code of Federal Regulations 1992).
Other species of concern are those that are known to be highly invasive but are either rarely listed in policy codes or listed in all but several state codes. For example, Salmo trutta (brown trout) and Linepithema humile (Argentine ant) occur in at least 11 of the 21 surveyed states and are also among the International Union for Conservation of Nature’s worst 100 invaders (Wetterer et al. 2009, GISD 2022). However, these species are not federally regulated and are only listed in policies for one or two states (S. trutta: New Hampshire, North Carolina; L. humile: Mississippi). In contrast, Agrostemma githago (corncockle), also not federally regulated, is listed in all state codes we examined except for Virginia and Connecticut. These patterns may indicate that state policies are incongruous with biological risk, suggesting that invasive species policymaking relies more on state standard processes wherein biological information is a contributor and not a driver. Whether these examples and patterns represent broader trends across state policies will require further investigation facilitated by the policy database.
Conclusions
Establishing coordinated efforts is broadly recognized as central to invasive species prevention, management, and mitigation strategies (Hulme 2016, Federal Register 2021). This priority is reflected in US federal actions, such as the Noxious Weed Control and Eradication Act of 2004, which created a USDA grant program to fund eradication efforts tackling harmful weeds, and the 2022 America the Beautiful challenge, which includes |${\$}$|25 million for invasive species management. However, there remains a conspicuous lack of cohesive federal policy to guide national and state actions on invasive species (Klizentyte et al. 2021).
Simultaneously fostering cross-disciplinary literacy and devising tools for data access is fundamental to these efforts. By developing an invasive species policy database by and for biologists, policymakers, and other stakeholders, we have reduced the barrier of technical legal language to provide easy access to biologically relevant policy information. In the present article, we have identified several patterns that merit further investigation. Specifically, we emphasize the incongruities in regulated invasive species among states and across taxa, especially invertebrates. A lack of shared species could indicate a need for information-sharing resources and infrastructure to facilitate interstate coordination (Lodge et al. 2006, Dresser and Swanson 2012, Barney et al. 2019).
However, we must also avoid assuming that gaps in invasive species policy are solely due to information deficits. Instead, policies may be more political, reflecting the interests and priorities influencing legislative and regulatory bodies and the unpredictability inherent in these sometimes messy processes. We argue that more transdisciplinary research is needed to identify the roles of research and policy in shaping invasive species management outcomes. We anticipate that effective, collaborative, stakeholder-driven research in this area would support decision-making, rapid response, and information-sharing tools. Providing policymakers, resource managers, government agencies, and fellow scientists with comprehensive, up-to-date information is critical given the current rise in new invasive species introductions and the increase in economic, health, and ecosystem harm they cause (Seebens et al. 2017, Seebens et al. 2018). A rigorous analysis of the actors and subsystems at play in this important policy arena is sure to yield new insights into how and why states do or do not adopt various possible statutes and regulations they do to tackle invasive species.
Acknowledgments
We gratefully acknowledge funding from the Virginia Tech Policy Destination Area's +Policy Fellowship, awarded to TS and JNB, which provided funding for SC, CB, PA, AH, AK, and GS to compile the database. We also thank the Global Systems Science Destination Area at Virginia Tech, Fralin Life Science Institute, and the Global Change Center for generously providing funding support for this effort and the Invasive Species Working Group. We thank RJ Sussman for editorial and visualization support. Finally, we are grateful for the time of the handling editor and three anonymous reviewers, whose comments greatly improved the quality of the manuscript.
Author Biography
Emily M. X. Reed ([email protected]), Jacob N. Barney, Bryan L. Brown, David C. Haak, Scott Salom, and Todd Schenk are affiliated with the Global Change Center's Invasive Species Working Group in the Fralin Life Sciences Institute; Sara Cathey, Cameron Braswell, and Bryan L. Brown are affiliated with the Department of Biological Sciences; Prashasti Agarwal, Jacob N. Barney, A Heminger, Gourav Sharma, and David C. Haak are affiliated with the School of Plant and Environmental Sciences; Ayda Kianmehr and Todd Schenk are affiliated with the School of Public and International Affairs; and Scott Salom is affiliated with the Department of Entomology, all at Virginia Tech, in Blacksburg, Virginia, in the United States.
