


Abstract
The global resurgence of coronaviruses and the move to incorporate COVID-19 vaccines into the expanded program for immunization have warranted for a high-throughput and low-cost assay to measure and quantify mounted neutralizing antibodies as an indicator for protection against SARS-CoV-2. Hence, we evaluated the surrogate-virus-neutralization-assay (sVNT) as an alternative assay to the pseudo-virus neutralization assay (pVNT). The sVNT was used to measure neutralizing antibodies among 119 infected and/or vaccinated blood samples, against wild-type SARS-CoV-2 (WT) and the Omicron-variant with reference to the pVNT. Four different cut-offs were assessed for suitability in distinguishing neutralizers: the manufacturer (>30%), literature-based (>50%) and (>80%), and population-based (>27.69%). The obtained data was analyzed using “R” through its integrated development environments; JAMOV and R-Studio. Using the WT strain, only the population-based cut-off was able to differentiate neutralizers from non-neutralizers beyond chance, with an area under the curve (AUC) of 0.833 (95%CI, 0.505–1.0; P = .049). Applying the population-based cut-off, improved the sensitivity to 100% from 91.4% obtained from the manufacturer cut-off (P = .002). However, the specificity remained low (67%). The negative-predictive-value also improved to 100% vs 16.4% (P = .006), but there was no difference in the positive-predictive-value (99.1% vs 99.1%) (P = .340). When we used the Omicron-variant, the sVNT titers were not able to predict the neutralizers and non-neutralizers with reference to pVNT (AUC of 0.649) (P = .221). The sVNT assay is a potential alternative for screening individuals harboring potent neutralizing antibody with high sensitivity, although we recommend continuous improvement of the assay in line with the viral mutations. Further, we recommend that individual users establish a population-based cut-off while using the sVNT assay.
Background
During the early phases of the coronavirus pandemic in 2019–2020, the World Health Organisation (WHO) named testing, isolation, and contact tracing as the backbone of the pandemic response [1]. As a result of this global move, unprecedented number serological and molecular commercial testing platforms were developed to cater for this need [2, 3], creating a demand for continued population-based evaluations before mass use.
Four years post pandemic, COVID-19 is no longer a public health emergency of international concern although the Omicron variants persist globally with increased transmissibility and enhanced immune escape [4]. Because of this the coronavirus vaccine has been added among the recommended vaccines in the expanded program for immunization globally [5]. Both the emergency of the immune escape Omicron variant and administration of COVID-19 vaccines highlighted the need to assess immune correlates necessary for continued protection, in the face of the current evolving variants and potentially another SARS-associated coronavirus pandemic or epidemic. Neutralizing antibody has been named as the immune correlates of protection against SARS-CoV-2, whereby participants with a geometrical mean concentration of 197.5 [181.9–214.4] remained uninfected with coronavirus compared to those with lower mean [6]. Hence, showing the direct presence of neutralizing antibodies is crucial for vaccine evaluation and sero-surveillance especially in sub-Saharan Africa where coronaviruses are endemic [7].
Conventional methods for functional assessment of neutralizing antibodies require challenging the patient antibodies with a replicating SARS-CoV-2 (live-virus neutralization assay) or a non-replicating virus with SARS-CoV-2 spike (pseudo-virus neutralization assay—pVNT) [8]. The ability to adopt and use these methods in Tanzania and similar settings is limited because of the cost, long assay time, and the requirement of specialized containment facilities. Alternatively, the surrogate neutralization assay is a high throughput automated enzyme linked immunosorbent assay (ELISA) with a fast turn-around time. The assay relies on competitive inhibition of neutralizing antibodies, in the interaction between the receptor binding domain (RBD) of the spike protein and angiotensin converting enzyme 2 (ACE2) cell receptors, similar to the conventional methods [8]. Hence, we evaluated the performance of the surrogate virus neutralization assay (sVNT) in detecting neutralization antibodies among convalescent and vaccinated participants with reference to the pVNT.
Materials and methods
Study site
Participants were recruited from the Muhimbili National Hospital, Mwananyamala, Temeke Regional Referral Hospitals, and Aga Khan Hospital in Dar-es-Salaam. Upon consent, the participants were requested to come to Muhimbili University of Health and Allied Sciences (MUHAS) in Dar-es-Salaam, Tanzania for blood collection. Plasma was separated within 30 min of collection and stored at − 80°C until time for testing. About 2–3 vials of 1.5 ml each were obtained from each participant. One vial was used for the sVNT assay at MUHAS while the other vials were transported on dry ice, maintaining a − 80°C temperature to the Joint Research Centre for Human Retroviral Infection in Kumamoto University, Japan for the pVNT assay.
Study design
A cross-sectional study was conducted between August 2022 and January 2023.
Study population
Blood samples from exposed adult participants (>18 years), either infected with SARS-CoV-2 virus and/or vaccinated with viral vector vaccine or the messenger ribonucleic acid (mRNA) vaccine were analyzed. During the data collection period, vaccine and infection immune responses were reported to last up to 4 and 8 months, respectively [9, 10]. Hence, all samples from the infected participants had PCR confirmation and were taken within 1–8 months post infection. Vaccinated participants had their samples taken within 1–4 months after receiving one or two doses of the initial primary vaccine series (Wuhan original Wild Type strain—WT) encompassing one dose of the viral-vector vaccine and two doses for the mRNA vaccines. Similar to previous studies [11], we assumed that the sVNT assay might be robust enough to discriminate neutralization activities between differentially exposed individuals and at different time points after exposure following infection and/or vaccination, hence the diversification of the participants. Also, analysis of the different cohorts is a reflection of the population characteristics and provided clinical relevance of the sVNT results, even in the Omicron context. Participants with immunocompromising illnesses such as HIV and malignancies were excluded from the study.
Sample size and sampling technique
Because of high death rate among hospitalized patients upon discharge, convenient sampling method was used to recruit participants who were alive, had reachable mobile contacts and were within the proximity of the study site. A sample size of 119 was calculated using the epi R package (tools for the analysis of epidemiology data version 2.0.76) with function epi.ssdxsesp() [12]. Twenty-five participants were infected, 25 were infected-vaccinated and 69 were vaccinated individuals who had no prior symptomatic infection (self-reported). Blood samples were collected in ethylenediamine tetra acetic acid coated tubes. Plasma was separated by centrifugation and immediately stored in aliquots at − 80°C within 3 h of sample collection.
Sample size for establishing population cut-off value in neutralizing antibodies
During the period of data collection, approximately 75% (ranging from 50% to 80%) of the population had antibody levels sufficient to neutralize the COVID-19 antigen [13–15]. The currently recommended method for screening antibody titers in the population has an area under the Receiver Operating Characteristic (ROC) curve (AUC) of 0.9713, which demonstrates diagnostic characteristics within an acceptable range [11]. Using this information, we employed the MedCalc tool (https://www.medcalc.org/) to calculate the minimum sample size required to estimate the AUC with a margin of error of 7% (0.07). The calculation yielded a required sample size of 115.
Test and reference methods
Neutralization antibody analysis using the surrogate virus neutralization assay as a test method
The sVNT assay was conducted at MUHAS at biosafety level 2 laboratory. Briefly, all the plasma samples were heat-inactivated at 56°C for 45 min prior to further processing. The sVNT (Gen-Script cPass™, USA, L00847) was performed as per manufacturer’s instructions against the WT SARS-CoV-2 virus (D614G) [10] and the BA.1.1.529 omicron variant. Briefly, participants samples, and the assay’s positive and negative controls were diluted 1:10 with sample dilution buffer. The dilutions were mixed with horseradish peroxidase conjugated recombinant SARS-CoV-2 RBD solution and incubated for 30 min at 37°C. The mixtures were subsequently incubated for 15 min at 37°C in a capture plate that was pre-coated with human ACE2 protein. After a washing step, tetramethylbenzidine solution was added and the plate was incubated in the dark at room temperature for 15 min. Stop solution was added to quench the reaction and the absorbance was immediately read at 450 nm on an ELISA microplate reader. The percentage inhibition was calculated as [(1− OD value of sample/OD value of Negative control)] × 100%, where OD stands for optical density. Participants with inhibition >30% were regarded as neutralizers while those with ≤30% were regarded as non-neutralizers as per manufacturer’s instruction [10].
Neutralizing antibody analysis using pseudo-virus neutralization assay as a reference (gold standard) method
Briefly, human embryonic kidney 293T cells (HEK293T) were transfected with plasmids encoding ACE2/Transmembrane serine proteases (TMPRSS2) receptors using polyethyleneimine, and SARS-CoV-2 pseudo-viruses were prepared by co-transfecting the HEK293T cells with a HiBiT tagged lentiviral vector backbone and plasmids encoding the respective variants, that is, Wuhan ancestral WT lab variant—D614G and the BA.1.1.529 omicron variant were prepared as previously described [11–13]. Transfected cells were harvested after 48 h of incubation.
For neutralization assays, heat inactivated plasma (56°C for 45 min) was 5-fold serially diluted on a 96-well plate starting from a 40-fold dilution. Pseudo-viruses with SARS-CoV-2 spike proteins were thawed and added at a concentration of 6 ng of the p24 antigen per well and incubated. Next, HEK293T cells expressing ACE2/TMPRSS2 were added and incubated for 48 h before measuring the infectivity. Neutralization titer was expressed as the percent decrease in infectivity relative to that of plasma free pseudo-viruses. The 50% neutralization titer (NT50) value was defined as the maximum dilution required to inhibit 50% of the pseudo-virus infectivity and was determined using four-parameter nonlinear regression (GraphPad Prism). Participants with sera whose NT50 where 40 or below were regarded as non-neutralizers and those whose NT50 were above 40 were regarded as neutralizers. All sample manipulations were treated as potentially hazardous and were conducted in a biosafety level 3 laboratory.
Statistical analysis
The obtained data was analyzed using an open source statistical programming language R (version 4.2.0) through its integrated development environments (IDEs) called JAMOV (version 2.2) and R Studio (release 2022.02.0). “DTComPair” R package version 1.1.0 was used to provide statistical test for comparing diagnostic characteristics of different cut-off values to be used in the evaluation of the sVNT assay, that is; manufacturer-recommended cut-off of 30% [10], literature-based cut-off points of 50% and 80% [14] and the population established cut-off values to be determined. The ROC curve was used first to test the extent to which results of the test assay (sVNT) can predict the results of the reference methods (pVNT), whereby AUC and a P-value were used to judge how best the test mirrors the reference assay. Thereafter, an optimal cut-off value that best distinguished between neutralizers and non-neutralizers beyond chance was determined using Youden’s index and a P-value less than 5%. An AUC of <0.5 suggested the cut-off cannot discriminate neutralizers and non-neutralizers. Explicitly, AUC of 0.5–0.6 indicates poor discrimination, 0.6–0.7 indicates sufficient discrimination, 0.7–0.8 is considered good, 0.8–0.9 is excellent, and >0.9 is outstanding [15]. Comparisons of these diagnostic characteristics of different cut-off values were performed using; McNemar test for sensitivities and specificities, and generalized score statistics was used for comparison of relative predictive positive values (PPV) and negative predictive values (NPV). Moreover, the manufacturer-recommended (30%) [10] and literature-based cut-off points 50% and 80% [14], and population established cut-off were tested prior to evaluation of the assays.
Results
Diagnostic metrics of the surrogate virus neutralization assay against the WT strain using the manufacturer’s cut-off
Neutralizing antibodies were tested among 119 infected and/or vaccinated participants. Their baseline characteristics were reported in our recent publication [16]. Using the manufacturer-recommended cut-off, diagnostic metrics such as sensitivity, specificity, diagnostic accuracy, and predictive capacity of the sVNT assay were evaluated with reference to the pVNT assay. As shown in Table 1, the sensitivity was high (91.4%) but the specificity was low at 66.7%, and the assay diagnostic accuracy was 90.8%. Moreover, the ability of the test to predict participants with sufficient neutralizing antibodies (neutralizers) with reference to the pseudo-virus neutralization assay (PPV) was 99.1% (almost perfect), but the ability to predictive non-neutralizers (NPV) was low at 16.7%.
Diagnostic metrics of the surrogate virus neutralization assay against the WT strain using the manufacturer’s cut-off.
| 95% Confidence interval | |||||||
|---|---|---|---|---|---|---|---|
| Decision statistics | Estimate (%) | Lower (%) | Upper (%) | ||||
| Test sensitivity | 91.4 | 84.7 | 95.8 | ||||
| Test specificity | 66.7 | 9.4 | 99.2 | ||||
| Diagnostic accuracy | 90.8 | 84.1 | 95.3 | ||||
| Positive predictive value | 99.1 | 94.9 | 100.0 | ||||
| Negative predictive value | 16.7 | 2.1 | 48.4 | ||||
| Proportion of false positives | 33.3 | 0.8 | 90.6 | ||||
| Proportion of false negative | 8.6 | 4.2 | 15.3 | ||||
Establishing an optimal Cut-Off for the surrogate virus neutralization assay against the WT strain
Because of the low specificity result on the sVNT assay, we used the ROC (Fig. 1) to check on whether the manufacturer-recommended cut-off, and some selected literature-based cut-off could accurately distinguish neutralizers and non-neutralizers. We got an AUC of 0.790, 95% CI (0.469–1.0), P = .087 for the manufacturer’s recommended cut-off (30%), AUC 0.803, 95% CI (0.480–1.0), P = .074 for the literature-based cut-off 50%, and AUC 0.773, 95% CI (0.454–1.0), P = .107, for the 80% literature-based cut-off. These results indicated good performance, although these cut-offs could not discriminate the neutralizer and non-neutralizer, beyond chance (P > .05), (Table 2). Hence, we decided to determine the optimal population cutoff. The calculated population-based cut-off was (27.69%) with an AUC of 0.833, 95% CI (0.505–1.0), P = .049, indicating excellent performance in discriminating between neutralizers and non-neutralizers when using the sVNT assay.
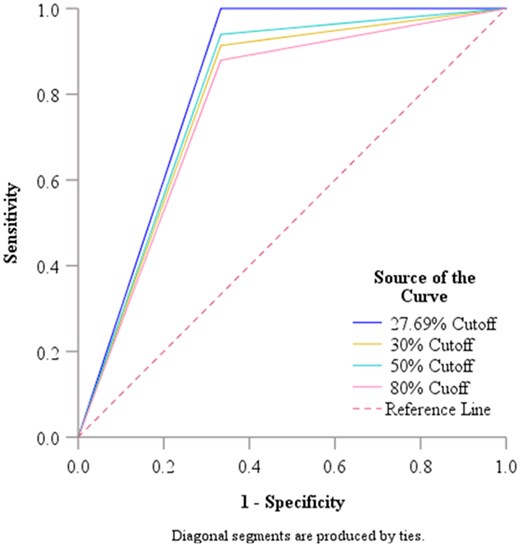
Receiver operating curve analysis for the WT strain cut-off value.
Establishing an optimal cut-off for the surrogate virus neutralization assay against the WT strain.
| 95% Confidence interval | |||||
|---|---|---|---|---|---|
| Variable—cutoffs | Area | Std error | Lower bound | Upper bound | P-value* |
| Population based—27.6967 | 0.833 | 0.167 | 0.505 | 1.000 | .049 |
| Manufacture recommended 30% Cutoff | 0.790 | 0.164 | 0.469 | 1.000 | .087 |
| 50% Cutoff | 0.803 | 0.165 | 0.480 | 1.000 | .074 |
| 80% Cutoff | 0.773 | 0.163 | 0.454 | 1.000 | .107 |
WT: Wild-type, Std: Standard.
Null hypothesis: true area = 0.05.
Evaluation of surrogate virus neutralization assay against the WT strain using the population cut-off vs the manufacturer’s cut-off value
Applying the population determined cut-off to evaluate the sVNT assay against the pVNT, significantly improved the sensitivity from 91.4% (using manufacturer’s cut-off) to 100% (P = .002). However, the specificity remained low at 67% similar to the manufacturer’s cut-off. Moreover, the ability of the assay to predict non-neutralizers, as participants without neutralizing antibodies (NPV), was also significantly improved from 16.4% (when manufacturer’s cut-off was used) to 100% (P = .006), but there was no difference in the ability to predict the neutralizers (PPV) (99.1% vs 99.1%, P = .340) (Table 3).
Evaluation of Surrogate Virus Neutralization assay against the WT strain using the population cut-off vs the manufacturer’s cut-off value.
| WT cutoff value, CI | |||||
|---|---|---|---|---|---|
| Diagnostic metrics | 27.69% | 30.0% | Difference | Test statistics | P-value |
| Sensitivity | 100.0% (96.9%–100%) | 91.4% (84.7%–95.8%) | −8.6 | 10.00 | .002 |
| Specificity | 66.7% (9.4%–99.2%) | 66.7% (9.4%–99.2%) | 0.0 | NA | NA |
| PPV | 99.1% (95.3%–100%) | 99.1% (94.9%–100%) | 0.999 | −0.953 | .340 |
| NPV | 100.0% (15.8%–100%) | 16.7% (2.1%–48.4%) | 0.167 | −2.776 | .006 |
PPV: Positive predictive value, NPV: Negative predictive value, NA: Not applicable.
Evaluation of surrogate virus neutralization assay against the omicron variant with reference to the pseudo-virus neutralization assay
Moreover, we analyzed the sVNT omicron antibody titers readings with reference to the pVNT readings (Fig. 2). First, we begun by scrutinizing if the sVNT antibody titers were able to predict neutralizers vs non-neutralizer on the reference method, before establishing the population cut-off. We found that the sVNT results were not able to predict neutralizers and non-neutralizers beyond chance, with an AUC of 0.649 and a P-value of .221 (Table 4). Hence, further analysis using the cut-offs was unnecessary.
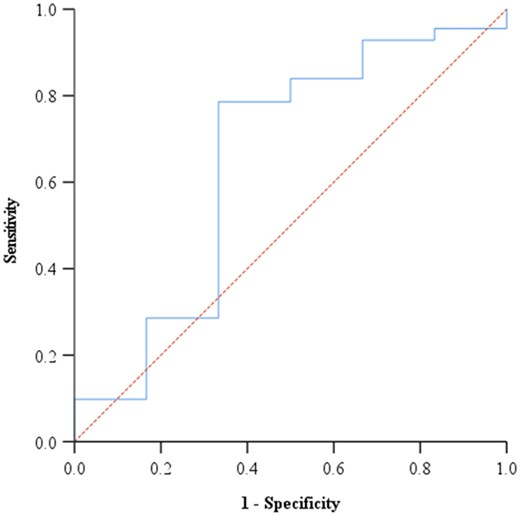
Figure 2. Receiver operating curve analysis for the Omicron variant cut-off value.
Evaluation of surrogate virus neutralization assay against the omicron variant with reference to the pseudo-virus neutralization assay.
| Area | Std error | 95% Confidence interval | ||
|---|---|---|---|---|
| Lower bound | Upper bound | P-value* | ||
| 0.649 | 0.138 | 0.379 | 0.919 | .221 |
| Area | Std error | 95% Confidence interval | ||
|---|---|---|---|---|
| Lower bound | Upper bound | P-value* | ||
| 0.649 | 0.138 | 0.379 | 0.919 | .221 |
Null hypothesis: true area = 0.05.
Discussion
To overcome challenges presented by conventional methods of analyzing functional neutralizing antibodies against SARS-CoV-2 in Tanzania, this study evaluated the sVNT assay as a low-cost alternative with high throughput and a short turnaround time to distinguish neutralizers and non-neutralizers among exposed individuals with reference to the pVNT assay. Using the WT strain, we show that the sVNT assay had the sensitivity of 100%, diagnostic accuracy of 99%, NPV of 100%, a PPV of 99%, and specificity of 66.7%. Notwithstanding the low specificity, our findings indicate that the sVNT has potential to be used as an alternative tool for population-based sero-surveillance of SARS-CoV-2, particularly in settings were the adoption of pVNT assays will take time.
Our study aimed to investigate whether the surrogate neutralizing assay could be used as a high throughput assay to screen for neutralizing antibodies and distinguish neutralizers and non-neutralizers with reference to the pseudo-virus based assay. Hence, we tested the manufacturer-recommended cut-off and the literature-based cut-off, which unfortunately showed incapacity to distinguish neutralizers from non-neutralizers beyond chance. Upon applying the population-based cut-off, the sensitivity was significantly improved to 100% from 91% of the manufacturer cut-off (P = .002), 94%, and 87.9%, of the 50% (P = .008), and 80% (P = .001) literature-based cut-off, respectively. There was no difference on the specificity and PPV, for all cut-offs, however, the NPV, significantly improved from 16.7% to 100%, 22% to 100%, 12.5% to 100% for the manufacturer cut-off, and the 50% and 80% literature-based cut-off, respectively. Although the ROC determined population cut-off differ for every population depending on ethnicity, geographical background, and prevalence of SARS-CoV-2, still similar outcomes where observed; overall there was improvement in the diagnostic performance to the reference method [17, 18]. Hence, this assay may require specific cut-off with respect to the population it will be applied for [18, 19]. Therefore, moving forward, we evaluated the surrogate neutralizing assay with reference to the pseudoviral neutralization using the population based cut off of 27.69%.
The comparison of the surrogate virus neutralization assay and the pseudoviral neutralization assay showed a sensitivity of 100%. This is consistent to studies reported elsewhere, whereby the sensitivity tended to range between 90% and 100% [18–21], even when the manufacturer cut-off was used [8]. This could be attributed by the ability of the assay to detect total neutralizing antibodies in an isotype independent manner hence improving the sensitivity [8, 18]. The low sensitivity in some of the reports was attributed by the presence of non-RBD neutralizing antibodies, of which the surrogate assay has limited capacity to identify, especially when the tested population is predominantly unvaccinated [18], unlike in the current study.
In our study, the sVNT assay classified 33% of individuals without antibodies as having neutralizing antibodies. This resulted in a high rate of false positives, as reflected in its low specificity of 66.7%. Although we had limited number of non-neutralizing participants in the current study, similar results were obtained by Gillot et al., who reported a specificity of 66.67% when pre-pandemic samples were tested [19]. Similarly, Silva et al. demonstrated an impressive sensitivity of 98.7% but a poor specificity of 63.2% [11]. Findings from Adams et al. reported that the sVNT assay exhibits low specificity, particularly among convalescent (28%) relative to vaccinated individuals (50%) [22]. In order to further elucidate the low specificity of sVNT, a recent systematic review showed that the sVNT tends to incorrectly identify 34%–58% of non-neutralizers as neutralizers [23–25]. The inability of the sVNT to discriminate between the mere presence versus actual functional capacity to inhibit viral entry into host cells may be the main source of the low specificity and hence limitation of the sVNT [17]. As a remedy, Bond et al., suggested using a higher inhibition cut-off to improve specificity [17]. Kweon et al. estimated a cut off of 83% using the ROC curve, and the specificity was 97.8% [21]. In the current study, we explored cut-offs ranging from 27% to 80%. However, specificity was not improved. Alternatively, introducing an equivocal range for the assay, determined through repeated testing, might help mitigate these variations [17, 18]. Future studies should explore further ways of optimizing the specificity of the sVNT to improve on its utility.
Moreover, our study also evaluated the utility and adaptability of the sVNT assay in diagnosis SARS-CoV-2 omicron variants. Previous findings reported the sVNT to fair moderately well with respect to the viral mutations from the WT to Omicron subvariants that is BA1, BA2, BA 5, with sensitivity of 100% (WT) and 57%–100% (BA1, BA2, BA 5) [11]. In the current study, analysis of the Omicron variant on the ROC showed inability of sVNT to predict those of the reference assay (AUC of 0.649, P = 0.22). According to Silva et al., the sVNT has limited capacity of detecting low to intermediate neutralization titers, displaying very poor sensitivity of 69% and 42% for BA2 and BA5, respectively, using the manufacturer’s cut-off [11]. When analysis was confined to a 3-dose vaccine-boosted population with higher antibody titers, the sensitivity of BA2 and BA.5 improved to 100% and 73.9%, respectively [11]. Our study is concordant with this observation as we reported an AUC of 0.728, P = .0001, when titers below 250 are excluded (Supplementary material). Although it is not clear to what extent antibody just above the detection point are protective against symptomatic infection, the reference method counts antibody titers greater than 40 neutralization titers to have ability to inhibit 50% of the viral infectivity in vitro. This finding highlights the need for continued improvement of the assay, as antibody responses are known to wane overtime, and with low vaccination rates in African settings, the antibody titers are likely to stay at modest to low levels [22].
Our study has several limitations. First we did not conduct multiple repeated testing to establish an equivocal range that can be used to mitigate the assay variations. Also, we did not have pre-pandemic samples; hence, samples that tested negative on the reference method were considered negative.
In conclusion, the surrogate virus neutralization assay is a viable alternative to live virus and pseudo-virus neutralization assays with a great potential for utility in population-based sero-surveillance for SARS-CoV-2 in low-resource settings. However, there is need for continuous improvement of the assay to enhance its diagnostic capacity, especially in the face of ongoing viral mutations.
Acknowledgements
The authors greatly appreciate Mr. Ambele Mawazo and Mr. Elias Boniphace who supported the recruitment and specimen collection processes.
Author contributions
Lilian Nkinda (Conceptualization [lead], Data curation [lead], Formal analysis [lead], Funding acquisition [lead], Investigation [lead], Methodology [lead], Project administration [lead], Writing—original draft [lead], Writing—review & editing [lead]), Victoria Shayo (Methodology [supporting], Validation [supporting]), Salim Masoud (Methodology [supporting], Writing—review & editing [supporting]), Godfrey Barabona (Investigation [supporting], Methodology [supporting], Writing—review & editing [supporting]), Isaac Ngare (Methodology [supporting], Validation [equal], Writing—review & editing [supporting]), Ponsian P. Kunambi (Formal analysis [equal], Software [equal], Validation [supporting]), Emmanuel Nkuwi (Methodology [supporting], Project administration [supporting]), Doreen Kamori (Data curation [supporting], Resources [supporting], Writing—review & editing [supporting]), Frank Msafiri (Formal analysis [supporting], Investigation [supporting], Writing—review & editing [supporting]), Elisha Osati (Project administration [supporting]), Frank Eric Hassan (Writing—review & editing [supporting]), Juma Kisuse (Writing—review & editing [supporting]), Benson Kidenya (Conceptualization [supporting]), Sayoki Mfinanga (Supervision [supporting]), Mbazi Senkoro (Supervision [supporting]), Takamasa Ueno (Supervision [supporting]), Eligius Lyamuya (Supervision [equal]), and Emmanuel Balandya (Supervision [lead])
Supplementary data
Supplementary data is available at Biology Methods and Protocols online.
Conflict of interest statement. None declared.
Funding
This research was funded by the National Institute for Health Research (NIHR) (PSIA2020-3073) using UK Aid from the UK Government to support global health research, as part of the EDCTP2 Programme supported by the European Union. The views expressed in this publication are those of the authors and not necessarily those of the NIHR, The UK Department of Health and Social Care or EDCTP. Any dissemination of results must indicate that it reflects only the author's view and that the EDCTP Association and/or UK DHSC is not responsible for any use that may be made of the information it contains. Partial support for travel and laboratory analysis was supported by JSPS KAKENHI Grant-in-Aid for Scientific Research 22H03119 and 22KK0148, JSPS Bilateral Open Partnership Joint Research Project, JPJSBP120219933, JPJSBP120239932, and JSPS Core-to-Core Program, JPJSCCB20220010 (to T.U.). and Amne-Salim COVID 19 fund.
Data availability
Data used to draw this conclusion are available from the corresponding author on reasonable request.
References
World Health Organisation
