


Abstract
Automated protein function prediction is a crucial and widely studied problem in bioinformatics. Computationally, protein function is a multilabel classification problem where only positive samples are defined and there is a large number of unlabeled annotations. Most existing methods rely on the assumption that the unlabeled set of protein function annotations are negatives, inducing the false negative issue, where potential positive samples are trained as negatives. We introduce a novel approach named PU-GO, wherein we address function prediction as a positive-unlabeled ranking problem. We apply empirical risk minimization, i.e. we minimize the classification risk of a classifier where class priors are obtained from the Gene Ontology hierarchical structure. We show that our approach is more robust than other state-of-the-art methods on similarity-based and time-based benchmark datasets.
Data and code are available at https://github.com/bio-ontology-research-group/PU-GO.
1 Introduction
Deciphering the functions of proteins is essential for unraveling the complexities of cellular pathways (Eisenberg et al. 2000), identifying potential drug targets (Schenone et al. 2013), and understanding diseases (Liu et al. 2015). In bioinformatics, protein function prediction emerges as a formidable challenge. With the rapid growth of biological data, including genomic and proteomic information, there is a pressing need for effective computational methods to predict protein functions accurately. Currently, the Uniprot Knowledge Base (UniprotKB) (Consortium 2022) contains more than 250 million protein sequences and only few of them have experimental functional annotations. The Gene Ontology (GO) (Ashburner et al. 2000) provides structured information about protein functions and describes more than 50 000 functions in three subontologies: Molecular Function Ontology (MFO), Cellular Component Ontology (CCO), and Biological Process Ontology (BPO).
Despite substantial progress in bioinformatics, the functional annotations of proteins remain incomplete. A significant portion of the proteome lacks detailed functional characterization, hindering our comprehensive understanding of cellular processes. This incompleteness stems from the limitations of experimental techniques and the resource-intensive nature of functional assays. As a result, computational methods play a pivotal role in filling these knowledge gaps and providing predictions for unannotated or poorly characterized proteins.
In the pursuit of accurate protein function prediction, many existing methods adopt a binary classification learning framework, optimizing classifiers using unlabeled protein-function annotations as negative samples. This traditional approach, while effective in certain contexts, overlooks the nuances inherent in the protein function prediction landscape. Unlabeled samples might hide positive protein function annotations yet to be discovered.
UniprotKB regularly introduces new annotations for proteins; for example, from UniprotKB version 2023_03 to UniprotKB version 2024_01, there were 2236 proteins that gained 4236 functional annotations. Protein functional annotations can be propagated using the true-path rule (Ashburner et al. 2000), which results in 31 149 propagated annotations that are added to UniprotKB from version 2023_03 to version 2024_01. The oversimplified binary approach may ignore the uncertainty of unlabeled annotations and erroneously guide the classifiers to predict false negatives.
Positive unlabeled (PU) learning represents a paradigm shift in addressing these challenges. PU learning acknowledges the inherent uncertainty in the functional status of unlabeled protein function annotations and recognizes them as potential positives. In the PU learning realm, there are various strategies handle unlabeled data (Bekker and Davis 2020) such as negative extraction from the unlabeled set (Fung et al. 2006), empirical risk minimization (du Plessis et al. 2014) or multiclassifier aggregation (Mordelet and Vert 2014).
PU learning has been applied to different bioinformatics tasks (Li et al. 2021) such as disease gene predictions (Yang et al. 2012, Vasighizaker and Jalili 2018, Stolfi et al. 2023), drug–target interaction prediction (Lan et al. 2016, Peng et al. 2017) as well as protein function prediction (Youngs et al. 2013, Song et al. 2021). There are two main strategies in which PU learning has been applied: negative extraction from the unlabeled data and probabilistic adaptation of a classifier (Li et al. 2021). Negative-extraction methods are a two-step process where a subset of reliable negatives are extracted from the unlabeled set and then a classifier is optimized with a conventional learning algorithm. Although this approach can show effectiveness across different bioinformatics tasks, the strategy of pre-selecting negatives can exclude important samples, producing inaccurate or biased classifiers.
Methods that adapt a classifier do not need to estimate a negative sample set a priori. Instead, the classifier is optimized with the whole dataset (positive and unlabeled) and estimation of positives/negatives from the unlabeled set are performed afterwards. These methods rely on the probabilistic formulation defined by (Elkan and Noto 2008) for PU learning.
In the context of function prediction, most methods follow the negative samples extraction strategy (Zhao et al. 2008, Chen et al. 2010, Youngs et al. 2013), meaning that training is done with a fraction of the given data. Conversely, methods that learn a classifier with PU data directly (Song et al. 2021) rely on optimization frameworks such as Majorization Minimization (Lange et al. 2000) or Support Vector Machines (Cortes and Vapnik 1995). However, in recent years, protein function prediction has been extensively addressed with emerging deep learning techniques(Kulmanov et al. 2017, Cao and Shen 2021, Wang et al. 2023, Yuan et al. 2023).
We present PU-GO a method for predicting protein functions by optimizing a classifier under PU learning framework. Instead of pre-selecting negatives samples, PU-GO uses the classifier adaptation approach and minimizes classifications risks of positive and unlabeled samples (du Plessis et al. 2014). Our framework uses the ESM2 15B protein language model (Lin et al. 2023) to obtain high-dimensional feature vectors for protein sequences, which are used to optimize a multilayer perceptron (MLP) classifier. Instead of enforcing the classifier to strictly discriminate between positive and negative samples, we use a ranking-based loss (Tang et al. 2022) to guide the classifier to rank positive samples higher than unlabeled ones. Furthermore, since protein function is a multilabel classification problem, we rely on the GO hierarchical structure to construct class priors for each GO function (Fig. 1).
In this way, PU-GO aims to optimize a classifier in a more nuanced and accurate way for protein function prediction. This approach holds promise in enhancing the sensitivity and specificity of predictions, thereby contributing to a more comprehensive and reliable understanding of protein functions in complex biological systems. We show that PU-GO can outperform state-of-the-art protein function prediction methods in a similarity-based and time-based benchmark datasets.
2 Materials and methods
2.1 Positive–negative classification
2.2 PU classification
2.3 PU learning for function prediction
In the context of function prediction, the feature space for x and functions l and g must be defined. We use the ESM2 15B (Lin et al. 2023) model to generate vectors for protein sequences that are consequently used as feature space x. The ESM2 15B model generates vectors of size 5120 that we refer to as ESM2 vectors.
2.4 Multilabel PU classification
2.5 Ranking positive and unlabeled samples
2.6 UniProtKB/Swiss-Prot dataset and gene ontology
We use the dataset that was generated from manually curated and reviewed dataset of proteins from the UniProtKB/Swiss-Prot Knowledgebase (Consortium 2022) version 2023_03 released on 28 June 2023. We filtered all proteins with experimental functional annotations with evidence codes EXP, IDA, IPI, IMP, IGI, IEP, TAS, IC, HTP, HDA, HMP, HGI, HEP. The dataset contains 79, 973 reviewed and manually annotated proteins.
We split this dataset into training, validation and testing sets based on sequence similarity so that no similar sequences are shared between training, validation and testing sets. Our objective is to avoid over-fitting of our models to protein similarity. Therefore, we decided to split our dataset based on any similarity hit with maximum e-value score of 0.001. We computed pairwise similarity using Diamond (v2.0.9) (Buchfink et al. 2014), assigned sequences that have a similarity higher than our threshold to the same group, and split these groups into training (90%) and testing (10%). We extracted 10% of the training set to form a validation set. This resulted into a 81/9/10 split of the groups for training/validation/testing. We detail the split percentages in terms of proteins in Table 1. We call this dataset similarity-based dataset. We use Gene Ontology (GO) released on 01 January 2023. We train and evaluate models for each of the subontologies of GO separately.
Summary of the UniProtKB/Swiss-Prot dataset.
| Ontology | GO terms | Train (%) | Valid (%) | Test (%) | Time |
|---|---|---|---|---|---|
| MFO | 7114 | 39 432 (89) | 2359 (5) | 2595 (6) | 684 |
| BPO | 21 105 | 53 022 (89) | 3180 (5) | 3538 (6) | 801 |
| CCO | 2888 | 51 991 (88) | 3241 (6) | 3565 (6) | 573 |
| Ontology | GO terms | Train (%) | Valid (%) | Test (%) | Time |
|---|---|---|---|---|---|
| MFO | 7114 | 39 432 (89) | 2359 (5) | 2595 (6) | 684 |
| BPO | 21 105 | 53 022 (89) | 3180 (5) | 3538 (6) | 801 |
| CCO | 2888 | 51 991 (88) | 3241 (6) | 3565 (6) | 573 |
The table shows the number of GO terms, number of proteins in similarity based training, validation and testing splits with percentages in parenthesis and the number of proteins in time-based evaluation benchmark dataset.
To compare our model with other methods we generated a test set by following the CAFA (Radivojac et al. 2013) challenge time-based approach. We downloaded UniProtKB/Swiss-Prot version 2024_01 released on 17 January 2024 and extracted newly annotated proteins in this version. Table 1 summarizes the datasets for each subontology.
2.7 Training procedure
To train our models, we optimized hyperparameters: batch size [30, 200], margin factor [0.1, 0.01], maximum learning rate [], minimum learning rate factor [], initial prior (πo) []. Hyperparameters were optimized via Gaussian-Process Bayesian optimization method (Rasmussen and Williams 2005, Shahriari et al. 2016). We used Adam (Kingma and Ba 2015) optimizer and adapted the learning rate using a cyclic scheduler (Smith 2017). Selected hyperparameters can be found in the Supplementary Material.
2.8 Baseline and comparison methods
2.8.1 Naive approach
2.8.2 DiamondScore
2.8.3 MLP (ESM2)
We train a different model for each subontology in GO.
2.8.4 DeepGO-plus and DeepGOCNN
DeepGO-PLUS (Kulmanov and Hoehndorf 2019) predicts function annotations of proteins by combining DeepGOCNN, which predicts functions from the amino acid sequence of a protein using a 1-dimensional convolutional neural network (CNN), with the DiamondScore method. DeepGOCNN captures sequence motifs that are related to GO functions. Here, we only use CNN based predictions.
2.8.5 DeepGOZero
2.8.6 TALE
TALE (Cao and Shen 2021) predicts functions using a transformer-based deep neural network model which incorporates hierarchical relations from the GO into the model’s loss function. The deep neural network predictions are combined with predictions based on sequence similarity. We used the trained models provided by the authors to evaluate them on the time-based dataset.
2.8.7 SPROF-GO
SPROF-GO (Yuan et al. 2023) method uses the ProtT5-XL-U50 (Elnaggar et al. 2022) protein language model to extract proteins sequence embeddings and learns an attention-based neural network model. The model incorporates the hierarchical structure of GO into the neural network and predicts functions that are consistent with hierarchical relations of GO classes. Furthermore, SPROF-GO combines sequence similarity-based predictions using a homology-based label diffusion algorithm. We used the trained models provided by the authors to evaluate them on the time-based dataset.
2.8.8 NetGO3
NetGO3 integrates seven component methods that differ on the type of information they rely on: (1) Naive: GO frequency, (2) BLAST-KNN: sequence homology, (3) LR-3mer: amino acid trigram, (4) LR-InterPro: domain/family/motif, (5) NetKNN: protein network, (6) LR-Text: literature, and (7) LR-ESM: protein language model. Methods with the prefix “LR” and “KNN”contain a logistic regression classifier and k-nearest neighbor algorithm, respectively. We used the web service provided by the authors to obtain predictions for our time-based benchmark dataset.
2.8.9 ATGO
ATGO (Zhu et al. 2022) uses the ESM-1b protein language model. For a protein sequence, the model extracts embeddings from the three last layers of ESM-1b. The embeddings are inputs for an MLP-based neural network. ATGO computes a triplet loss, which means that for an anchor protein anc, proteins pos and neg are sampled with the same or different functions as anc, respectively. The final model, ATGO+, combines the prediction scores of ATGO with a sequence homology based method. We used the trained models provided by the authors to evaluate ATGO+ on the time-based dataset.
2.9 Evaluation
We use four different measures to evaluate the performance of our models. Three protein-centric measures , and AUPR and one class-centric AUC.
AUPR is the area under the average precision (AvgPr) and recall (AvgRc) curve. AUC is a class-centric measure where compute AUC ROC per each class and take the average.
3 Results
3.1 Prediction model: PU-GO
We developed PU-GO, a method based on positive unlabeled learning to predict GO functions. PU-GO acts on the MLP classifier shown in Equations (5–8). The training phase uses the output of the classifier to compute the classification risk of positive and unlabeled samples following Equation (9). In the prediction phase, the output of the classifier is passed to the sigmoid function directly.
We trained three separate models for each subontology. The only parametric difference between the three models is the output size of the classifier, which depends of the number of GO functions. For Molecular Function Ontology there are 7114 functions, for Cellular Component ontology 2888 and for Biological Process Ontology 21 105.
We used the similarity-based dataset to train our models in order to avoid bias induced by sequence-similar proteins existing in training and testing datasets. For each model, we trained 10 models varying the random seed used to initialized model parameters and batch selection and aggregated the metrics using the arithmetic mean operation.
3.2 Evaluation on similarity-based split
To evaluate PU-GO, we chose baseline methods that do not contain components relying on sequence similarity for computing prediction scores. Results are shown in Table 2. PU-GO outperforms other methods in almost all evaluations except in AUPR in BPO, where MLP(ESM2) obtains the best performance. However, it is possible that using ESM2 15B in PU-GO is the reason to outperform DeepGO-CNN and DeepGOZero. The advantage of PU learning is directly demonstrated when comparing PU-GO to MLP(ESM2) which uses the same classifier function as PU-GO but considers unlabeled samples as negatives.
Evaluation results for similarity-based split using protein-centric , and AUPR, and the class-centric average AUC.
| Method | AUPR | AUC | ||
|---|---|---|---|---|
| MFO | ||||
| Naive | 0.2805 | 15.1460 | 0.1395 | 0.5000 |
| DeepGO-CNN | 0.3705 | 14.1480 | 0.3242 | 0.7087 |
| DeepGOZero | 0.4545 | 12.8750 | 0.4095 | 0.7536 |
| MLP(ESM2) | 0.5079 | 12.1020 | 0.4851 | 0.8401 |
| PU-GO | 0.5317 | 11.6490 | 0.5026 | 0.8413 |
| BPO | ||||
| Naive | 0.2997 | 41.6290 | 0.1978 | 0.5000 |
| DeepGO-CNN | 0.3446 | 40.4210 | 0.2810 | 0.6879 |
| DeepGOZero | 0.3624 | 39.5340 | 0.3112 | 0.6900 |
| MLP(ESM2) | 0.4279 | 37.1990 | 0.3973 | 0.8484 |
| PU-GO | 0.4365 | 36.7640 | 0.3928 | 0.8674 |
| CCO | ||||
| Naive | 0.5501 | 12.3280 | 0.4077 | 0.5000 |
| DeepGO-CNN | 0.6336 | 11.2260 | 0.6343 | 0.7699 |
| DeepGOZero | 0.5862 | 11.8080 | 0.5711 | 0.6836 |
| MLP(ESM2) | 0.7091 | 9.4250 | 0.6897 | 0.9047 |
| PU-GO | 0.7210 | 9.1010 | 0.7696 | 0.9240 |
Bold values indicate best performance.
3.3 Evaluation on time-based benchmark
To test the generalization capability of PU-GO, we use our trained models optimized using data from UniProtKB/SwissProt Knowledgebase version 2023_03, to predict GO functions from UniProtKB/SwissProt Knowledgebase version 2024_01. We compared with several state-of-the-art methods and show the results in Table 3. We integrate Diamond predictions with PU-GO as shown in Equation (13). PU-GO+Diamond outperforms all methods in the class-centric AUC evaluation across all subontologies and obtains the highest in BPO and CCO. However, ATGO+ resulted in best and in MFO.
Evaluation results for time-based split using protein-centric , and the class-centric average AUC.
| Method | AUC | ||
|---|---|---|---|
| MFO | |||
| Diamond | 0.555 | 8.915 | 0.848 |
| SPROF-GO | 0.539 | 9.482 | 0.724 |
| TALE | 0.301 | 13.515 | 0.741 |
| NetGO3 | 0.539 | 8.986 | 0.891 |
| ATGO+ | 0.612 | 8.061 | 0.844 |
| MLP(ESM2) | 0.507 | 9.682 | 0.942 |
| PU-GO | 0.531 | 9.010 | 0.947 |
| MLP(ESM2)+Diamond | 0.562 | 8.948 | 0.953 |
| PU-GO+Diamond | 0.569 | 8.776 | 0.955 |
| BPO | |||
| Diamond | 0.548 | 23.693 | 0.735 |
| SPROF-GO | 0.496 | 24.368 | 0.722 |
| TALE | 0.476 | 25.612 | 0.644 |
| NetGO3 | 0.542 | 23.061 | 0.697 |
| ATGO+ | 0.549 | 22.156 | 0.736 |
| MLP(ESM2) | 0.448 | 26.481 | 0.884 |
| PU-GO | 0.471 | 25.175 | 0.888 |
| MLP(ESM2)+Diamond | 0.550 | 23.532 | 0.902 |
| PU-GO+Diamond | 0.556 | 22.993 | 0.904 |
| CCO | |||
| Diamond | 0.685 | 7.786 | 0.792 |
| SPROF-GO | 0.711 | 7.729 | 0.777 |
| TALE | 0.664 | 8.685 | 0.785 |
| NetGO3 | 0.680 | 7.964 | 0.897 |
| ATGO+ | 0.712 | 7.535 | 0.822 |
| MLP(ESM2) | 0.681 | 8.413 | 0.931 |
| PU-GO | 0.701 | 7.866 | 0.945 |
| MLP(ESM2)+Diamond | 0.725 | 7.340 | 0.937 |
| PU-GO+Diamond | 0.734 | 7.062 | 0.949 |
Bold values indicate best performance.
We further analyze the performance of MLP(ESM2), PU-GO, and ATGO+ based on the specificity of the GO class. Less specific GO classes are closer to the root and contain a higher number of protein annotations than classes with high specificity. We compute the AUC for each GO class and group them by their number of annotations. We find that positive unlabeled learning in PU-GO improves the performance across all levels of specificity when compared with MLP(ESM2). Regarding ATGO+, we find that its average AUC is lower than PU-GO+Diamond for GO classes with higher level of specificity, whereas it can outperform PU-GO+Diamond for GO classes with lower level of specificity (i.e. larger number of annotations) (Fig. 2).
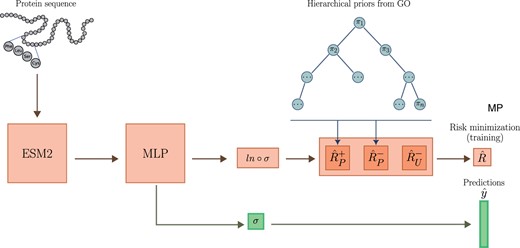
PU-GO workflow. The MLP classifier is trained to minimize classification risk of positive and unlabeled samples. Prior factors for each GO class is computed based on hierarchical GO structure.
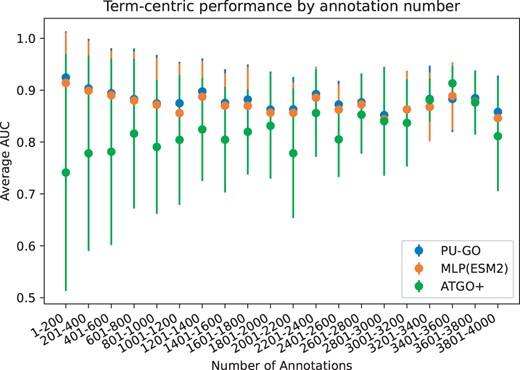
Average prediction performance of GO classes grouped by number of annotations on UniprotKB-Swissprot dataset.
3.4 Ablation study
PU-GO contains two variations from the standard PU learning formulation such as (1) the use of a ranking loss between positive and unlabeled samples following (Tang et al. 2022) and (2) the use of a different prior for each GO class using GO hierarchical structure. We analyze the impact of each component in Table 4. PU-basic uses Equation (9) with for every ith GO function. From PU-basic, we construct PU-ranking replacing the risk estimation for unlabeled samples from Equation (9) with a risk computing the ranking between positive and unlabeled samples in Equation (11). PU-ranking is more flexible than PU-basic, and only requires unlabeled samples to be scored lower than positive ones and not strictly close to 0, which results in better performance in general. Finally, from PU-ranking we construct PU-GO by incorporating custom priors πi for each GO class [Equation (10)]. This change shallowly incorporates hierarchy information as class priors (i.e, a GO class closer to the root is more likely to be annotated with a protein than a GO class closer to the leaves). Our analysis shows that using custom prior values enhance PU learning. For every method, we trained 10 models with different random seeds and report the arithmetic mean and standard deviation values.
Ablation study analyzing the components of PU-GO.
| Method | AUPR | AUC | ||
|---|---|---|---|---|
| MFO | ||||
| PU-basic | 0.5129 ± 0.0041 | 11.9470 ± 0.0696 | 0.4319 ± 0.0046 | 0.8446 ± 0.0054 |
| PU-ranking | 0.5265 ± 0.0014 | 11.7450 ± 0.0414 | 0.4556 ± 0.0067 | 0.8510 ± 0.0028 |
| PU-GO | 0.5317 ± 0.0020 | 11.6490 ± 0.0471 | 0.5026 ± 0.0036 | 0.8413 ± 0.0062 |
| BPO | ||||
| PU-basic | 0.4310 ± 0.0005 | 37.0440 ± 0.0482 | 0.3655 ± 0.0018 | 0.8602 ± 0.0020 |
| PU-ranking | 0.4368 ± 0.0007 | 36.7090 ± 0.0602 | 0.4086 ± 0.0033 | 0.8677 ± 0.0011 |
| PU-GO | 0.4365 ± 0.0008 | 36.764 ± 0.0364 | 0.3928 ± 0.0009 | 0.8674 ± 0.0023 |
| CCO | ||||
| PU-basic | 0.6994 ± 0.0007 | 9.6110 ± 0.0384 | 0.6152 ± 0.0012 | 0.9039 ± 0.0053 |
| PU-ranking | 0.7102 ± 0.0007 | 9.4060 ± 0.0200 | 0.6239 ± 0.0014 | 0.8933 ± 0.0072 |
| PU-GO | 0.7210 ± 0.0010 | 9.1010 ± 0.0244 | 0.7696 ± 0.0043 | 0.9240 ± 0.0018 |
Metrics reported are protein-centric , , and AUPR, and the class-centric average AUC.
Bold values indicate best performance.
4 Discussion
Positive-unlabeled learning is an appropriate formulation to the automated function prediction problem, where most of the data is still not labeled. Previous attempts to handle unlabeled data aim to transform some unlabeled samples into negatives (Youngs et al. 2013) or have not been applied to current deep learning classifiers (Song et al. 2021). We developed PU-GO, adapting risk-minimization based PU learning (Elkan and Noto 2008, du Plessis et al. 2014, Plessis et al. 2015, Kiryo et al. 2017, Bekker and Davis 2020) to the context of function prediction. PU-GO does not require extracting a subset of unlabeled samples as negatives. Instead, the whole unlabeled dataset can be used to adapt a classifier.
PU learning with risk-minimization framework is a function of a classifier. In our case, we used an MLP classifier. The input for the MLP were vectors from ESM2 15B, a pretrained language model for protein sequences. This configuration (i.e. ESM2 15B + MLP) is similar to other methods such as SPROF-GO (Yuan et al. 2023), NetGO3 (Wang et al. 2023), which as part of their frameworks there are pretrained language models together with a classifier. PU-GO does not contain any additional component other than the ESM2 15B+MLP classifier. We showed that PU-GO was able to outperform baseline methods as well as the binary classification training version of ESM2 15B + MLP, which supports the hypothesis that PU learning is an appropriate approach to improve protein function prediction. However, more sophisticated classifiers can be proposed in future work, where incorporation of additional domain-specific biological data can be used to constrain the optimization process.
Class prior estimation is a crucial aspect in PU learning (du Plessis et al. 2016). For protein function prediction, we leveraged domain-specific information such as the GO hierarchical structure to design custom class priors per each GO class based on their annotation frequency. Our approach requires tuning an initial prior weight πo, which we selected empirically by searching in a particular range. Despite the simplicity of this approach, it showed to be effective to construct a more robust models. However, future work can explore other ways to construct more accurate priors by leveraging other aspects of GO such as semantic similarity between GO classes instead of only using class annotation frequency as in PU-GO. Similarly, other class prior estimation strategies should be explored, such as instance-similarity-based (Zeiberg et al. 2020) or positive-unlabeled subsampling (Ramaswamy et al. 2016). Furthermore, biological information can also be leveraged to construct better class priors such as protein sequence homology (Yuan et al. 2023).
PU-GO framework handles unlabeled samples differently than previous approaches where the aim was to strictly discriminate between positive and negative samples. In PU-GO, instead of minimizing the risk of classifying an unlabeled sample as negative, it addresses the protein function prediction as a ranking problem and minimizes the risk of ranking an unlabeled sample higher than a positive one. Furthermore, since the risk-minimization framework we resort to is extensible to incorporate true negative samples (Hsieh et al. 2019), future work can be directed to study the incorporation of negative annotations that are already available or that can be extracted by some strategy.
5 Conclusion
Protein function prediction is a widely studied multilabel classification problem that typically has been addressed under binary classification settings. However, protein function annotations are mostly unlabeled. To deal with unlabeled annotations, we addressed protein function prediction as a PU classification problem. We adapted the PU learning framework for protein function prediction by incorporating hierarchical information in GO in the class priors. Our analysis indicates improved performance compared to existing methods on similarity-based and time-based benchmark datasets. Future potential work could focus on incorporating negative samples to the PU setting and minimize negative classification risk. Although negative data is small, finding a way to use it can improve the classifier generalization capability. Another direction could be using more sophisticated classifiers that can include other types of biological information, which has been an approach followed in the binary-classification setting.
Acknowledgements
We acknowledge support from the KAUST Supercomputing Laboratory.
Author contributions
R.H., M.K., Z.T., and F.Z.-C. conceived the experiment(s), M.K. and F.Z. conducted the experiment(s), R.H., M.K., and F.Z. analyzed the results. R.H., M.K., Z.T., and F.Z.-C. wrote and reviewed the manuscript. R.H. supervised the work. R.H. and M.K. acquired funding.
Supplementary data
Supplementary data are available at Bioinformatics online.
Conflict of interest
The authors have declared no conflict of interest.
Funding
This work was supported by the King Abdullah University of Science and Technology (KAUST) Office of Sponsored Research (OSR) [under Award No. URF/1/4675–01–01, URF/1/4697–01–01, URF/1/5041–01–01, REI/1/5659–01–01, REI/1/5235–01–01, and FCC/1/1976–46–01].
Data availabilty
The data underlying this article are available in a Zenodo Repository at https://dx.doi.org/10.5281/zenodo.11079885.

