


Abstract
Detection of structural variants (SVs) from the alignment of sample DNA reads to the reference genome is an important problem in understanding human diseases. Long reads that can span repeat regions, along with an accurate alignment of these long reads play an important role in identifying novel SVs. Long-read sequencers, such as nanopore sequencing, can address this problem by providing very long reads but with high error rates, making accurate alignment challenging. Many errors induced by nanopore sequencing have a bias because of the physics of the sequencing process and proper utilization of these error characteristics can play an important role in designing a robust aligner for SV detection problems. In this article, we design and evaluate HQAlign, an aligner for SV detection using nanopore sequenced reads. The key ideas of HQAlign include (i) using base-called nanopore reads along with the nanopore physics to improve alignments for SVs, (ii) incorporating SV-specific changes to the alignment pipeline, and (iii) adapting these into existing state-of-the-art long-read aligner pipeline, minimap2 (v2.24), for efficient alignments.
We show that HQAlign captures about 4%–6% complementary SVs across different datasets, which are missed by minimap2 alignments while having a standalone performance at par with minimap2 for real nanopore reads data. For the common SV calls between HQAlign and minimap2, HQAlign improves the start and the end breakpoint accuracy by about 10%–50% for SVs across different datasets. Moreover, HQAlign improves the alignment rate to 89.35% from minimap2 85.64% for nanopore reads alignment to recent telomere-to-telomere CHM13 assembly, and it improves to 86.65% from 83.48% for nanopore reads alignment to GRCh37 human genome.
1 Introduction
Structural variations (SVs) are genomic alterations of size at least 50 bp long, including insertions, deletions, inversions, duplications, translocations, or a combination of these types (Alkan et al. 2011). The study of these genetic variations has an important role in understanding human diseases, including cancer (The ICGC/TCGA Pan-Cancer Analysis of Whole Genomes Consortium 2020), and begins with the alignment of reads sequenced from the sample genome back to the reference genome. Accurate alignment of short reads from high throughput sequencing poses a challenge, especially, in the repetitive regions of the genome, which are also the hotspots of nearly 70% of the observed structural variations (Rowell et al. 2019).
Long-read sequencing technologies have addressed this problem by producing reads that are longer than the repeat regions, therefore, enabling the detection of variants in the repeat regions at the cost of higher error rates than short-read sequencing technologies. These high error rates in the long reads lead to non-contiguous alignment, which poses a challenge in variant detection problems, especially, in the repeat regions.
Nanopore sequencing (Mikheyev and Tin 2014, Deamer et al. 2016) is a long-read sequencing technology that provides reads (with average read length more than 10-kb and the longest read sequenced more than 2-Mb long) that can span these repetitive regions but it has a high error rate of (average) 10%. These high error rates result in low accuracy alignments (Križanović et al. 2018) using state-of-the-art methods including minimap2 (v2.24) (Li 2021), which is a fast method designed for the computationally challenging task of long sequence alignment. This problem is further amplified in the repetitive regions, such as variable-number tandem repeats region that accounts for a significant fraction of SVs (Chaisson et al. 2019, Ebert et al. 2021). However, these errors in nanopore sequencing have a bias induced by nanopore physics, which is missed by many long-read aligners since they consider the errors as independent insertions, deletions, and substitutions. In nanopore sequencing, a DNA strand migrates through the nanopore, and an ionic current that is established in the nanopore changes according to the nucleotide sequence in or near the nanopore. However, because of the physics and non-idealities of the nanopore sequencing, each current level recorded depends on a Q-mer (https://nanoporetech.com/support/how-it-works) (a set of Q consecutive nucleotide bases, which influence the measurement in the nanopore) (Laszlo et al. 2014, Mao et al. 2018). These current readings are translated back to nucleotide sequences by base-calling algorithms. Therefore, the error biases could be introduced in base-calling, especially, between different Q-mers that have similar current levels. This similarity in the current levels for different Q-mers is captured by the Q-mer map as shown in Fig. 1a. A Q-mer map represents the median current level and the standard deviation (as error bars) for different Q-mers () for the nanopore flow cell. It is evident from this figure that there is a significant overlap between the current levels observed for different Q-mers migrating the nanopore. We propose a new alignment method, HQAlign [Hybrid-QAlign, which is based on QAlign (Joshi et al. 2021)] and is designed specifically for detecting SVs while incorporating the error biases inherent in the nanopore sequencing process.
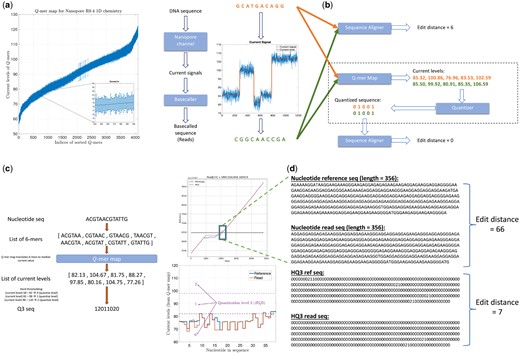
(a) Q-mer map for Nanopore R9.4 1D flow cell (for ). It represents the physics of nanopore. The median current value along with the standard deviation (as error bars) are plotted for all 6-mers in the Q-mer map for R9.4 1D nanopore flow cell (the Q-mers are sorted in increasing median current levels). Note that the difference between the median current levels of any two consecutive Q-mers is very small, therefore, resulting in large overlaps. (b) An example to illustrate the error biases in nanopore base-called reads, which can be resolved through the Q-mer map ability of HQAlign to perform accurate alignment despite the errors (the edit distance used here is domain-specific and is used to demonstrate the accuracy of the alignment). (c) An example of quantization method for translating the nucleotide sequences to the current-level sequences using Q-mer map, and then quantizing the (real-valued) current-level sequences to finite quantized sequences (e.g. three levels for HQ3). (d) An example from PromethION R9.4.1 ONT data in the neighborhood of an SV in repeat region shows the two different nucleotide sequences have similar current levels and therefore, the edit distance as observed through the lens of quantized sequence is significantly lower in HQ3.
HQAlign takes the dependence of Q-mer map into account to perform accurate alignment with modifications specifically for the discovery of SVs. Figure 1b gives an example where a DNA sequence (GCATGACAGG) is sequenced incorrectly as (CGGCAACCGA) due to the error bias in the nanopore sequencer. As shown in the figure, the sequences are different in the nucleotide space but they are identical in the Q-mer map space. It is important to note that no additional soft information is used to establish this identity, such as raw nanopore current values for the nanopore reads. Instead, the nucleotide sequences that have indistinguishable current levels from the lens of the Q-mer map are mapped to a common quantized sequence. A nucleotide sequence is converted to a quantized sequence by first converting the nucleotide sequence to a sequence of current levels using the Q-mer map and then converting the sequence of (real-valued) current levels to a (finite level) quantized sequence by hard thresholding the current levels as shown in Fig. 1c. Therefore, the additional information about the raw current signals is not used in the quantization process but only the Q-mer map is utilized. Further, the quantization of current levels to finite discrete levels (e.g. three levels) enables the use of existing software pipelines for long-read aligners, such as minimap2 as the core seed and extend algorithm for the alignment of quantized sequences.
HQAlign is a hybrid mechanism with two steps of alignment. In the initial alignment step, the reads are aligned onto the genome in the nucleotide space using minimap2 to determine the region of interest where a read can possibly align to. In the hybrid step, the read is re-aligned to the region of interest on the genome (determined from the initial alignment) in the quantized space. The narrow focus on the region of interest on target for the hybrid step leads to an accurate alignment of the read-to-genome without dropping the frequently occurring seed matches from the chain in minimap2 algorithm while taking the error biases of nanopore sequencing into account through quantized sequences. The new modifications in minimap2 (Li 2021) address this issue with a heuristic that adds additional low occurrence minimizers to the chain if the adjacent anchors in the chain are far apart, whereas the implementation of HQAlign has a different and complementary approach by focusing on a narrow region on target to enable alignments with an improvement in chaining score over new minimap2. Moreover, HQAlign pipeline enables the detection of inversion variants unlike QAlign pipeline. In QAlign, the quantized forward read and the quantized reverse complement read are aligned separately to the quantized genome, therefore, an inversion within a read alignment is not detected in QAlign (refer to Section 2.2 for details). The separate alignment of the forward and the reverse complement reads in QAlign also results in a high false discovery rate for SV detection (as explained in Supplementary Section S1.3). It is because QAlign was not optimized for downstream SV callers, such as Sniffles2 (Smolka et al. 2022). However, in HQAlign, we have modified the minimap2 pipeline to enable simultaneous alignment of the quantized reverse complement read along with the quantized forward read sequence to the quantized genome. This helps not only in resolving the high false discovery rate in QAlign but also in detecting inversions within a read alignment. Further, HQAlign is optimized for the downstream SV callers, and is more than 2.5× faster than QAlign (as shown in Supplementary Table S4) as the seed search domain for the alignment of quantized sequences is reduced to a region of interest determined in the initial step of the algorithm.
An example of the performance of HQAlign against minimap2 (v2.24) in detecting an insertion SV in a repeat region is demonstrated in Fig. 1d. It shows alignment of a real ONT read in a repeat region (note that a pattern of a few consecutive nucleotide bases is repeated in the example) that is flanking around an insertion SV. Minimap2 alignment of nucleotide reference and read (both of length 356 from the region highlighted with a box) have an edit distance of 66 whereas the HQ3 alignment (HQ3 is an alignment from HQAlign pipeline where the nucleotide sequences are translated to three level quantized sequences, as shown in the example in Fig. 1c) of quantized reference and read sequences from the same region have a significantly smaller edit distance of seven. This is because the current-level sequence (by converting the nucleotide sequences using the Q-mer map in Fig. 1a) for the reference and the read sequences is very similar. Therefore, the sequences that are far apart in nucleotide space are inherently very similar in HQ3 space in terms of the edit distance in the transformed space.
We show that HQAlign gives significant performance improvements in the quality of read alignment across real and simulated data. The well-aligned reads (a read is defined as well-aligned if at least 90% of the read is aligned on the genome with a mapping quality more than 20) improve to 86.65% with HQ3 from 83.48% with minimap2 (v2.24) for the alignment of ONT reads from HG002 sample to GRCh37 human genome. The metric improves to 89.35% from 85.64% for HG002 reads alignment to T2T CHM13 assembly (Rhie et al. 2022), and improves to 81.57% from 81.01% for the simulated reads data. These results are presented in Section 3.1.2 (Table 1).
Comparison for the percentage of well-aligned reads onto genome, and slope of the regression line from normalized edit distance comparison plot of HQ3 versus minimap2 alignments with randomly sampled reads for each dataset (the reads are randomly sampled to reduce the amount of edit distance computations).a
| Dataset (no. of sampled reads) | Method of alignment | well-aligned reads (%) | Slope of regression line |
|---|---|---|---|
| HG002 R9.4.1 reads to CHM13 (50k) | minimap2 | 85.64 | 0.7940 |
| HQ3 | 89.35 | ||
| HG002 R9.4.1 reads to GRCh37 (50k) | minimap2 | 83.48 | 0.8301 |
| HQ3 | 86.65 | ||
| Simulated reads from chr 8 & X of CHM13 assembly (50k) | minimap2 | 81.01 | 0.9860 |
| HQ3 | 81.57 |
The slope of the regression line shows the average gain in the normalized edit distance over the subsampled reads in each dataset.
In terms of SV detection, HQAlign has F1 score at par with minimap2 (v2.24) with Sniffles2 (Smolka et al. 2022) as the variant calling algorithm across both real and simulated datasets (Supplementary Table S6). However, both HQAlign and minimap2 capture many complementary calls (4%–6%), which are missed by the other method (as shown in Fig. 4 and Supplementary Figs S8–S11). For instance, the complementary HQAlign calls are SVs that are uniquely called by HQAlign or labeled missed in minimap2 due to breaking in the SV and vice-versa for the complementary calls in minimap2. Further, the analysis of common true positive SV calls in HQAlign and minimap2 against the truth set shows that HQAlign has on average a significant improvement (10%–50%, from the slope of the regression line in Fig. 5, and Supplementary Figs S12–S14, and weighted average improvement across all datasets by 39%) in the breakpoint accuracy than minimap2 for the calls with a difference in breakpoint >50 bp (breakpoint accuracy is determined from the difference in the start and end breakpoints of an SV with respect to the match SV in truth set, therefore, lower the difference higher is the breakpoint accuracy, refer to Section 2.3 for a precise definition). Moreover, for the common true positive calls, HQAlign has (on average) better SV length similarity than minimap2 (when SV length similarity is <0.95, SV length similarity is a measure of how similar is the length of SV from an alignment method relative to the match SV in truth set; refer to Section 2.3 for a precise definition) as shown in Fig. 5 and Supplementary Figs S12–S14.
2 Materials and methods
The HQAlign strategy consists of two steps: (i) the initial alignment of the standard base-called query sequence x to a target sequence t using Minimap2. This initial step identifies the regions of interest on the target where x aligns. (ii) The hybrid step is re-aligning the query x only to the regions of interest on the genome determined in the first step in the quantized current-level space of the nanopore flow cell (refer to Supplementary Section S1.1 for more details on the quantization method and the choice of quantization level). However, HQAlign differs from QAlign method because of three key reasons: (i) in the original implementation of minimap2 (Li 2018), it only uses the low occurrence minimizers during read mapping, which leads to misalignments, especially, in the highly repetitive regions. The new modifications in minimap2 (Li 2021) address this problem with a heuristic that adds additional lowest occurrence minimizers to the chain if the two adjacent anchors in the original chain are far apart. The implementation of HQAlign also addresses this issue in a different (and complementary manner) by focusing on a narrow region on the reference to enable alignments with a better chaining score, and the statistics to quantify the improvement in HQAlign over the modifications in minimap2 (Li 2021) are in Supplementary Section S1.3. (ii) QAlign has a high false discovery rate for SV detection because it is not optimized for the downstream SV callers (such as Sniffles), and was solely designed for the purpose of accurate alignments of the nanopore reads using the current-level modeling (refer to Supplementary Section S1.3 for statistics and more details). (iii) Further, we have modified the minimap2 (v2.24) pipeline for the simultaneous alignment of the quantized forward and the quantized reverse complement read sequences to the quantized region of interest on the genome in the hybrid step. This enables resolving the high false discovery rate for SVs in QAlign and the detection of the inversion variants within the alignment using the quantized sequences. This is explained in detail in Section 2.2. Further, HQAlign is more than 2.5× faster than QAlign standalone as it narrows down the seed search domain for lower alphabet size (e.g. three levels) in QAlign. This strategy is explained in Fig. 2b, and mathematically in the following sections.
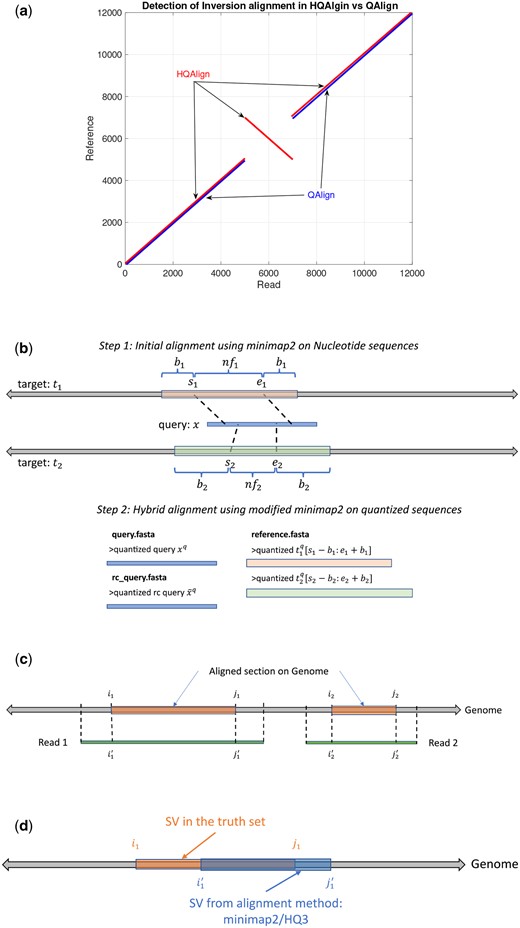
(a) An example to demonstrate the ability of HQAlign pipeline to align inverted sequences where QAlign fails. (b) An example of HQAlign pipeline. (c) An example of read-to-genome alignment. (d) Comparison of SV in truth set to SV determined by the method: minimap2/HQ3.
2.1 Initial alignment
The nucleotide query x is aligned to a nucleotide target sequence t using minimap2. This is similar to aligning a read to a genome with one chromosome. Here, we consider only one chromosome in target t for simplicity but the method generalizes to multiple chromosomes in t such as (this generalization is explained in detail in Supplementary Section S1.2). This step identifies the regions of interest on the target t, say, , where represent one or more alignments on t and and are the corresponding start and end location of each alignment i on target t, respectively.
2.2 Hybrid alignment
In this step, the query x is re-aligned to an extended region of interest on the target in the quantized current-level space, where and , is an appended extension of the region of interest on target, is the fraction of read aligned in the initial step, and n is the length of the query x. The nucleotide query x and the nucleotide extended target are converted to the quantized query and quantized extended target , respectively, using the quantization method demonstrated in QAlign (refer to Supplementary Section S1.1 for more details on quantization process).
It is important to note that we do not use any additional soft information, such as raw current signals from nanopore sequencing in the quantization process, instead, we translate the base-called nucleotide reads to current levels using the Q-mer map (in Fig. 1a) and then hard threshold the current levels to finite (e.g. three) levels to get the quantized (HQ3) reads (in Fig. 1c). The choice on three levels of quantization is because of the following reasons: (i) using a coarser quantization to only two levels makes it difficult to accurately align low complexity sequence in a repetitive region containing an SV, therefore, it becomes hard for the variant caller to make a confident call for such SVs due to high variance of the SV breakpoints. (ii) Using higher level of quantization requires a match in the current levels at a finer level for the alignment of sequences. As we observe from the Q-mer map of R9.4 nanopore flow cell (shown in Fig. 1a), the difference between the median current values of the consecutive 6-mers is very small. Therefore, a finer quantization leads to a higher rate of implied substitution errors due to quantization. In this article, we show that the coarse three level quantization (HQ3) is sufficient to obtain good accuracy for SV calling as well as fast alignment.
These quantized sequences are then aligned using a modified pipeline of minimap2 (v2.24). We have modified minimap2 pipeline for this hybrid step to take the quantized reverse complement query as an input, which helps in identifying the inversion SVs within the contiguous alignment of quantized sequences, which was not possible with the earlier QAlign method as shown in Fig. 2a. QAlign uses the default minimap2 pipeline for the alignment of quantized sequences. While minimap2 can inherently compute and align the reverse complement of a read in the nucleotide domain, the quantized reverse complement sequence cannot be computed given only the forward quantized sequence, therefore, QAlign separately aligns both quantized forward and quantized reverse complement sequence. This method, however, fails to identify an inverted alignment as shown in Fig. 2a, and also results in a high false discovery rate for SV calling since it is not optimized for the downstream SV callers, such as Sniffles2. Therefore, in HQAlign, we have modified the minimap2 pipeline to enable alignment using both quantized forward and quantized reverse complement sequences, simultaneously. Note that the quantized alignment employs a different minimizer length k = 18 in minimap2 for ternary (HQ3) quantization.
We define several metrics that are used for the performance evaluation of HQAlign against minimap2 [some of these metrics are used from the earlier QAlign method (Joshi et al. 2021)].
well-aligned: Consider in Fig. 2c, Read 1 aligns at location through on the genome determined using nucleotide alignment. We say that the read is well-aligned if at least 90% of the read is aligned onto the genome (i.e. ), and has high mapping quality (>20). This metric quantifies the reads that are mapped almost entirely to the reference.
- normalized edit distance: In order to compare the quality of the alignments at a fine-grained level, we further define normalized edit distance. The normalized edit distance for nucleotide alignment is defined as(1)and for quantized alignment is(2)
where are the start and end location of alignment on the genome in nucleotide space and are the start and end location of alignment on the genome in the quantized space, r is the entire read and G is the genome. It is important to note that for computing the normalized edit distance for alignments in the quantized space, we only leverage the information of the location of the alignment on genome from quantized space, i.e. and , but the edit distance between read and the aligned section on the genome is computed on the nucleotide sequences. This metric gives a measure of the distance similarity between two sequences, especially, used for the real data where the truth of sequence sampling location is not known.
- normalized alignment length: Another metric at the fine-grained level is normalized alignment length, which is the ratio of the length of the section on the genome where a read aligns to the length of the read. It is(3)for nucleotide alignment, and(4)
for quantized alignment. A contiguous alignment tends to have this metric as one. This metric gives a measure of the contiguity of the alignment.
2.3 SV calling
The alignments from HQAlign and minimap2 in sorted bam format are used to detect SVs using Sniffles2. These calls are benchmarked against a truth set using Truvari (English et al. 2022). We have used the F1 score, precision, and recall as the metric to analyze the performance of HQAlign and compare them with minimap2. Precision (P) is defined as the fraction of SVs detected by the algorithm in the truth set among the total SVs detected by the algorithm. Recall (R) is the fraction of SVs detected by the algorithm in the truth set among the total SVs in the truth set. F1 score is the harmonic mean of precision and recall (). Further, we have observed that there are many complementary SV calls made by both minimap2 and HQ3 that are missed by the other method. Therefore, we have defined a union model, which takes a union of the SV calls from both minimap2 and HQ3. The precision, recall, and F1 score of the union model are also computed and reported in Supplementary Table S6.
Further, the quality of the SVs for the common calls in minimap2 and HQAlign is evaluated by comparing the following metrics w.r.t. the SVs in truth set
- breakpoint accuracy: Breakpoint accuracy is measured by taking an average of the difference in the start and end breakpoint of the SV w.r.t. the SV in truth set. For instance, as shown in Fig. 2d, and are the start and the end point on the genome of SV in the truth set, and and are the start and the end point of the same SV determined by any alignment method (minimap2/HQ3), then breakpoint score is calculated as(5)
where is absolute value function. Therefore, the lower the score higher the breakpoint accuracy of the SV determined by the alignment method.
- SV length similarity: SV length similarity is measured as the ratio of minimum SV length in the truth set and from the algorithm to the maximum of two values. Mathematically, it is(6)
for the example shown in Fig. 2d.
3 Results
In this section, we demonstrate the results for (i) comparison of alignments from HQ3 and minimap2 on real as well as simulated data, and (ii) comparison of SV calls from HQ3 and minimap2 alignments using Sniffles2 as the variant caller on real and simulated data.
3.1 DNA read-to-genome alignment
3.1.1 Datasets
We have used the publicly available R9.4.1 ONT PromethION reads dataset from HG002 sample (Ren and Chaisson 2021). These reads are aligned to the recent telomere-to-telomere assembly CHM13 and the human reference genome GRCh37. GRCh37 is used as the reference build to map the real data so that the curated variants can be used for accuracy analysis (Zook et al. 2020). Further, we have also benchmarked the performance of HQAlign and minimap2 on simulated data for both alignments and SV calling.
3.1.2 Alignment results
The alignment of DNA reads to the genome is a primitive step in SV calling pipelines (DePristo et al. 2011). HQ3 alignments show an improvement over minimap2 alignments in terms of contiguity measured by normalized alignment length and alignment quality measured by normalized edit distance.
The results are illustrated in Fig. 3, Supplementary Figs S6 and S7, and Table 1. At a coarse level, the performance is measured by the fraction of the reads that are well-aligned by the algorithm. A read is well-aligned if at least 90% of the read is aligned to the genome and has a high mapping quality (see Section 2). HQAlign improves the fraction of well-aligned reads than minimap2—in particular, in the HG002 R9.4.1 reads alignment to T2T CHM13 reference, this metric improves to 89.35% from 85.64%, and for the alignments to GRCh37 reference, this metric improves to 86.65% from 83.48%. Furthermore, there are 310 036 reads (from the entire dataset with 10.36M reads) with at least 1 kb additional bases aligned using HQAlign compared to minimap2 alignments for T2T CHM13 reference, and there are 299 896 reads with at least 1 kb additional bases aligned using HQAlign compared to minimap2 for GRCh37 reference.
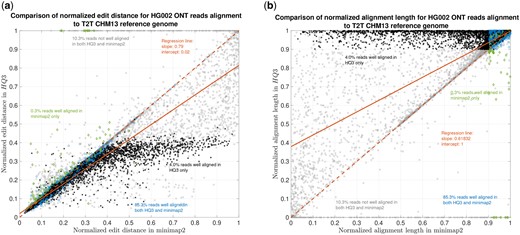
HG002 nanopore long DNA reads alignment onto T2T CHM13 genome. (a) Comparison of normalized edit distance for HG002 R9.4.1 PromethION reads data. Smaller values for normalized edit distance are desirable as it represents better alignment. The slope of the regression line is , therefore, representing better alignments with HQ3 than minimap2 alignments for the same reads on average. (b) Comparison of normalized alignment length for HG002 R9.4.1 PromethION reads data. Normalized alignment length of 1 is desirable as it represents that the entire read is aligned. The majority of the reads are above line representing longer alignment length in HQ3 than minimap2 alignment.
The results in Fig. 3 and Supplementary Fig. S6 compare the quality of the alignments using minimap2 and HQAlign at a fine-grained level for HG002 ONT reads alignment to T2T CHM13 genome and GRCh37 genome, respectively. Figure 3a and Supplementary Fig. S6a compare the normalized edit distance for HQAlign and minimap2. The normalized edit distance is the edit distance between the entire read and the aligned section on the genome normalized by the length of the read, in nucleotide domain for both minimap2 alignment and quantized alignment (HQ3). In the case of HQ3, the information of the location of the alignment on the genome is leveraged from the quantized read and the quantized genome alignment, and the edit distance is computed between the corresponding nucleotide read and the aligned region on the nucleotide genome (see Section 2 for details). Intuitively, the normalized edit distance gives a measure of how close the two sequences are. Therefore, the smaller the normalized edit distance, the better the alignment.
Figure 3a shows that for alignments of the reads to T2T CHM13 reference, the normalized edit distance is on average smaller for HQ3 alignments than minimap2 alignments. The better alignment in HQ3 is also evident from the slope of the regression line in Fig. 3a. It shows that on average HQ3 alignments have 21% improvement in terms of the normalized edit distance than the minimap2 alignments. Well-aligned reads in both HQ3 and minimap2 are represented by blue circles in Fig. 3, well-aligned reads in HQ3 only are represented in black asterisks, well-aligned in minimap2 only are represented in green diamonds, and reads that are not well-aligned in both are represented in grey squares. Further, it is important to note that for normalized edit distance <0.1, the alignments are marginally better in the DNA space, but for normalized edit distance higher than 0.1, the alignments are significantly better in HQ3 space, especially, the 4% reads that are well aligned in HQ3 and not well aligned in minimap2. This is because of the higher contiguity of alignments in HQ3 space and signifies the improvement by HQ3 when the error rates are higher. For alignments to GRCh37 reference, HQ3 has an average improvement of 17%, as shown in Supplementary Fig. S6a.
The results for another fine-grained metric are shown in Fig. 3b and Supplementary Fig. S6b, which compares the normalized alignment length in HQ3 to the normalized alignment length in minimap2 alignments. The normalized alignment length is the ratio of the length of the section on the genome where a read aligns to the length of the read. In Fig. 3b, there are 4% reads that are well-aligned in HQ3 only, and the normalized alignment length is close to one in HQ3 but it is much <1 in minimap2, therefore, representing several non-contiguous alignments in nucleotide domain that are captured as contiguous alignment in HQ3. In Supplementary Fig. S6b, there are 3.7% that are well-aligned in HQ3 only.
We have also benchmarked the performance of HQAlign with the simulated reads data and compared its alignment performance with minimap2 in Supplementary Fig. S7. The ONT reads are simulated from Chromosome 8 and X of CHM13 T2T assembly using nanosim (Yang et al. 2017) with coverage of 40×, median and mean read length 4.5 and 14 kb, respectively. The results show that the alignment performance of both HQAlign and minimap2 are at par with each other.
3.2 SV calling
3.2.1 Dataset
Long-read sequencing plays an important role in detecting structural variations. We evaluated SV detection using minimap2 and HQAlign with Sniffles2 as the variant calling algorithm on both real and simulated data. We simulated 2000 INDELS and 200 Inversion SVs on Chromosome 8 and X of T2T CHM13 reference genome using SURVIVOR (Jeffares et al. 2017) with SV length uniformly distributed between 50 and 10 000 and the ONT reads are simulated using nanosim with an average length of 14k, median length of 4.5k, and maximum length 2.5Mbp at coverage of 40×. We have used Truvari to benchmark the calls against the truth set. For real data alignment with GRCh37 as the reference genome, the SV calls are compared against the ground truth sets from (i) Genome In A Bottle (GIAB) Tier 1 calls (Zook et al. 2020) and (ii) another truth set is constructed by comparing the haplotype-resolved assembly of HG002 against GRCh37 reference genome using dipcall (Li et al. 2018). For T2T CHM13 reference genome, since the ground truth for SVs is not available, we have constructed the truth set by comparing the haplotype-resolved assembly of HG002 against CHM13 reference using dipcall. However, it is hard to establish ground truth for the SV calls that are made in the centromere regions, even though the assembly is likely to be correct. Therefore, we have provided both the analysis including the SV calls in centromere regions (in Figs 4 and 5) and the analysis for SV calls excluding the centromere regions (in Supplementary Figs S11 and S14).
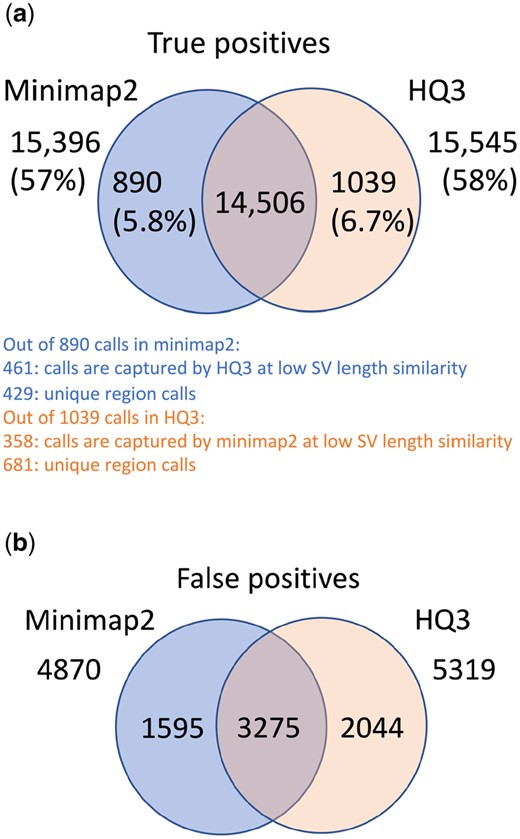
Comparison of SV calls from HQ3 and minimap2 with HG002-to-CHM13 dipcall as truth set. (a) Comparison of true positive calls. (b) Comparison of false positive calls.
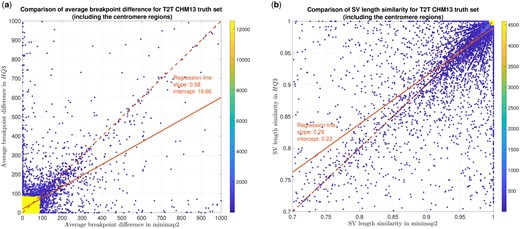
SV quality comparison for common true positive calls in HQ3 and minimap2 against HG002-to-CHM13 dipcall truth set. (a) Comparison of SV breakpoint accuracy in HQ3 and minimap2 for common true positive calls. The difference in SV breakpoint is compared to the truth set generated from comparing HG002 haplotype-resolved assembly to T2T CHM13 build. A smaller difference represents better breakpoint accuracy. Therefore, the slope of the regression line represents better accuracy of HQ3 than minimap2 on average. (b) Comparison of SV length similarity in HQ3 and minimap2 for common true positive calls. The slope of the regression line represents better SV length in minimap2 than HQ3 on average, but the intercept is high (0.23). However, this is due to a large density of SVs with length similarity in both minimap2 and HQ3. For length similarity <0.95, HQ3 has better performance than minimap2.
3.2.2 SV calling results
The standalone performance of both HQ3 and minimap2 is at par with each other across different references and truth set used in this study for real data as well as for the simulated data in terms of the F1 score. However, both HQ3 and minimap2 detect complementary SV calls most likely in the repeat regions where accurate alignment is difficult and therefore, leads to many broken calls.
The analysis with comparison of SV calls from HQ3 and minimap2 with GIAB Tier 1 truth set gives a precision, recall, and F1 score of 0.94, 0.94, and 0.94, respectively, for both minimap2 and HQ3. A union model of minimap2 and HQ3 can improve the recall rate at the same F1 score, and the union model has a precision, recall, and F1 score of 0.93, 0.95, and 0.94, respectively. Moreover, out of 103 SV calls that are made by HQ3 only (Supplementary Fig. S8), 41 calls are made by minimap2 alignments at a lower SV length similarity, and 62 calls are unique region calls. Out of 105 SV calls made by minimap2 only 51 are captured by HQ3 at a lower SV length similarity and 54 are unique region calls. HQ3 improves the breakpoint accuracy by 14.11% for calls that have difference in breakpoints higher than 50 and it improves the length similarity by 19.97% that have SV length similarity lower than 0.95 (Supplementary Fig. S12a and b).
We have compared the SV calls made by HG002 reads against T2T CHM13 reference genome using both minimap2 and HQ3 and benchmarked them against the truth set generated by comparing HG002 haplotype-resolved assembly to T2T CHM13 assembly. The standalone performance has precision, recall, and F1 score of 0.77, 0.57, and 0.66, respectively, for minimap2 and 0.75, 0.58, and 0.65, respectively, for HQ3. However, because of the high number of complementary true positive calls in minimap2 and HQ3, the union model has a significantly improved recall at the same F1 score with precision, recall, and F1 score of 0.71, 0.61, and 0.66, respectively. Out of 1039 (6.7%) calls that are made in HQ3 only 358 are captured by minimap2 at a lower SV length similarity threshold and 681 are unique calls, whereas out of 890 (5.8%) calls that are made by minimap2 only 461 are captured by HQ3 at a lower SV length similarity threshold and 429 are unique (as shown in Fig. 4a). Further, for the common true positive calls in both minimap2 and HQ3, we observe a similar pattern as the other datasets in the improvement of breakpoint accuracy with HQ3 by 18.66% for calls that have a difference in breakpoint >50, and improvement in SV length similarity by 19.76% for calls with similarity <0.95 (Fig. 5a and b).
SV calls from HG002 reads alignment to GRCh37 are benchmarked against the truth set generated by comparing HG002 haplotype-resolved assembly to GRCh37. Minimap2 has precision 0.78, recall 0.76, and F1 score 0.77 while HQ3 has precision 0.79, recall 0.75, and F1 score 0.77. Out of 16 462 true positive calls in HQ3, 703 (4.27%) are made only in HQ3 with SV length similarity to the truth set >0.7 (default parameter in Truvari). However, 376/703 calls that are captured by minimap2 with SV length similarity <0.7 and 327/703 calls that are uniquely made by HQ3. Likewise, out of 16 620 true positive calls in minimap2, 861 (5.18%) are made only in minimap2 with SV length similarity >0.7. However, 524/861 are captured by HQ3 with SV length similarity <0.7, and 337/861 are uniquely made by minimap2. A fine-grain analysis of the common true positive calls by minimap2 and HQ3 in Supplementary Fig. S13a shows that a major density of SV calls (81.85%) have a difference in breakpoint below 50 in both minimap2 and HQ3, and minimap2 has marginally better performance in terms of a lower difference in breakpoint of SVs that have a value below 50. Whereas, for a large difference in the SV breakpoint (>50), HQ3 is better in terms of the breakpoint accuracy of the SV calls (on average across all SV calls). Therefore, HQ3 improves the SV breakpoint for the rest 18.15% calls that have high differences in breakpoints. Further, Supplementary Fig. S13b demonstrates that HQ3 has better SV length similarity when the length similarity is below 0.95, which corresponds to 21.82% calls.
4 Discussion
HQAlign method is an alignment method designed for the detection of SVs for nanopore sequencing reads. HQAlign provides alignment that outperforms the recent minimap2 aligner in terms of the accuracy and quality of the alignments. The SV calling from HQAlign is also at par with minimap2 in terms of F1 score and it outperforms minimap2 SV calls in terms of the quality of SVs measured in breakpoint accuracy and SV length similarity. Moreover, there are many complementary SVs captured by HQAlign that are missed by minimap2 alignments.
The reason for this improvement in the performance of alignment and SV calling with HQAlign is that it takes into account the underlying physics of nanopore sequencer through the Q-mer map, which could be one of the major causes of the high error rates in nanopore sequencing, and also it focuses on a narrow region of the genome (where the read aligns in nucleotide domain) for alignment with quantized sequences. Further, this pipeline is adapted specifically for the detection of SVs. We demonstrated how HQAlign utilizes the bias of Q-mer map without accessing the raw current signal of nanopore sequencer by translating the base-called nucleotide sequences to quantized current-level (of finite alphabet size) sequences. This improvement helps in detecting several SVs that are missed by minimap2 due to high error rates in the nanopore reads. Further, the recall rate for SV detection can be improved by combining the complementary calls from both HQ3 and minimap2 in the union model at the same F1 score.
Author contributions
D.J., S.K., and S.D. conceived the original idea and developed the project. D.J. led the development of the software tool and its open-source development. M.J.P.C. helped with SV metrics, datasets, and SV comparison analysis between methods. D.J. performed the analysis on the various datasets for both alignment and SV calling. All the authors wrote the manuscript.
Supplementary data
Supplementary data are available at Bioinformatics online.
Conflict of interest
None declared.
Funding
S.D. and D.J. were supported in part by National Science Foundation [1705077, 2007714, and 2146838]. S.K. was supported in part by National Institutes of Health [1R01HG008164] and National Science Foundation [1651236 and 1703403]. M.J.P.C. was supported by National Institutes of Health [R01HG011649].

