


Abstract
Recently, various approaches for diagnosing and treating dementia have received significant attention, especially in identifying key genes that are crucial for dementia. If the mutations of such key genes could be tracked, it would be possible to predict the time of onset of dementia and significantly aid in developing drugs to treat dementia. However, gene finding involves tremendous cost, time and effort. To alleviate these problems, research on utilizing computational biology to decrease the search space of candidate genes is actively conducted.
In this study, we propose a framework in which diseases, genes and single-nucleotide polymorphisms are represented by a layered network, and key genes are predicted by a machine learning algorithm. The algorithm utilizes a network-based semi-supervised learning model that can be applied to layered data structures.
The proposed method was applied to a dataset extracted from public databases related to diseases and genes with data collected from 186 patients. A portion of key genes obtained using the proposed method was verified in silico through PubMed literature, and the remaining genes were left as possible candidate genes.
The code for the framework will be available at http://www.alphaminers.net/.
Supplementary data are available at Bioinformatics online.
1 Introduction
Developments in computational biology significantly decrease the tremendous cost, time and effort required for existing biological experiments. Computational biology enables further research in identifying key genes involved in diseases (Nam et al., 2019; van Dam et al., 2018; Venter et al., 2001). Key genes play a central role in diseases affected by genetics and serve as a biomarker that can objectively measure the normal or pathological condition of a living organism and the degree of response to drugs. Therefore, the determination of new disease-related key genes can lead to developments in new diagnosis and treatment of diseases. Diseases that can considerably benefit from key gene identification include genetic diseases such as Huntington’s disease, down syndrome and hemophilia (Griffiths et al., 2005). Among the diseases, dementia is considered a serious issue that is potentially more significant given the pervasiveness and seriousness of dementia in an aging society. Specifically, over 70% of the pathogenesis factors for Alzheimer disease (AD) account for genetic effects and other classes of dementia such as Lewy body dementia, frontotemporal dementia and cerebral autosomal dominant arteriopathy with subcortical infarcts and leukoencephalopathy (CADASIL) are known to be affected by genetic factors (Loy et al., 2014; Paulson and Igo, 2011). Therefore, research on identifying key genes that cause dementia using computational biology is actively conducted worldwide. If it is possible to track mutations of key genes, this can greatly aid in the early prediction of the onset of dementia and development of drugs for treating dementia. Representatively, the ε-type of Apolipoprotein E (ApoE) is a well-known key gene for AD (Genin et al., 2011; Querfurth and LaFerla, 2010; Reitz and Mayeux, 2014). ApoE facilitates the cohesion or accumulation of amyloid β-peptide (Aβ) and regulates the structure and toxicity of Aβ. In addition, numerous genomic studies reported that various genes other than ApoE, such as CLU, CR1, PICALM, BIN1 and SORL1, are related to AD and research focuses on verifying the relationships (Lambert et al., 2013). Clusterin (CLU) plays a similar role to ApoE in which it converts Aβ into an insoluble form or regulates toxicity, and complement receptor 1 (CR1) regulates the main receptors of complement C3b, which is related to the removal of Aβ (Carrasquillo et al., 2010; Lambert et al., 2009). Phosphatidylinositol-binding clathrin assembly protein (PICALM) contributes to synaptic dysfunction and affects amyloid precursor protein (APP) mechanism via the endocytic pathway (Harold et al., 2009), and so on (Chapuis et al., 2013; Pottier et al., 2012; Rogaeva et al., 2007). Hence, various genes are observed as associated with dementia in a manner similar to ApoE.
To date, most genetic studies related to dementia were conducted through genome-wide association studies (GWAS) by selecting specific single-nucleotide polymorphisms (SNPs) that exhibit singularities in the patient group and targeting genes that contain selected SNPs. In GWAS, genotypes in SNPs between patient and control groups were compared, and genes related to specific diseases were discovered by mapping markers that are associated with a specific disease (Bush and Moore, 2012; Manolio, 2010). SNP is the most common form of DNA sequence polymorphism due to the difference in single base-pair variation in DNA among individuals. It is especially useful for high-throughput genotyping owing to its low mutation rate, high incidence and stability between generations on genomes. Therefore, it can be used as a marker for physical mapping and genetic mapping in addition to receiving spotlights as a marker for examining complex genetic traits.
However, in the case of GWAS that are generally performed, the influence of each SNP is confirmed through statistical analysis, which leads to a limitation of not reflecting complex interactions that occur in a living body. Although it is difficult to find a significant statistical difference between patient and control groups with individual SNPs, when several SNPs are considered at once, there can be unexpected large biological effects (Levine et al., 2017; Liu et al., 2011, 2012). Additionally, SNPs can interact with genes when considering multi-genomic levels. SNPs appear at some locations in a gene and can affect the structure or function of the gene. The presence/absence or mutation of a gene is related to a disease, and thus it is appropriate to consider the SNP-gene-disease relationship when identifying key genes of a disease. In summary, identification of key genes of a disease should consider interactions at the SNP level (intra-relation) and also the association with the disease through the interaction with genes that are situated at a higher level (inter-relation).
In this study, we implement the concept of hierarchically structured networks that reflect the mutual systematic relationships of various biological levels. More specifically, a layered network with each consisting of SNPs, genes and diseases with intra-relation within a layer and inter-relation between layers are included in the hierarchically structured network. When dementia is set for the target disease, the hierarchical structure of the network allows SNP information in the gene network to emphasize specific genes that may play a significant role in dementia. We define such genes as candidate key genes. To provide predictions of candidate key genes, a machine learning algorithm, hierarchical semi-supervised learning (SSL) (Kim et al., 2019) is employed. SSL, which is crucial for the proposed method, is a machine learning algorithm that is effective for predictions when there is a paucity of information (Chapelle et al., 2009; Zhu and Goldberg, 2009). Candidate key genes for AD are suggested via the proposed framework.
2 Overview of the method
The proposed method consists of constructing a multi-layered network with public and disease-specific data and predicting candidate key genes that can affect dementia via a machine learning algorithm. The process of comparing information of dementia patient group with that of control group is necessary to identify key genes. Furthermore, if it is possible, it is necessary to integrate and use various levels of data generated from the genome. The proposed method consists of two major steps to fulfill the requirements.
First, the disease network and gene network are constructed from public data. For the disease network, diseases are connected by calculating similarities between diseases. Similarly, genes in the gene network are linked by computing similarity between genes. After construction, both networks are connected by using disease–gene relations and result in a layered network. The SNP network from dementia patients is introduced to construct the dementia-specific multi-layered network. SNPs obtained through GWAS between the dementia patient group and control group are linked based on the similarity between them on the network. The completed SNP network is connected to the lower side of the constructed gene network. For connecting gene and SNP networks, the relations between them are used in which genes and specific SNPs that are included in the gene are connected. On the completed three-layered network, a SSL algorithm is applied to generate scores for candidate key genes of dementia. Genes that are ranked on top of the list of scores are recommended as candidate key genes. The scoring algorithm utilizes network-based SSL, which considers a multi-layered structure in prediction. Figure 1 shows a schematic description of the proposed method. Detailed information on the proposed method is given in the following sections.
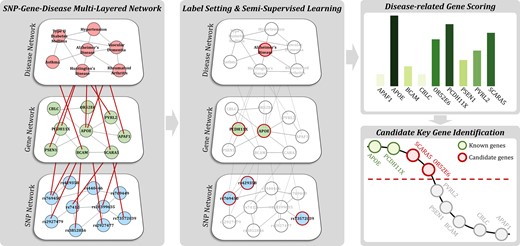
Schematic description of the proposed method. First, a multi-layered SNP-gene-disease network is constructed from public- and disease-specific data. Subsequently, SSL for the hierarchical structure algorithm is applied with labels to score genes. Finally, candidate key genes are recommended based on the ranks of genes in which associations with diseases are yet unknown
3 Multi-layered network construction
Generally, a network (or a graph) is represented by , where nodes represent data points (elements) and edges represent connections between nodes. The edges in the proposed method quantify similarity or interaction between two different nodes. Each edge weight, , ranges in and higher of its value reflects higher degree of relation between two nodes and . In addition, a multi-layered network is constructed to reflect the mutual and multi-layered relations between SNP-gene-disease. In the multi-layered network, there are two types of relations of intra-relation and inter-relation in which the former represents an association between two nodes within a layer and the latter represents the association between two nodes in different layers. In this section, we explain methods to construct intra-relations of separate networks of disease, gene and SNP with inter-relations of disease–gene and gene–SNP.
3.1 Disease network
The calculated edge weights exhibit higher values for a higher number of related genes shared by the two diseases, and this translates to values implying higher similarity between the two diseases.
3.2 Gene network
3.3 SNP network
3.4 Inter-relations between networks
Disease, gene and SNP networks are separate single networks where edges represent associations between nodes at the same level. Meanwhile, inter-relations depict inter-layer relationships in which associations between two nodes in different levels are represented. The multi-layered network proposed in the study constructs inter-relations based on information of SNPs belonging to specific genes and genes affecting specific diseases. Inter-relation weights take binary values of 1 if a relation exists between two nodes and 0 otherwise.
4 Dementia-related key gene identification
From the constructed network, key genes for dementia are prioritized using a machine learning algorithm that considers the mutual interactions between entities from different layers. To reflect this notion, we employ a graph-based SSL algorithm (Tsuda et al., 2005; Zhu et al., 2005).
4.1 Graph-based semi-supervised learning
4.2 Semi-supervised learning for multi-layered networks
In general, a graph-based SSL algorithm is used for single networks. The SNP-gene-disease network constructed in the study has three-layered structure. Thus, we employ an SSL algorithm specialized for a multi-layered structure (Kim et al., 2019). The layer-wise intra-relation and inter-relation between layers of the proposed SNP-gene-disease network is shown in Figure 2.
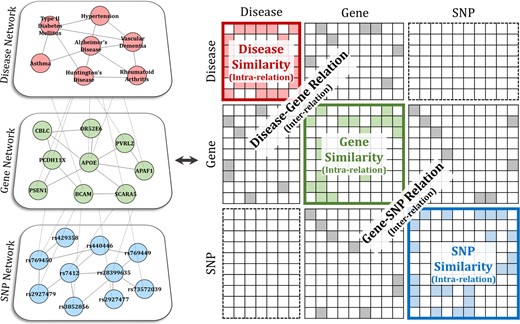
Representation of the multi-layered network as a matrix. The constructed SNP-gene-disease network is represented by a huge matrix that contains both intra-relation and inter-relation
The problem of applying Equation (2) to this type of a huge matrix can lead to intractability in calculation. A method proposed by Kim et al. (2019) is employed to boil down high computational complexity. To alleviate the problem, it first separates the huge matrix in Figure 2 into and , then obtains the exact solution with Equation (2) for the intra part and approximate solution for the inter part. Given the separation, the graph Laplacian matrix is represented as .
4.3 Labeling
In the SSL algorithm, label information is necessary. In other words, in Equation (2) or (3) is necessary for the prediction process. Labels for each layer can be set as follows: for the disease network, the disease dementia is assigned with label ‘1’ and others as ‘0’. In the gene network, the genes already known to be involved with dementia are assigned with label ‘1’ and others as ‘0’. For the SNP network, SNPs with a high association with dementia are set with label ‘1’. The associated SNPs are selected based on the following five statistical tests: chi-square test, Cochran Armitage trend test, Hardy–Weinberg equilibrium test, Jonckheere–Terpstra test and logistic regression model. From the five tests, the lowest P-value is set as the representative P-value for each SNP. SNPs with a P-value below a threshold are selected, and label ‘1’ is assigned. After setting the label information in this manner, the top-ranked genes through Equations (3) and (4) are recommended as candidate key genes for dementia.
5 Experiments
5.1 Data
Table 1 summarizes the source and number of data used for the experiments. The collected data can be separated into dementia-specific data and public data. For dementia-specific data, we collected human biospecimens from the chronic cerebrovascular disease-oriented biobank in Korea. The biobank has been led by Ajou University Hospital since 2016 and has secured differentiated and advanced human resources for patients with vascular dementia (VD), vascular depression and AD from numerous consortium hospitals and mental health welfare centers. Thus, clinical data of patients as well as human biospecimens (such as bloods, plasmas, serums, fibroblasts, brain tissues and cerebrospinal fluids, etc.) are being collected (http://www.dementia-biobank.org). From the collected data, patients’ genotypes for 827 783 SNPs were obtained through genotyping using the KoreanChip. The KoreanChip is an SNP microarray chip containing approximately 830 000 SNPs developed and produced by the Korean National Institute of Health. It is an optimized chip for genome research of the Korean population (Moon et al., 2019). The third row in Table 1 summarizes the public data used in the experiment. The names of diseases that constitute the disease network were collected from Medical Subject Headings (MeSH) and were standardized. The disease–gene (protein) relation information for intra-relation for disease network and inter-relation for disease and gene network was collected from PharmDB. PharmDB extracts information on relations between disease, drug and protein from multiple databases, such as the comparative toxicogenomics database (CTD), genetic association database (GAD), online Mendelian inheritance in man (OMIM) and pharmacogenomics knowledge base (PharmGKB) (Lee et al., 2015). Information on gene and PPI for the gene network was collected from STRING as shown in Section 3.2. SNP and gene–SNP relation information were collected from dbSNP, which is managed by the National Center for Biotechnology (NCBI). About 400 million SNP related data materials are stored in dbSNP and provide information on registered SNPs in which a unique rs number is assigned to each.
Data description for experiments
| Data sources | Number of data | |
|---|---|---|
| Patient genome information | Chronic cerebrovascular disease-oriented biobank | 827 783 SNPs of 186 patients |
| Disease | MeSH (http://www.nlm.nih.gov/mesh) | 4798 diseases |
| Gene (protein) | STRING (version 10.5) (http://string-db.org) | 20 457 genes (proteins) |
| SNP | dbSNP (http://www.ncbi.nlm.nih.gov/SNP) | 381,785,470 SNPs |
| Disease–gene relation | PharmDB (http://www.pharmdb.org) | 153 118 relations between 2727 diseases and 23 022 proteins |
| Gene-SNP relation | dbSNP (http://www.ncbi.nlm.nih.gov/SNP) | 333 845 887 relations between 817 918 genes and 312 846 021 SNPs |
5.2 Patient group definition
Information on 186 patients collected from the chronic cerebrovascular disease-oriented biobank is classified based on pathology. In the study, we focused on AD and VD, which are the most common diseases among various types of dementia. Thus, the patients diagnosed with normal condition or mild cognitive impairment (MCI) were defined as the control group. Patients with AD, VD, and simultaneous AD and VD pathologies are defined as three separate types of case group. Table 2 shows the statistics of patient data by different pathologies. The sixth column of Table 2 is mini-mental state exam (MMSE) score which is a test method to evaluate cognitive functions and screening dementia. From a total score of 30, a lower score indicates higher severity in cognitive impairment (Folstein et al., 1975).
Statistics of patient data by pathologies
| Pathology | Number of patients | Avg. age | Avg. MMSE score | ||
|---|---|---|---|---|---|
| Total | Female | Male | |||
| Normal/MCI (control) | 50 | 34 | 16 | 70.06 | 26.35 |
| Alzheimer disease (case 1) | 34 | 22 | 12 | 70.25 | 20.5 |
| Vascular dementia (case 2) | 42 | 29 | 13 | 72.63 | 22.28 |
| AD&VD (case 3) | 32 | 17 | 15 | 75.28 | 20.81 |
| Others | 26 | 16 | 10 | 72.23 | 23.08 |
| Omission | 2 | 1 | 1 | 71.5 | 24 |
| Total | 186 | 119 | 67 | 71.99 | 22.84 |
5.3 Results for the construction of SNP-gene-disease multi-layered network
From the collected data, three types of dementia-specific multi-layered networks were constructed based on different patient groups. For the purpose of convenience, we term each network as ADN, VDN and ADVDN. For all three types of patient groups, a two-layered network of diseases and genes were initially constructed using public data. Subsequently, the SNP network, constructed with genome information, was connected to the gene network through the proposed method.
For the disease network, the weighted edge has values based on the number of related genes (proteins) shared between diseases. For gene and SNP networks, the weighted edge takes values with a combined score computed from the STRING database and converted value from SNP–SNP interaction, respectively. The inter-relation edges indicate the existence of a relation with binary values 1 or 0. For the SNP network, only the SNPs registered in the dbSNP were extracted and used for analysis from a total of 827 783 SNP genotyping results. Table 3 summarizes the results of the constructed multi-layered network.
Result of SNP-gene-disease multi-layered network construction
| (a) Intra-layer relationships | ||||
|---|---|---|---|---|
| Number of nodes | Number of edges | Network density | ||
| Disease network | 2727 | 1 334 312 | 17.94% | |
| Gene network | 18 376 | 10 547 626 | 2.95% | |
| SNP networks | ADN | 129 771 | 283 954 | 0.0017% |
| VDN | 152 358 | 388 726 | 0.0017% | |
| ADVDN | 47 449 | 72 320 | 0.0032% | |
| (b) Inter-layer relationships | ||
|---|---|---|
| Number of relations | ||
| Disease-gene | 84 413 relations between 2702 diseases and 9023 genes | |
| Gene-SNP | ADN | 59 004 relations between 11 412 genes and 41 268 SNPs |
| VDN | 69 912 relations between 12 133 genes and 42 906 SNPs | |
| ADVDN | 21 498 relations between 6991 genes and 20 906 SNPs | |
The label setting for each layer in the multi-layered network is as follows: In the case of AD group, for example, the label of AD is set to 1 in the disease network, label of AD-related genes is set to 1 in the gene network, and the rest of diseases and genes are set to 0. In the SNP network, SNPs that are statistically significant through GWAS (P-value < 0.001, where δ = 0.001) are set with a label of 1, while the rest are set as 0. Figure 3 shows the process of selecting the labeled SNP for the AD group with the Manhattan plot. In the figure, 2532 SNPs above the red line have P-values less than 0.001, and thus are set with label 1. This corresponds to 1.95% of the total SNPs. Table 4 shows the number of labels and their ratios for each of the patient groups.
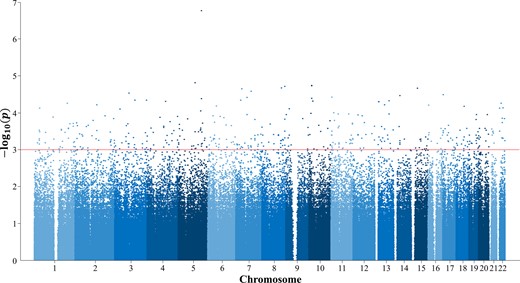
Manhattan plot for representative P values of SNPs in the AD group. For the labels in SNP network, significant SNPs are selected by statistical tests. For the experiment on the AD group, threshold δ was set to 0.001, in which 1052 SNPs were set as labels
Label setting for SNP-gene-disease multi-layered networks
| ADN | VDN | ADVDN | |
|---|---|---|---|
| Disease | 1 (Alzheimer disease) | 1 (Vascular dementia) | 2 (AD&VD simultaneously) |
| Gene (disease related) | 1052 out of 18 376 genes (5.56%) | 31 out of 18 376 genes (0.16%) | 1056 out of 18 376 genes (5.58%) |
| SNP (significant SNPs) | 2532 out of 129 771 SNPs (1.95%) | 2795 out of 152 358 SNPs (1.83%) | 851 out of 47 449 SNPs (1.79%) |
5.4 Performance comparison
The performance of the proposed dementia-specific three-layered network was compared with that of the gene-disease two-layered network without the SNP network. This was conducted to measure the effect of the genome information of dementia patients on predictive performance. The experiment was repeated 100 times with 10-fold cross-validation for the entire gene set. Gene scoring performance was measured by the area under the receiver operating characteristic curve (AUC). Figure 4 summarizes the results. In the AD group, additional connection to the SNP network improved the average AUC by 18% from 0.7750 to 0.9152 with stronger stability from the standard deviation perspective. However, for the VD group, the increase in the average AUC value was relatively lower although the stability improved. The AD&VD group exhibited an increase in the average AUC by 16% with improvements in stability by 69%.
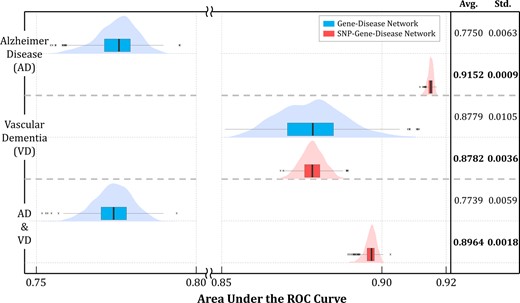
Performance comparison with inclusion of the SNP Network. When the SNP network was connected to the gene network through the proposed method, the prediction performances were distinctly improved for the AD group and AD&VD group. Furthermore, the standard deviation of performances for all three groups were reduced remarkably, exhibiting better stability
Pathologically, over 70% of the pathogenesis factors for AD are known as genetic. On the other hand, VD is caused by external factors rather than genetic factors in which damage in brain tissues is due to cerebrovascular diseases. The proposed method searches for genes that cause dementia, and thus the aforementioned result can be considered as reasonable. The AD&VD group indicated a compromised result between AD and VD because it contained a mixture of both genetic and non-genetic factors.
5.5 Results for dementia-related key gene identification
Figure 5 depicts the results of key gene identification by applying the proposed method to AD. It shows the sorted scores with a curve and the highlighted part presents genes that are ranked in the top 5% out of 18 376 genes. In the figure, the gray nodes indicate genes that are already known to be related to AD, the green nodes indicate genes that are yet unknown, and the red nodes indicate candidate key genes that are newly recommended through the proposed method. Genes that are placed higher in the rank indicate a higher possibility of being a candidate key gene. While most of the top-ranked genes belong to already known genes, new and unknown genes were still observed. These genes were termed as candidate key genes because they were not yet sufficiently tested clinically or tested in biological experiments. The possible verification in computational biology prior to biological or clinical experiments on candidate key genes is by retrieving literature. In other words, we can search for literature on the results of previous studies showing the same opinions on candidate genes through text mining and retrieval. While some of the candidate key genes were not registered in the public database, the association with AD was verified in the PubMed literature. For example, such genes are highlighted in red and marked with superscripts (a) to (d) in Figure 5. Clinical or biological implications extracted from the literature are as follows. Furthermore, Table 5 shows more candidate genes including four genes with PMIDs.
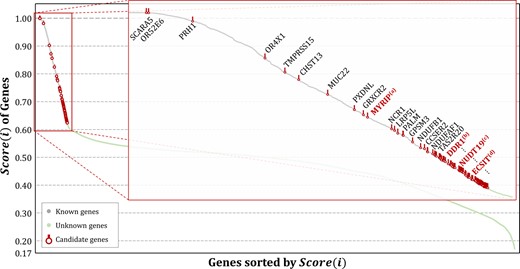
Results of key gene identification for AD. The proposed method provides scores for every gene and recommends candidate key genes based on the rank of genes where associations with AD are yet unknown. Some candidate genes were verified from PubMed literature reviews that present the possibility of affecting AD. The remaining genes are left as possible candidate genes
Literature verifications of candidate key genes for AD
| Ranks of candidate genes | Gene symbols | Verification (PMIDs) |
|---|---|---|
| 10 | MYRIP | 14517322, 21955788 |
| 19 | DDR1 | 28863860 |
| 24 | NUDT19 | 21321390 |
| 31 | ECSIT | 21163940, 22513506 |
| 35 | MYO5B | 27878761 |
| 37 | NDUFA12 | 22273362 |
| 47 | NDUFA5 | 19760337 |
| 48 | NDUFB3 | 26125932, 28474567 |
| 50 | NDUFA2 | 28474567 |
| 52 | NDUFA1 | 30466046 |
| 74 | C1QA | 18723004, 30283032 |
| 75 | QRFPR | 29027019 |
| 79 | NDUFA4 | 28578378, 29021705 |
| 80 | GPX4 | 19769463, 29246792 |
MYRIP(a): The study indicated that transmembrane protein 59 (TMEM59) is an important factor contributing to AD based on mouse neural stem cell differentiation. Furthermore, myosin VIIA and Rab interacting protein (MYRIP) directly regulates TMEM59 in the gene regulatory network (Zhang et al., 2011). Additionally, MYRIP is known to be involved with impaired insulin exocytosis, which is one of the pathogenesis of AD (Waselle et al., 2003).
DDR1(b): In the study, the authors detected that discoidin domain receptor tyrosine kinase 1 (DDR1) and DDR2 knockdown reduce the levels of α-synuclein, tau, and β-amyloid and prevent cell loss in vivo and in vitro. They suggested that DDR1 and DDR2 inhibition is a potential target to clear neurotoxic proteins and reduce inflammation in neurodegeneration (Hebron et al., 2017).
UDT19(c): Three differential “signature” genes, including nudix hydrolase 19 (NUDT19), were selected for specifying the early stage, seven for the late stage, and five were common to both groups of AD. The study suggested that these genes are potential biomarkers for the early and late stages of AD-like neurodegeneration (Arisi et al., 2011).
ECSIT(d): The study indicated an evolutionarily conserved signaling intermediate in Toll pathways (ECSIT) as a molecular link between oxidative stress, inflammation and mitochondrial dysfunction in AD based on the analysis of AD-associated protein interaction network (Soler-López et al., 2011, 2012).
The same procedure was applied to the networks of VD and AD&VD groups. In the case of VD, the number of related genes is very low, and thus most of the genes are identified as unknown genes. Among them, the priority of candidate key genes is derived based on the ranking of the scores. For the AD&VD group, the results were similar to those of the AD group albeit with different genes for recommendation. Readers can refer to the Supplementary File for more detailed information on the results.
6 Conclusions
With the emergence of a worldwide aging society, the population of people aged 65 and over is projected to increase up to 1.5 billion by 2050. As the population of older individuals surges, the prevalence rate of dementia is estimated at approximately 5–10% worldwide, and the dementia population (which was approximately 46.8 million in 2015) is expected to triple by 2050 and reach 131.5 million (United Nations, 2019). In addition, the social and economic costs associated with dementia are estimated at 1 trillion dollars in 2019 and are expected to double by 2030 (Alzheimer’s Disease International, 2019). Therefore, the necessity for early detection and prevention of dementia is increasingly highlighted along with increasing investments in R&D for dementia at the national level. Hence, it is undoubtedly important to overcome dementia, and methods to determine key genes (which are significantly involved in dementia) are receiving significant attention recently.
In this study, we proposed a method to construct a three-layered network of SNP-gene-disease and recommending key genes for dementia using a machine learning algorithm. The proposed method constructs a layered network by combining public- and disease-specific genomic data. The latter type of data was collected from the chronic cerebrovascular disease-oriented biobank consisting of data from dementia patient and control groups. The approach to construct a multi-layered network reflects the effect of mutual interactions between genes and SNPs on diseases. From an algorithmic perspective, genes that are already known to be related to dementia and significant SNPs from genotyping information are set as labels, and candidate key genes are ranked via applying a SSL algorithm. To reduce the high computational complexity that results from a huge matrix during the learning process, we employed a method proposed by Kim et al. (2019) that utilized the layered structure of the constructed network. The experimental results demonstrated the outstanding performance of the proposed method including SNP information when compared to that without SNP information. Furthermore, a portion of the candidate key genes, as recommended by the proposed method, was verified by finding relations to dementia through text mining and retrieval of PubMed literature. The remaining candidate key genes are left as possibly related genes that should be preferentially examined among numerous genes.
The proposed method is “disease-specific” key gene identifier. In this study, it is a dementia-specific key gene identifier since it was applied to the collected data targeting dementia. However, it is flexible in terms of application to other diseases if data are available. Additionally, if personal genomic information is directly plugged into the hierarchical network instead of patients’ group information, then it can be readily extended to “personalized” key gene identifier. Thus, the proposed method can be used as a tool for precision medicine. Furthermore, it has the potential to identify novel SNPs if the target is simply set to SNPs instead of genes.
There are some limitations of this study. The resulting network may be biased to the current dataset which has been collected from the chronic cerebrovascular disease-oriented biobank in Korea. To resolve the generalization issue, diverse public data such as those from Alzheimer's Disease Neuroimaging Initiative (ADNI) can be additionally incorporated into our approach. And further, a demographically match health cohort can be used to avoid the concern. These will be dealt in our future work.
Acknowledgements
This study was conducted with biospecimens and data from the biobank of Chronic Cerebrovascular Disease consortium. The consortium was supported and funded by the Korea Centers for Disease Control and Prevention (#4845-303). The authors would also like to gratefully acknowledge supported from the National Research Foundation of Korea (NRF) grant funded by the Korea government (MOE) (NRF-2018R1D1A1B07043524), the Brain Korea 21 Plus project (Department of Artificial Intelligence, Ajou University), and the Ajou University research fund.
Funding
This work was supported by the Korea Centers for Disease Control and Prevention [#4845-303], the National Research Foundation of Korea (NRF) grant funded by the Korean government (MOE) [NRF-2018R1D1A1B07043524] and the Ajou University research fund.
Conflict of Interest: none declared.
References
Alzheimer’s Disease International. (
United Nations, D.o.E.a.S.A. (

