


Abstract
Determining the structures of proteins is a critical step to understand their biological functions. Crystallography-based X-ray diffraction technique is the main method for experimental protein structure determination. However, the underlying crystallization process, which needs multiple time-consuming and costly experimental steps, has a high attrition rate. To overcome this issue, a series of in silico methods have been developed with the primary aim of selecting the protein sequences that are promising to be crystallized. However, the predictive performance of the current methods is modest.
We propose a deep learning model, so-called CLPred, which uses a bidirectional recurrent neural network with long short-term memory (BLSTM) to capture the long-range interaction patterns between k-mers amino acids to predict protein crystallizability. Using sequence only information, CLPred outperforms the existing deep-learning predictors and a vast majority of sequence-based diffraction-quality crystals predictors on three independent test sets. The results highlight the effectiveness of BLSTM in capturing non-local, long-range inter-peptide interaction patterns to distinguish proteins that can result in diffraction-quality crystals from those that cannot. CLPred has been steadily improved over the previous window-based neural networks, which is able to predict crystallization propensity with high accuracy. CLPred can also be improved significantly if it incorporates additional features from pre-extracted evolutional, structural and physicochemical characteristics. The correctness of CLPred predictions is further validated by the case studies of Sox transcription factor family member proteins and Zika virus non-structural proteins.
1 Introduction
Protein crystallography is increasingly favored by the majority of researchers because protein structure analysis is the basis of protein functional research (Bethel and Lieberman, 2014), disease treatment (Xue et al., 2013) and drug design (Chen and Yu, 2013; Cordeiro and Speck-Planche, 2012). At present, about 80–90% of the known protein three-dimensional structures are obtained using X-ray diffraction (XRD) analysis technology. XRD determines the three-dimensional coordinates of heavy atoms in protein molecules within certain resolution by measuring the spatial distribution of electron density in protein crystals. To determine the 3D structures of proteins by XRD, forming protein crystals suitable for structural analysis is crucial. The experimental process of obtaining protein crystals consists of multiple costly and time-consuming steps, including selection, cloning, expression, purification and crystallization. Over 60% of the structure determination costs are consumed by unsuccessful attempts (Kurgan and Mizianty, 2009; Service, 2005). Only ∼2 to 10% of protein targets produce high-resolution protein structures (Slabinski et al., 2007a,b) and ∼4.6% of targets produce diffraction-quality crystals (Jahandideh et al., 2014). Crystallization is characterized by a significant rate of attrition and is among the most complex but poorly understood problems in structural biology (Kurgan and Mizianty, 2009), which provides motivation for further research of this field. Researchers consider the intrinsic factor that affects the success rate of protein crystallization is the crystallinity of the protein itself (Sánchez-Puig et al., 2012). If there is a prediction method that can predict the crystallinity of a protein with satisfactory accuracy, it will enable rapid in silico screening target proteins that are predicted to have lower crystallization propensity, and consequently, trial-and-error settings and costs of protein structure analysis will be significantly reduced. Several investigations suggested that the features derived from protein sequences could be used for predicting crystallization propensity (Canaves et al., 2004; Goh et al., 2004). Therefore, it is of a great need to develop highly accurate in silico methods to distinguish proteins that can lead to diffraction-quality crystals from those that cannot, based on their sequences and characteristics before crystallization experiments.
In recent years, a series of prediction models and statistical methods for protein crystallization propensity, which use sequence-derived or secondary structural properties, have been developed. CrystalP2 (Kurgan et al., 2009) breaks the limitation of its predecessor version CrystalP (Chen et al., 2007) to predict only short-chain proteins. It is a kernel-based method that considers a large number of input features including composition and collocation of amino acids (AAs), pI and hydrophobicity. PPCpred (Mizianty and Kurgan, 2011), based on a Support Vector Machine (SVM) model, is the first one by integrating sequence-derived features with structural features to predict protein production, purification, crystallization and production of diffraction-quality crystals as the four-stop states. Inspired by PPCpred, a two-layer SVM predictor PredPPCrys (Wang et al., 2014) is developed using a set of comprehensive and multifaceted sequence-derived features, which has better prediction performance than the single-layer SVM. XtalPred–RF (Jahandideh, et al., 2014) improves XtalPred (Slabinski et al., 2007a,b) using a simple statistical analysis of the physicochemical features of a protein and then applying a random forest model to select additional features, such as predicted surface ruggedness, hydrophobicity, side-chain entropy of surface residues and amino acid composition of the predicted protein surface. TargetCrys (Hu et al., 2016) is a two-layer SVM predictor that takes advantage of multi-view protein features. Crysf (Wang et al., 2018) exploits the UniProt-derived functional annotations to predict the crystallization propensity of proteins, but its performance is limited by the proteins available in UniProt. fDETECT (Meng et al., 2017) uses the logistic regression model to predict four-stop states with the advantages of less computational time and more accuracy. The majority of these tools perform a two-stage classification using a plethora of sequence-based features: (i) performing feature selection and engineering using additional tools; and (ii) feeding the selected features to the machine learning algorithms for classification. These computational methods and tools not only lead to performance improvement, but also promote the understanding of protein crystallization.
In recent years, deep learning makes significant contributions to the field of bioinformatics. Recent work (Elbasir et al., 2019a,b) shows that using deep learning to extract features often achieves better results compared to its closest machine learning competitors. The majority of these deep learning algorithms rely on features extracted from raw sequences. The study (Elbasir et al., 2019a,b) builds a convolutional neural network (CNN) (LeCun et al., 1998) to extract features such as frequency sets of amino acid k-mers and k-mers information. Studies in protein secondary structure show that the types of neighboring residues play a predominant role in the secondary structure conformation that a residue adopts. In particular, residues in contacting parallel or antiparallel β-sheets are connected by hydrogen bonds in alternative positions. The hydrogen bonds between residues at positions i and i + 3, i and i + 4 and i and i + 5 lead to the formation of 3–10 helices, α-helices and π-helices, respectively (Li et al., 2011). Certain k-mers form structural keywords that can effectively distinguish between major protein folds (Elhefnawy et al., 2019). CNN can often effectively capture such local motif patterns between interactions of k-mers, but have difficulty in learning high-order, long-range interactions of k-mers, which are essential to form stable spatial structures. Mining the long-range peptide-peptide interactions in proteins (i.e. non-local, remote interactions between k-mers) is critical to solve the riddle of protein crystallization propensity prediction.
In this study, we build a deep learning network to extract global interaction patterns, improving over the traditional window-based neural network. CNN is a feed-forward neural network, which can effectively capture non-linear spatial information in image classification and other computer vision problems (Szegedy et al., 2015). Moreover, it has also achieved promising results in many natural language processing (NLP) tasks. CNN is often used to capture local patterns, but have difficulty in learning long-range interactions information. In contrast, recurrent neural network (RNN) is usually effective in solving this problem. Long Short-Term Memory (LSTM) (Hochreiter and Schmidhuber, 1997) is a special RNN designed to address vanishing gradient problem, so that the network is able to learn over hundreds of time steps. LSTM has a designed memory sub-architecture called ‘memory cell’ to store non-decaying information, which is realized by volume-conserving mappings constructed through a linear unit with a weight one self-recurrent connection. It performs well in machine translation (Sutskever et al., 2014) and speech recognition (Graves and Jaitly, 2014) as well as the prediction of protein secondary structure based on protein sequence (Sønderby and Winther, 2014).
In this article, we propose CLPred, a deep learning framework protein crystallization prediction only based on sequence information. It first takes a raw protein sequence as input and converts the amino acids into word vector representation through a word embedding layer. Then the word vectors are passed to a CNN layer whose goal is to capture the high-frequency k-mers features. Finally, the k-mers features are supplied to an LSTM layer, which uses feed-forward neural networks for concatenation of predictions from the forward and backward networks in the bidirectional model to capture the long-range interactions information between k-mers amino acids and generate predictions. The key amino acids and tripeptides influencing protein crystallization are obtained by analyzing the feature vectors. CLPred can be improved significantly if it incorporates additional features. In addition, the correctness of our CLPred predictions is further validated by the case studies of Sox transcription factor family member proteins and Zika virus non-structural proteins.
2 Materials and methods
2.1 Data preparation
We use four datasets in this work, including a training set and three test sets. The training set and one of the test sets are obtained from DeepCrystal (Elbasir et al., 2019a,b). It was originally generated by Wang et al. (2014), including five categories: diffraction-quality crystal, protein cloning failure, protein material production failure, purification failure and crystallization failure. In Elbasir et al. (2019a,b), diffraction-quality crystal is treated as a positive class and the remaining four are combined as a single negative class. Then it exploits the CD-HIT (Fu et al., 2012) method to remove sequences from the training set which have over 25% sequence identity with the test set. For sequences with length less than 800, zero padding is applied to make all input sequences have equal lengths of 800. Finally, the dataset is randomly divided into two disjoint parts: a training set with 26 821 sequences (4420 crystallizable and 22 401 non-crystallizable) and a test set with 1787 sequences (891 crystallizable and 896 non-crystallizable). We also remove sequences from the training set with over 25% sequence identity to Sox9, Sox17 and Zika proteins for our case studies. We name the test set ‘DC_final’ since it is obtained from DeepCrystal.
In addition, we adopt two other independent test sets named ‘SP_final’ and ‘TR_final’ from BCrystal (Elbasir et al., 2020) for further verification. These two test sets are first extracted from ‘SP_test_nr’ and ‘TR_test_nr’ (Wang et al., 2018), which have 604 and 2521 protein sequences, respectively. Since ‘SP_test_nr’ and ‘TR_test_nr’ are derived from TargetTrack (Kouranov, 2006), they may overlap with the training set. Elbasir et al. (2020) use CD-HIT method to remove sequences from ‘SP_test_nr’ and ‘TR_test_nr’ with over 25% sequence identity to the training set. Sequences with length over 800 are also removed. The post-processed ‘SP_test_nr’ and ‘TR_test_nr’ datasets are named ‘SP_final’ and ‘TR_final’, respectively. Moreover, we remove the N-terminal hexaHis tag (MGHHHHHHSH) and the C-terminal LEHHHHHH tag presented in some sequences. These tags are not part of the original protein sequences, but are added artificially to ease purification (Gräslund et al., 2008). Detailed statistics information of the above four datasets is listed in Table 1.
Statistics for training and testing sets
| Dataset | No. of crystallizable | No. of uncrystallizable | Total |
|---|---|---|---|
| Training set (Elbasir et al., 2019a,b) | 4420 | 22 401 | 26 821 |
| DC_final (Elbasir et al., 2019a,b) | 891 | 896 | 1787 |
| SP_final (Elbasir et al., 2020) | 148 | 89 | 237 |
| TR_final (Elbasir et al., 2020) | 374 | 638 | 1012 |
2.2 Model architecture
The protein crystallization prediction is a binary classification problem. For an input protein sequence, the corresponding crystallization score in range [0, 1] is predicted. As shown in Figure 1, CLPred obtains the raw sequence from input, transforms k-mers amino acids into word vector representation through the embedding layer, then respectively extracts high-frequency k-mers features and long-range interaction features through CNN and BLSTM layers, and thus completes end-to-end protein diffraction-quality crystals prediction. Our model architecture including features embedding and various layers are described next.
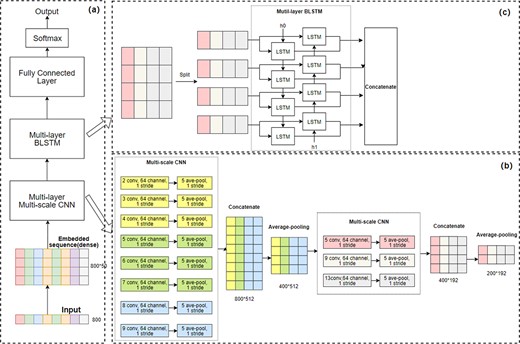
The architecture of CLPred. (a) The overall workflow of CLPred. (b) The architecture of the CNN module. (c) BLSTM module. The discrete raw sequence is transformed into a dense, continuous vector through feature embedding and then fed into the CNN layer with multi-scale convolution kernels to capture local amino acid k-mers features. The extracted characteristic map of the CNN layer is passed to BLSTM concatenating the forward and backward information to capture the long-range interaction characteristics between k-mers. Finally, all the BLSTM outputs are passed to the fully connected layers to produce protein crystal prediction scores
The embedding layer in CLPred transforms the discrete amino acid sequence encoding into a dense, continuous vector representation. Compared to the one-hot representation, which is sparse, the embedding layer has the advantage of dimension reduction while preserving the important physicochemical properties of amino acids in a protein sequence (Vang and Xie, 2017). In the embedding layer, the input of a protein sequence is encoded as , where 1–20 represent the types of amino acids in alphabet order, gaps are filled with 0 s, ambiguous or unknown amino acids are denoted as 21, and is the fixed length. The embedding algorithm learns a feature matrix, which is denoted by , where is the number of input types and 50 is the embedding dimension. The matrix represents the dense representation of each amino acid. is initialized randomly and trained along with the whole network. By looking up , the embedding layer outputs a feature map .
A multi-layer Bidirectional LSTM (BLSTM) module is designed following the CNN and pooling layers, as shown in Figure 1(c). CLPred has three BLSTM layers. Each direction in the BLSTM consists of 200 time step nodes while each time step is composed of 128 hidden units. Fully connected neurons in the network are activated by ReLU. We adopt 0.5 dropout rates to prevent overfitting and co-adaptation (Hinton et al., 2012). The BLSTM layer concatenates the forward LSTM unit and backward LSTM unit to obtain the characteristic representation of the long-range interaction information between the amino acids k-mers.
2.3 Model training
We use 10-fold cross-validation to train 10 models, respectively. The protein sequences are randomly divided into 10 disjoint parts. Alternatively, nine parts serve the purpose of training and the rest is used for validation. The final results are reported by taking advantage of the 10 models. The Adam (Adaptive moment estimation) optimizer (Kingma and Ba, 2014) is adopted for model training. Validation sets are used to allow early stop during training to prevent the network from overfitting. It is important to note that there are approximately five times more uncrystallizable proteins than the crystallizable proteins in our training set, which leads to an imbalance training problem. To address this issue, in the training of each fold, we randomly down sample all negative sequences to the number approximately the same as the positive ones. The negative sequence down sampling step is repeated in each epoch.
CLPred is implemented using Google's open source TensorFlow library (Abadi et al., 2016). To speed up the training, we use the GPU version of TensorFlow to train on the Nvidia Titan X GPU.
2.4 Evaluation strategies
3 Results and discussions
3.1 Performance of the CLPred on three benchmark datasets
We evaluate the predictive performances of five sequence-based protein crystallization predictors, including DETECT, TargetCrys, PPCPred, CrystalP2 and DeepCrystal. The prediction results on DC_final, SP_final and TR_final are shown in Tables 2–4, respectively. One can find that CLPred outperforms the predictors when performance is measured by Accuracy, AUC, Recall, F-score, NPV and MCC. When measured by prediction precision, CLPred is slightly inferior to DeepCrystal, fDETECT and DeepCrystal/fDETECT in DC_final, SP_final and TR_final, respectively. However, the gains of CLPred measured by the other metrics are more significant. ROC curves for the five predictors of the three different test sets are shown in Figure 2.

ROC curves for the five predictors of the three different test sets. (a) ROC curve for DC_final, (b) ROC curve for SP_final dataset and (c) ROC curve for TR_final dataset. The AUC values of the five predictors are shown in the figure legend
Performance comparison of the available predictors evaluated on the DC_final dataset
| Method | Accuracy | AUC | Precision | Recall | F-score | NPV | MCC |
|---|---|---|---|---|---|---|---|
| fDETECT | 0.650 | 0.782 | 0.841 | 0.367 | 0.597 | 0.597 | 0.360 |
| TargetCrys | 0.628 | 0.638 | 0.620 | 0.653 | 0.636 | 0.636 | 0.256 |
| PPCPred | 0.672 | 0.754 | 0.740 | 0.528 | 0.616 | 0.635 | 0.359 |
| CrystalP2 | 0.586 | 0.607 | 0.570 | 0.696 | 0.627 | 0.612 | 0.178 |
| DeepCrystal | 0.799 | 0.915 | 0.885 | 0.685 | 0.772 | 0.744 | 0.613 |
| CLPred | 0.851 | 0.928 | 0.849 | 0.852 | 0.850 | 0.852 | 0.700 |
Note: Bold represents best results.
Performance comparison of the available predictors evaluated on the SP_final dataset
| Method | Accuracy | AUC | Precision | Recall | F-score | NPV | MCC |
|---|---|---|---|---|---|---|---|
| fDETECT | 0.616 | 0.837 | 0.913 | 0.426 | 0.581 | 0.494 | 0.382 |
| TargetCrys | 0.608 | 0.642 | 0.727 | 0.595 | 0.654 | 0.483 | 0.217 |
| PPCPred | 0.666 | 0.784 | 0.863 | 0.554 | 0.675 | 0.535 | 0.403 |
| CrystalP2 | 0.654 | 0.697 | 0.711 | 0.750 | 0.730 | 0.543 | 0.249 |
| DeepCrystal | 0.683 | 0.866 | 0.910 | 0.547 | 0.684 | 0.547 | 0.457 |
| CLPred | 0.801 | 0.887 | 0.885 | 0.783 | 0.832 | 0.698 | 0.599 |
Note: Bold represents the best result.
Performance comparison of the available predictors evaluated on the TR_final dataset
| Method | Accuracy | AUC | Precision | Recall | F-score | NPV | MCC |
|---|---|---|---|---|---|---|---|
| fDETECT | 0.750 | 0.848 | 0.823 | 0.411 | 0.548 | 0.733 | 0.447 |
| TargetCrys | 0.634 | 0.693 | 0.503 | 0.788 | 0.614 | 0.814 | 0.325 |
| PPCPred | 0.748 | 0.819 | 0.677 | 0.606 | 0.640 | 0.782 | 0.448 |
| CrystalP2 | 0.581 | 0.673 | 0.460 | 0.775 | 0.577 | 0.780 | 0.241 |
| DeepCrystal | 0.803 | 0.914 | 0.838 | 0.580 | 0.686 | 0.792 | 0.569 |
| CLPred | 0.854 | 0.930 | 0.787 | 0.829 | 0.807 | 0.896 | 0.690 |
Note: Bold represents the best result.
3.2 Model analysis
The advantage of using deep learning for protein crystallization is that the neural networks can have multiple layers, each of which learns to detect and select hierarchical features of a sequence. This starts from simple features, such as local k-mers conformations and properties, and gradually increases in complexity to features, such as long-range, high-order k-mers interactions, that uniquely characterize a protein. Here, we project the feature vectors derived from each layer in the CLPred model to a two-dimensional feature space via t-SNE (Maaten and Hinton, 2008), principle component analysis (PCA) and UMAP (McInnes et al., 2018), and visualize the overall process of protein crystallization classification in Figure 3. We extract five features vectors from the embedding layer, the pooling layer after the first CNN layer, the pooling layer after the second CNN layer, the BLSTM layer and the fully connected layer. As shown in Figure 3(a–e), one can observe that, as the layers deepen in CLPred, the feature vectors learned become gradually more effective in distinguishing crystallizable proteins from the non-crystallizable ones. In particular, the features from the embedding layer mainly characterize the local features of k-mers, which do not contribute much in separating the two classes. However, as the CNN, pooling and BLSTM layers derive and select more complex features representing high-order, global k-mers interactions, the crystallizable proteins and non-crystallizable proteins become more separable.
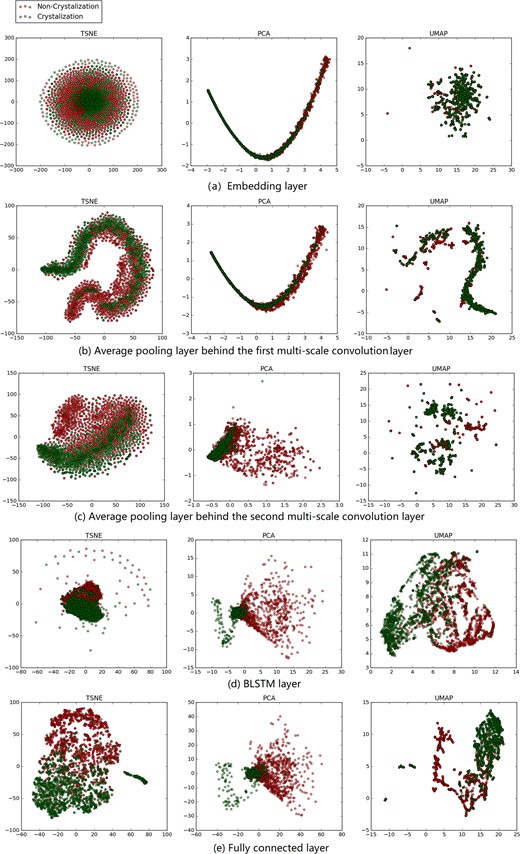
The feature vectors of the three test sets in the five hidden layers are visualized after dimensionality reduction by t-SNE, PCA and UMAP. The red circle represents the non-crystallizable sequence and the blue circle represents the crystallizable ones. (a) Feature vectors in the embedding layer. (b) Feature vectors of the first average pooling layer. (c) Feature vectors of the second pooling layer. (d) Feature vectors of the BLSTM layer. (e) Feature vectors from the final fully connected layer
In Table 5, we compare different CLPred architectures with different hyperparameters and layers. Our current architecture with two convolution layers, one BLSTM layer and one fully connected layer yields the optimal prediction capability. Adding additional convolution layers or fully connected layers not only increases the computational cost, but also downgrades the prediction performance.
Performance comparison of different CLPred architectures on the DC_final dataset for 10-fold cross-validation
| Method | Accuracy |
|---|---|
| E | 0.752 |
| E+MSCNN_8 | 0.799 |
| E+MSCNN_8+MSCNN_3 | 0.821 |
| E+MSCNN_8+MSCNN_3+BLSTM | 0.845 |
| E+MSCNN_8+MSCNN_3+BLSTM+FC_256 | 0.850 |
| E+MSCNN_8+MSCNN_3+BLSTM+CNN_3+ CNN_3+CNN_3 | 0.847 |
| E+MSCNN_8+MSCNN_3+BLSTM+CNN_3+ CNN_3+CNN_3+FC_256 | 0.849 |
| E+MSCNN_8+MSCNN_3+BLSTM+CNN_3+ CNN_3+CNN_3+FC_1024+FC_256 | 0.848 |
E, embedding layer; MSCNN_8, multi-scale convolution layer; the convolution kernel size of each scale is {2, 3, 4, 5, 6, 7, 8, 9}; MSCNN_3, multi-scale convolution layer, the convolution kernel size of each scale is {5, 9, 13}; BLSTM, three-layer bidirectional long short-term memory neural network; CNN_3, convolution layer, whose convolution kernel size is 3, followed by average pooling with a sliding window of length 5 and step length 1; FC_1024, fully connected layer with 1024 neurons; FC_256, fully connected layer with 256 neurons.
3.3 Key amino acids and tripeptides related to protein crystallization
We take the 800×64 feature map generated by the first multi-scale convolution, average the data of the second dimension and normalize them to [0, 1]. Then, each sequence is represented by a vector of length 800 and each value in this vector is the activation value corresponding to the amino acid in the sequence. The larger the activation values of amino acid, the greater its contribution to the classification results. According to the activation values, we summarize the total numbers of amino acids in Table 6. The top seven amino acids that mostly contribute to protein crystallization are R(Arg), I(Ile), Q(Gln), G(Gly), V(Vla), S(Ser) and C(Cys). This is generally consistent with the results presented in Charoenkwan et al. (2013) while our results indicate that R(Arg) and I(Ile) are also important to protein crystallization.
The numbers of amino acids corresponding to the top five and ten activation values across all samples
| Amino acid | Top 5 (rank) | Top 10 (rank) | Amino acid | Top 5 (rank) | Top 10 (rank) |
|---|---|---|---|---|---|
| R-Arg | 84 316 (1) | 153 966 (1) | T-Thr | 11 844 (11) | 26 653 (11) |
| I-Ile | 83 155 (2) | 151 492 (2) | L-Leu | 9204 (14) | 22 481 (12) |
| Q-Gln | 41 350 (3) | 77 743 (3) | M-Met | 10 465 (12) | 22 344 (13) |
| G-Gly | 22 039 (6) | 49 354 (4) | N-Asn | 9198 (15) | 20 732 (14) |
| S-Ser | 22 097 (5) | 46 728 (5) | E-Glu | 7807 (17) | 19 164 (15) |
| V-Val | 19 970 (7) | 44 854 (6) | H-His | 8736 (16) | 19 037 (16) |
| C-Cys | 22 760 (4) | 40 599 (7) | W-Trp | 9279 (13) | 18 640 (17) |
| Y-Tyr | 18 295 (8) | 36 675 (8) | K-Lys | 6057 (18) | 14 612 (18) |
| F-Phe | 15 533 (9) | 32 412 (9) | D-Asp | 3972 (19) | 9989 (19) |
| P-Pro | 12 957 (10) | 29 158 (10) | A-Ala | 1152 (20) | 3487 (20) |
In addition to the contribution of an individual amino acid, the feature vector extracted from the CNN layer with a kernel size of 3 allows us to gain insight in more specific contributions of tripeptides. By applying similar counting as single amino acids, the top-ranked triplets are derived and shown in Table 7. It is interesting to note that most of these tripeptides include R(Arg) and/or I(Ile). This indicates that the tripeptides heavily involved R(Arg) and/or I(Ile) play an important role in protein crystallization process. Their mechanism deserves further computational and experimental studies.
The numbers of tripeptides corresponding to the top five and ten activation values across all samples
| Tripeptides | Top 10 | Tripeptides | Top 5 |
|---|---|---|---|
| RRR | 1812 | III | 1399 |
| III | 1733 | RRR | 1383 |
| IIS | 1279 | IIS | 848 |
| RII | 1141 | RII | 833 |
| RRI | 1055 | RRI | 695 |
| IIG | 978 | QRR | 627 |
| RVR | 943 | RIR | 620 |
| LII | 938 | RVR | 613 |
| RIR | 926 | RQR | 609 |
| IIF | 887 | IIR | 582 |
| IFI | 868 | IFI | 573 |
| RQR | 848 | IIF | 571 |
| IIV | 841 | RRQ | 570 |
| QRR | 828 | QII | 556 |
| SII | 825 | IIG | 536 |
| IIR | 823 | LII | 518 |
| RRV | 811 | IRR | 503 |
| FII | 792 | RRV | 489 |
| QII | 791 | RSR | 487 |
| IRR | 790 | SII | 481 |
3.4 Effectiveness of BLSTM
The BLSTM layer is a crucial component in CLPred for capturing the high-order, long-range k-mers interactions. In order to demonstrate the effectiveness of BLSTM, we compare the prediction performance of CLPred with a CLPred version by replacing the BLSTM layer with a CNN layer. We name this CLPred_noBLSTM. Notice that CLPred_noBLSTM has a similar architecture as DeepCrystal. The 10-fold cross-validation results of CLPred, CLPred_noBLSTM and DeepCrystal on DC_final, SP_final and TR_final are shown in Table 8, respectively. One can find that CLPred_noBLSTM and DeepCrystal differ only 0.1–2% for most of the metrics, but CLPred with BLSTM is significantly higher in comparison. This confirms that the feature representation learned by BLSTM plays an important role in effectively predicting which sequences can produce diffraction-quality crystals.
Verify the effectiveness of the BLSTM on three benchmark datasets
| Model | ACC | AUC | PRE | REC | F-score | NPV | MCC |
|---|---|---|---|---|---|---|---|
| DC_final | |||||||
| DeepCrystal | 0.799 | 0.915 | 0.885 | 0.685 | 0.772 | 0.744 | 0.613 |
| CLPred_noBLSTM | 0.815 | 0.911 | 0.862 | 0.750 | 0.802 | 0.780 | 0.636 |
| CLPred | 0.851 | 0.928 | 0.849 | 0.852 | 0.85 | 0.852 | 0.700 |
| SP_final | |||||||
| DeepCrystal | 0.683 | 0.866 | 0.910 | 0.547 | 0.684 | 0.547 | 0.457 |
| CLPred_noBLSTM | 0.722 | 0.879 | 0.890 | 0.628 | 0.738 | 0.586 | 0.493 |
| CLPred | 0.801 | 0.887 | 0.885 | 0.783 | 0.832 | 0.698 | 0.599 |
| TR_final | |||||||
| DeepCrystal | 0.803 | 0.914 | 0.838 | 0.580 | 0.686 | 0.792 | 0.569 |
| CLPred_noBLSTM | 0.816 | 0.907 | 0.796 | 0.676 | 0.731 | 0.826 | 0.597 |
| CLPred | 0.854 | 0.930 | 0.787 | 0.829 | 0.807 | 0.896 | 0.690 |
Bold represents best results.
3.5 Additional features other than sequence
Crystallization prediction can be further improved when additional features, such as evolutionary information and predicted protein properties such as secondary structure, flexibility, structural motif, solvent accessibility and disulfide bond, are incorporated. Recently, BCrystal (Elbasir et al., 2020) uses pre-extracted evolutional, structural and physicochemical characteristics as additional features and uses XGBoost (Chen and Guestrin, 2016) to predict protein crystallization propensity, which has shown significant performance enhancement. These features can also be used in the CLPred framework. Table 9 shows the performance comparison between CLPred, BCrystal and CLPred_AF, which combines the last layer features of CLPred with 641 additional features, including 8-state secondary structure (SS), fraction of exposed residues (FER), disorder and hydrophobicity. These features are obtained from Elbasir et al. (2020). One can find that, when these additional features are incorporated, the performance of CLPred_AF is also significantly improved compared to CLPred and is at least comparable to BCrystal. Nevertheless, CLPred, as predictor using sequence-only features, is still of practical use, since it does not rely on the accuracy of other feature prediction tools and is not biased to the databases of deriving additional features.
Performance comparison between CLPred, BCrystal and CLPred_AF, which combines the last layer features of CLPred with 641 additional features
| Method | ACC | AUC | PRE | REC | F-score | NPV | MCC |
|---|---|---|---|---|---|---|---|
| DC_final | |||||||
| CLPred | 0.851 | 0.928 | 0.849 | 0.852 | 0.850 | 0.852 | 0.700 |
| BCrystal | 0.954 | 0.979 | 0.938 | 0.973 | 0.955 | 0.972 | 0.910 |
| CLPred_AF | 0.957 | 0.987 | 0.945 | 0.970 | 0.957 | 0.969 | 0.914 |
| TR_final | |||||||
| CLPred | 0.854 | 0.930 | 0.787 | 0.829 | 0.807 | 0.896 | 0.690 |
| BCrystal | 0.964 | 0.987 | 0.931 | 0.976 | 0.953 | 0.985 | 0.925 |
| CLPred_AF | 0.968 | 0.993 | 0.945 | 0.971 | 0.958 | 0.982 | 0.933 |
| SP_final | |||||||
| CLPred | 0.801 | 0.887 | 0.885 | 0.783 | 0.832 | 0.698 | 0.599 |
| BCrystal | 0.903 | 0.948 | 0.888 | 0.966 | 0.926 | 0.934 | 0.793 |
| CLPred_AF | 0.911 | 0.971 | 0.904 | 0.960 | 0.931 | 0.925 | 0.810 |
3.6 Analyzing the impact of sequence identity cutoff
In data preprocessing, most studies remove sequences with over 25% sequence identity in the training set (Elbasir et al., 2019a,b; Wang et al., 2014, 2018). While 25% cutoff may still lead to homologues with recognizable alignments, we hereby compare the performance of CLPred models trained with lower sequence identity cutoffs. As shown in Table 10, the prediction results on the test sets for datasets under 15, 20 and 25% sequence identity cutoffs are rather consistent, although lowering sequence identity cutoffs results in training sets with reduced sizes. This indicates that 25% is a reasonable sequence identity cutoff to benchmark CLPred and compare it with other crystallization prediction methods.
Compare the performance of CLPred models in test sets with different cutoff sequence identity
| Cutoff | ACC | AUC | PRE | REC | F-score | NPV | MCC |
|---|---|---|---|---|---|---|---|
| DC_final | |||||||
| 25% | 0.851 | 0.928 | 0.849 | 0.852 | 0.850 | 0.852 | 0.700 |
| 20% | 0.850 | 0.927 | 0.864 | 0.829 | 0.847 | 0.837 | 0.700 |
| 15% | 0.843 | 0.926 | 0.863 | 0.814 | 0.837 | 0.825 | 0.687 |
| SP_final | |||||||
| 25% | 0.801 | 0.887 | 0.885 | 0.783 | 0.832 | 0.698 | 0.599 |
| 20% | 0.793 | 0.888 | 0.909 | 0.743 | 0.817 | 0.672 | 0.600 |
| 15% | 0.785 | 0.890 | 0.900 | 0.736 | 0.810 | 0.664 | 0.582 |
| TR_final | |||||||
| 25% | 0.854 | 0.930 | 0.787 | 0.829 | 0.807 | 0.896 | 0.690 |
| 20% | 0.852 | 0.924 | 0.808 | 0.787 | 0.797 | 0.877 | 0.680 |
| 15% | 0.852 | 0.927 | 0.815 | 0.778 | 0.796 | 0.873 | 0.681 |
4 Cases analysis
4.1 Sox transcription factors analysis
Sox proteins are sequence-specific transcription factors that regulate several key developmental processes. It contains a highly conserved high-mobility group (HMG) domain of ∼80 amino acids, known for binding and bending the DNA (Vivekanandan et al., 2015). Sox17 and Sox9 are members of the Sox transcription factor family. Sox17 is involved in endodermal differentiation during early mammalian development. Sox9 is a fundamental sex-determining gene involved in the development of various vital organs, such as testicles, kidneys, heart and brain, and skeletal development. We use CLPred to predict several Sox proteins such as the full-length Sox17, full-length Sox9, Sox17 HMG domain, Sox9 HMG domain and Sox17 mutant (EK) HMG domain collected by Elbasir et al. (2019a,b) and compare with the other sequence-based protein crystal predictors. The results are listed in Table 11. Recent studies have shown that Sox9 HMG, Sox17 HMG and Sox17EK HMG can produce diffraction-quality crystals (Elbasir et al., 2019a,b; Palasingam et al., 2009; Vivekanandan et al., 2015). In addition, there is no evidence to show that full-length sequences of Sox9 and Sox17 can produce diffraction-quality crystals. The results in Table 11 show that CLPred and DeepCrystal are the only two methods that can correctly identify Sox9 HMG, Sox17 HMG and Sox17EK HMG as the ones that can produce diffraction-quality crystals. It is worthy to note that the score of CLPred is much higher than the other predictors. For those having no evidence of producing diffraction-quality crystals, all sequence-based protein crystallization tools, including CLPred, make the same predictions which are uncrystallizable. This indicates that both full-length sequences of Sox9 and Sox17 are unlikely to produce diffraction-quality crystals in industrial production.
Prediction scores of the CLPred and other predictors for some Sox transcription factor family protein
| Sox9 Full Length | Sox9 HMG | Sox17 Full length | Sox17 HMG | Sox17 EK HMG | |
|---|---|---|---|---|---|
| CLPred | 0.155 | 0.886 | 0.235 | 0.858 | 0.872 |
| DeepCrystal | 0.315 | 0.676 | 0.430 | 0.643 | 0.633 |
| fDETECT | 0.070 | 0.432 | 0.075 | 0.462 | 0.418 |
| TargetCrys | 0.032 | 0.045 | 0.037 | 0.029 | 0.031 |
| PPCPred | 0.039 | 0.658 | 0.089 | 0.462 | 0.523 |
| CrystalP2 | 0.327 | 0.459 | 0.470 | 0.436 | 0.402 |
4.2 Zika virus proteins analysis
Zika virus is a plus single-stranded RNA virus, a member of the flavivirus genus of the Flaviviridae, and its genome encodes three structural proteins (nucleocapsid protein C, membrane protein M and envelope protein E) and seven non-structural proteins (NS1, NS2A, NS2B, NS3, NS4A, NS4B and NS5). We have collected some crystallizable Zika protein sequences, including full-length NS1 (Brown et al., 2016), C-terminal fragment of NS1 (Song et al., 2016), unlinked NS2B-NS3 protease in complex with a compound fragment (Zhang et al., 2016), NS2B-NS3 protease in complex with a boronate inhibitor (Lei et al., 2016), and NS5 methyltransferase in complex with GTP and SAH (Zhang et al., 2017). We have also tested some other non-structural proteins, where no evidence shows that they can produce diffraction-quality crystals so far, like the full-length protein sequences of NS2A, NS2B, NS4A and NS4B. Determining the structures of these important non-structural proteins will lay a significant foundation to understand and overcome the Zika virus.
We use CLPred to predict these proteins and compare them with the sequence-based protein crystal predictors. The results are provided in Table 12. As shown in Table 12, CLPred is the only model that 100% correctly identifies the non-structural Zika virus proteins which can produce diffraction-quality crystals. For non-structural full-length proteins NS2A, NS2B and NS4A with uncertain labels, crystallization propensity predicted by CLPred is consistent with the predictions generated by most of the other predictors. For full-length NS4B, the predicted score of CLPred is 0.028, which is also consistent with other predictors. In addition, we observe that full-length NS2B is predicted with relatively high confidence by CLPred and four other tools, which deserves further investigation by the Zika virus research community.
Prediction scores of the CLPred and other predictors for some Zika virus non-structural proteins
| Protein | CLPred | DeepCrystal | fDETECT | TargetCrys | PPCPred | CrystalP2 |
|---|---|---|---|---|---|---|
| NS1 FL | 0.997 | 0.472 | 0.157 | 0.084 | 0.233 | 0.57 |
| NS1① | 0.717 | 0.667 | 0.224 | 0.030 | 0.257 | 0.534 |
| NS2B-NS3② | 0.686 | 0.680 | 0.456 | 0.137 | 0.320 | 0.645 |
| NS2B-NS3③ | 0.827 | 0.808 | 0.925 | 0.563 | 0.961 | 0.581 |
| NS5④ | 0.865 | 0.494 | 0.274 | 0.030 | 0.215 | 0.375 |
| NS2A FL | 0.001 | 0.140 | 0.629 | 0.075 | 0.307 | 0.454 |
| NS2B FL | 0.636 | 0.626 | 0.594 | 0.145 | 0.585 | 0.577 |
| NS4A FL | 0.338 | 0.425 | 0.536 | 0.123 | 0.364 | 0.701 |
| NS4B FL | 0.028 | 0.066 | 0.015 | 0.097 | 0.302 | 0.468 |
NS1①, C-terminal fragment of NS1; NS2B-NS3②, NS2B-NS3 protease in complex with a boronate inhibitor; S2B-NS3③, Unlinked NS2B-NS3 protease from Zika virus in complex with a compound fragment; NS5④, NS5 methyltransferase in complex with GTP and SAH; FL, Full Length.
5 Conclusions and future work
To avoid time-consuming and expensive experimentations with proteins that are not likely to result in resolvable crystallized structures, the selection of targets for structure determination is one of the greatest challenges in structural genomics experiments (Varga et al., 2017). In this study, we propose CLPred, a sequence-based deep learning framework. Using only information from sequence, CLPred uses a BLSTM in its deep learning architecture to capture the high-order, long-range interaction patterns between k-mers, which makes up the deficiency of the previous work using CNN. It has been steadily improved over the previous window-based neural networks and is able to predict the crystallization propensity with higher accuracy. This performance enhancement is due to the ability of BLSTM to recognize non-local interactions, as using the local interaction features has already reached its limit in traditional neural networks. Cross-validation and independent tests on three benchmark datasets and ablation study have confirmed the efficacy of BLSTM in protein crystallization prediction where non-local interactions are crucial. By analyzing the feature vectors derived from various layers in CLPred architecture, we have found the key amino acids and tripeptides mostly contributing to protein crystallization. By combining the last layer features of CLPred with 641 additional features, we obtain the improving performance, which is at least comparable to that of BCrystal. Finally, the correctness of our CLPred predictions is further validated by the case studies of Sox transcription factor family member proteins and Zika virus non-structural proteins. Our future work will be analyzing and interpreting the patterns learned in CLPred via deep learning and understanding the fundamentals governing protein crystallization.
CLPred is freely available and downloadable at GitHub: https://github.com/xuanwenjing/CLPred.
Funding
This work was supported in part by the NSFC-Zhejiang Joint Fund for the Integration of Industrialization and Informatization under grant [U1909208], National Natural Science Foundation of China under grant [61832019], 111 Project [B18059] and Hunan Provincial Science and Technology Program [2018WK4001].
Conflict of Interest: none declared.

