


Abstract
Peptidic natural products (PNPs) are considered a promising compound class that has many applications in medicine. Recently developed mass spectrometry-based pipelines are transforming PNP discovery into a high-throughput technology. However, the current computational methods for PNP identification via database search of mass spectra are still in their infancy and could be substantially improved.
Here we present NPS, a statistical learning-based approach for scoring PNP–spectrum matches. We incorporated NPS into two leading PNP discovery tools and benchmarked them on millions of natural product mass spectra. The results demonstrate more than 45% increase in the number of identified spectra and 20% more found PNPs at a false discovery rate of 1%.
NPS is available as a command line tool and as a web application at http://cab.spbu.ru/software/NPS.
Supplementary data are available at Bioinformatics online.
1 Introduction
Antimicrobial resistance is a global concern as admitted by WHO in its recent review (World Health Organization, 2014). Coordinated action from governments, physicians and scientists is required to minimize the emergence and spread of antimicrobial resistance. An important component of such complex solution is the boost in the discovery of new antibiotics and other drugs from natural sources. This kind of speed up is now possible with the latest breakthroughs in experimental and computational technologies, as exemplified by the discovery of teixobactin (Ling et al., 2015), the first class of antibiotics with a novel mode of action reported in three decades.
Modern mass spectrometry methods enable high-throughput screening of huge volumes of natural products that potentially lead to the discovery of many more bioactive compounds. However, the interpretation of these large amounts of data remains a bottleneck. For instance, recently launched Global Natural Products Social (GNPS) molecular network (Wang et al., 2016) contains more than a billion of natural product mass spectra but only a tiny fraction of them is annotated to date. Thus, mature computational methods are needed to turn antibiotic discovery into a high-throughput technology and to realize the promise of GNPS and other massive metabolomics projects (da Silva et al., 2015).
Natural product researchers tend to maximize the discovery of new compounds while minimizing the reevaluation of known ones. Identification of known molecules (so-called dereplication) performed early in a workflow significantly reduces time and cost required for the discovery of novel compounds (Gerwick and Moore, 2012). One of the state-of-the-art dereplication strategies is the search of tandem mass spectra (MS/MS) against databases of known chemical structures performed computationally. Given a spectrum and a peptide database, a dereplication algorithm should find a peptide in the database that generated the given spectrum or report that the database does not contain peptides with statistically significant similarity to this spectrum (Kertész-Farkas et al., 2012). This problem is nearly solved for regular peptides and many proteomics software for database search of MS/MS spectra are freely available nowadays (Craig and Beavis, 2004; Eng et al., 1994; Frank and Pevzner, 2005; Kim and Pevzner, 2014).
However, identification of spectra derived from natural products is usually much more difficult than traditional peptide identification in proteomics. This study focuses on algorithms for identification of peptidic natural products (PNPs), an important class of natural products with many pharmacological applications. PNPs consist of non-ribosomal peptides (NRPs) (Marahiel et al., 1997) and ribosomally synthesized and post-translationally modified peptides (RiPPs) (Arnison et al., 2013). Despite the fact that PNPs are much more similar to regular peptides than all other classes of natural products, they have several important structural differences preventing the use of conventional proteomics tools for PNP identification.
In contrast to regular peptides, PNPs are often short and have non-linear structures, such as cyclic or branch-cyclic compounds. Moreover, while regular peptides can be represented as strings over an alphabet of 20 letters (proteinogenic amino acids), PNPs contain non-standard amino acids and complex modifications making the number of different building blocks larger than a hundred. Finally, most PNPs form families of related peptides and only the most abundant representatives of the families are commonly present in the current PNP databases. Thus, PNP identification requires blind-search algorithms for finding of an unknown PNP from its known modified or mutated variants available in the database (so-called variable dereplication). Variable PNP identification is difficult because the set of possible modifications/mutations is not known in advance which makes the computational space of this problem several orders of magnitude larger than for standard PNP identification.
To date, there are just a few computational tools for dereplication of natural products and all of them have some important limitations.
NRP-Dereplication (Ng et al., 2009) and iSNAP (Ibrahim et al., 2014) algorithms are among the first in silico dereplication tools designed to work with cyclic peptides. NRP-Dereplication was initially developed with the ability to perform variable identification and iSNAP was extended with such functionality in later versions (Yang et al., 2015). However, both tools are focused on NRPs only and have critical shortcomings in their software implementations preventing their use in high-throughput analysis pipelines. NRP-Dereplication development was discontinued a while ago and there is no possibility to download the tool now. iSNAP software is available only as a web-service application for analyzing a single spectrum per run.
MS-FINDER (Lai et al., 2018; Tsugawa et al., 2016) and SIRIUS+CSI: FingerID (Böcker et al., 2009; Böcker and Dührkop, 2016; Dührkop et al., 2015) are popular programs for metabolomics mass spectra annotation. The both instruments try to predict chemical formulas based on spectra isotope patterns and further analyze the formula fragmentation to annotate MS/MS peaks. The formula deduction problem gets significantly more complex with the increase of molecular weight of putative compounds, so these methods work prohibitively slow for molecules larger than 500 Da (the majority of known PNPs). Technically, these tools can still be used for PNP dereplication since the number of allowed molecular formulas is limited by the chemical database and is relatively small. However, a specialized PNP search tool will produce much better results. Beyond that, MS-FINDER is currently available for Windows platform only which complicates its usage for analysis of large collections of MS/MS spectra typically stored and processed on Linux-based servers.
Dereplicator (Mohimani et al., 2017a) and its extension for variable identification, VarQuest (Gurevich et al., 2018), are the first tools that enabled high-throughput PNP identification via database search of mass spectra. They were incorporated into the GNPS platform and tested on more than one hundred million MS/MS spectra. The benchmarking revealed an order of magnitude more PNPs (and their new variants) than any previous dereplication effort on this data. Despite the success of these methods, their core module uses a pretty naïve function for computing similarity score between given experimental spectrum and PNP chemical structure. This issue is partially solved by using two-stage scoring (Kim et al., 2008) that involves estimation of the statistical significance of the primitive first-level scores (Mohimani et al., 2013). Nonetheless, strict thresholds on false discovery rate (FDR) induce these tools to filter out many true identifications which can be safely revealed with a more thoughtful scoring method.
In this work, we present NPS—a two-stage approach for scoring PNP-spectrum matches (NPScore) and estimating the statistical significance of such scores (NPSignificance). The method takes into account intensities of MS/MS peaks and occurrence of various additional ions during the fragmentation process in mass spectrometers. Both the set of considered ion types and the weights for scoring annotated and missed peaks of various intensity are computationally learned from real data.
To create an appropriately sized training dataset, we processed over one hundred million natural product mass spectra with Dereplicator and curated the most reliable PNP annotations. Until recently, such high-quality training dataset was nearly impossible to obtain in the case of PNPs, so NPS to our knowledge is the first high-throughput PNP identification method that uses statistically learned scoring model. The created dataset is freely available at our website and can be used by other researchers in their future studies.
We incorporated NPS into Dereplicator and VarQuest pipelines and benchmarked it against the current baseline algorithm. The test on millions of GNPS mass spectra showed a more than 20% increase in the number of identified PNPs comparing to the baseline at a conservative FDR level of 1%. As a sanity check, we also tested our method on a well-studied regular peptides dataset (Kim et al., 2014) and demonstrated that NPS accuracy is comparable with the accuracy of one of the leading proteomics tools, MS-GF+ (Kim and Pevzner, 2014).
2 Materials and Methods
2.1 Baseline scoring model
Similarly to other database search algorithms, Dereplicator compares each spectrum in the spectral dataset against each PNP in the chemical database. A PNP-spectrum match (PSM) is formed if the precursor mass of the spectrum matches the molecular mass of the PNP (up to a predefined maximum error, typically for high-resolution spectra). VarQuest can form a PSM even if the masses of a spectrum and a PNP do not match but in this case it considers the mass difference as a modification/mutation and applies it to the PNP structure (Gurevich et al., 2018).
In any case, the scoring of a PSM requires comparison of an experimental spectrum and a chemical structure. For doing this, the tools construct a theoretical spectrum of the compound which models its ionization and fragmentation in a mass spectrometer. The theoretical and experimental spectra are further examined and a measure of their similarity is reported as the PSM score.
2.1.1 Theoretical spectrum construction
The simplest fragmentation model assumes that a mass spectrometer cleaves peptide bonds in a charged molecule passing through the instrument and breaks the compound into two parts which mass-to-charge ratios are measured. For a linear peptide, this assumption results in the theoretical spectrum consisting of masses of all prefixes (b-ions) and all suffixes (y-ions) of the peptide sequence. For a non-linear peptide—which most of PNPs are—a single bond cleavage may not result in the molecule breakage. To model the fragmentation of a such compound, a PNP graph is constructed with amino acids as nodes and generalized peptide bonds as edges (Mohimani et al., 2017a). The PNP graph could be fragmented into subgraphs by removing of a single edge (bridge) or a pair of edges (2-cut). The theoretical spectrum is then a set of masses of all such subgraphs.
2.1.2 SPC scoring
Dereplicator and VarQuest measure similarity between a spectrum S and a PNP P simply as the shared peak count (SPC)—the number of peaks shared between S and the theoretical spectrum of P. Two peaks are shared if their masses are within a certain threshold ε ( for high-resolution spectra by default). Therefore, the SPC scoring does not take into account peak intensities but it is very easy to compute and this model does not require training of any parameters.
Early versions of Dereplicator also used more advanced MS-GF+ score (Kim and Pevzner, 2014) for evaluating linear PNPs consisting of proteinogenic amino acids (Mohimani et al., 2017a). However, such compounds represent a small fraction of the broad chemical diversity of PNPs. For the sake of simplicity and consistency, MS-GF+ scoring was removed from Dereplicator starting from v.2.0 (Gurevich et al., 2018) and SPC is used for all compounds as the baseline scoring method.
2.2 Proposed scoring model
2.2.1 Peak intensities
There are several common strategies for considering peak intensities in proteomics software. Some of them, such as PepNovo (Frank and Pevzner, 2005), deal with normalized intensity values while others, such as MS-GF+ (Kim and Pevzner, 2014), utilize the ranking approach. In this approach, all the peaks are ranked according to their intensities such that ith highest intensity peak gets rank i. In either case, intensity-aware scoring models normally have different weights for various intensity levels. To minimize the number of model parameters, normalized intensity values are usually discretized into a small number of bins and only a few first K ranks (the highest intensity peaks) are distinguished while the rest are considered to have the same rank (K + 1).
In this work, we try both the strategies to find an optimal approach to PNP data interpretation. In case of normalized intensity values, we discretize intensities into PepNovo-like bins [each peak’s intensity is divided by the grass level, four intensity levels are distinguished (Frank and Pevzner, 2005)] or simple logarithmic bins (10 levels). In case of the ranking approach, we distinguish the first 100 ranks for well-fragmented spectra of regular linear peptides and 50 ranks for experimental spectra derived from PNPs. We further refer to the described approaches as , and NPSranks, respectively. Since ranks can be considered as intensity bins, the experimental spectrum in either case may be represented as a set , where mzj characterizes mass-to-charge ratio of the jth peak (X-axis position) and bj characterizes its intensity bin (Y-axis position).
2.2.2 Ion types
We further refer to the set of masses obtained by the aforementioned theoretical spectrum construction procedure as TheorMasses. This set provides a good estimate of masses of basic ionized fragments passing through a mass spectrometer. However, TheorMasses does not describe many additional types of ions occurring during the fragmentation and present in the most experimental spectra. These types of ions include doubly and triply charged ions (which have different X-axis position in experimental spectra since mass spectrometers measure mass-to-charge ratios rather than the real fragment masses), neutral loss fragment ions, isotopic shifts, etc. To take this into account, we transform short TheorMasses into an expanded set of mass-to-charge ratios using the following procedure.
The set can be derived for a particular dataset using the offset frequency function (OFF) approach (Dančik et al., 1999). Given a set of reliable PSMs, OFF constructs an empirical distribution of the offsets characteristic for the spectral data. This is done by matching all the experimental peaks that are located at distance from the basic peaks of the related peptide/PNP, that is the peaks corresponding to the ion type (1, 0). The resulting counts are averaged over the dataset. The ion type is selected if the value of OFF at the corresponding offset is above a certain threshold. The selected sets for regular linear peptides and PNPs are in Supplementary Table S1.
2.2.3 NPScore
The first summand in (1) defines gains for the theoretical peaks that explain some experimental peaks and the second summand penalizes the rest peaks in the theoretical spectrum.
Note that computation of log odds ratios is a common approach employed in scoring models of many proteomics tools (Cannon et al., 2005; Dančik et al., 1999; Frank and Pevzner, 2005; Havilio et al., 2003; Kim et al., 2009; Kim and Pevzner, 2014; Tanner et al., 2005), so its use for PNP data analysis is a natural direction to proceed in.
2.2.4 Learning NPScore parameters
Given a set of ion types and a number of different intensity levels K, NPScore function relies on and parameters for defining the first and second summands in (1), respectively. We statistically learn them using training datasets of highly reliable PSMs. The probabilities in (1) are estimated as frequencies of the corresponding events in the dataset. For example, in case of the ranking approach, is computed as the number of PSMs in which the most intense experimental peak is explained by a theoretical peak of type (1, 0) divided by the total number of PSMs in the training set.
For the sake of regularization, a smoothing function was applied for learning the ranking approach parameters. For each ion type, the value at any rank was smoothed with moving average with the window length of 11 ranks. The parameters for the normalized intensity methods were not smoothed.
2.3 Proposed significance estimation procedure
Since PSM scores are often biased toward spectra with many peaks or PNPs with different molecule structures and sizes (Mohimani et al., 2017a), it is critically important to estimate the statistical significance of the scores (Gupta et al., 2011). Proteomics software normally estimate score P-values in the space of possible linear peptides of a given length k. At the same time, PNP identification tools have to deal with several orders of magnitude of larger space of potential compounds and require completely different algorithms.
To estimate P-value of a PSM score, Dereplicator uses MS-DPR (Mohimani et al., 2013), one of a few algorithms specialized in working with PNPs. Given a spectrum S and a peptide P forming the PSM, MS-DPR approximates a tail of the score distribution of S against a population of millions of compounds similar to P (having the same molecular weight and structure but different amino acid compositions). The approximation technique is based on constructing a Markov chain on a state space of all possible scores of peptides from the population. By design, the number of states has to be finite or in other words the scoring function has to be discrete. While this requirement is obviously satisfied for the SPC scoring, the state space resulting from NPScore model is, in practice, continuous, and requires a certain discretization.
Our P-value estimation procedure, NPSignificance, is based on MS-DPR and discretizes NPScore output in the following manner. First, we make an initial guess of what the state space look like with a naïve Monte Carlo approach. Then we take an interval of scores obtained from the previous step and divide it into N bins of equal size. We performed a series of experiments with various values of N and showed that our approach to the state space discretization produces rather stable results (see Supplementary Fig. S1). We take N = 10 as it provides a conservative estimation of P-value in all experiments.
2.4 Estimation of FDR
The target-decoy approach (Elias and Gygi, 2007) is the most popular strategy to estimate FDR in proteomics and metabolomics database search experiments. The method is based on generating a database of decoy peptides similar to the target peptide database and searching spectra against the both databases at once. FDR is then estimated as the number of identifications in the decoy database divided by the number of identifications in the target database at a given P-value or score threshold.
There are several approaches to generating decoy databases. For benchmarking on regular peptide datasets, we use a traditional proteomics approach, in which the decoy database is obtained from the reversed protein sequences. For the experiments on PNP datasets, we utilize the approach described in Gurevich et al. (2018), in which decoys are generated from target PNPs by shuffling of amino acids together with structure modification. PNP benchmarks using several alternative decoy generation strategies are available in the Supplementary Material.
3 Results
3.1 Benchmarking on proteomics data
To prove applicability of the model, we first benchmark it within the Dereplicator pipeline (referred to as ) on a spectral dataset of linear peptides and compare its performance with the baseline method (the SPC scoring, referred to as ) and the state-of-the-art proteomics tool, MS-GF+ (Kim and Pevzner, 2014). We run our model in the three different intensity-aware modes (ranks, PN-bins and log-bins) increasing the total number of compared approaches to five.
3.1.1 Spectral data
As a test dataset, we used a subset of the human proteome map project (Kim et al., 2014). The full dataset is freely accessible on GNPS under MassIVE accession number MSV000079514 and contains approximately 25 million high-resolution MS/MS spectra. These spectra were obtained on LTQ-Orbitrap Velos and LTQ-Orbitrap Elite mass spectrometers from proteins of 30 organ tissues. For our benchmarking, we randomly selected two adult tissues and collected all spectra related to them. We further refer to these spectral datasets as SpectraHeart (heart, 426 086 spectra; used for training) and SpectraKidney (kidney, 439 253 spectra; used for testing).
3.1.2 Peptide database
The target peptide database was obtained from the Human RefSeq proteins (Pruitt et al., 2005). The protein sequences were digested with the Trypsin/P method allowing no missed cleavages using the Pyteomics framework (Goloborodko et al., 2013). Carbamidomethylation of cysteine was set as a fixed modification. Only peptides with sequence length from 8 to 20 amino acids were kept. The decoy database was prepared from the reversed protein sequences in the same manner. The resulting combined database contains 47 284 target peptides and 47 239 decoy peptides.
3.1.3 NPS parameters training
To learn NPS parameters, we form a training dataset from MS-GF+ identifications on SpectraHeart against at FDR level 0%. We retained only PSMs with charge + 1 and + 2. For each peptide, we kept only the best PSM according to E-value reported by MS-GF+. The resulting dataset contains 17 794 PSMs, mostly of charge + 2 ().
Using , we derived the most frequent ion types (Supplementary Fig. S2a, Table S1) and trained a set of model parameters for them (Supplementary Fig. S3).
3.1.4 Number of identifications
We compared the number of identified PSMs and unique peptides from in SpectraKidney at various FDR levels (Fig. 1 and Supplementary Table S2). Beside the five competing methods, Figure 1 also shows four extra Dereplicator curves corresponding to the runs without the significance estimation, that is the runs in which PSMs were ranked based solely on the raw scores.
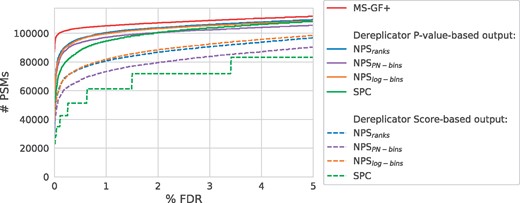
MS-GF+, and results on SpectraKidney. The curves display the number of identified PSMs at different FDR levels. The dashed curves correspond to Dereplicator runs without P-value estimation
The raw score-based results highlight the importance of the two-stage scoring. with the P-value computation identified approximately 50% more PSMs at FDR 1% than its raw score version (94 663 versus 61 250). While all three the raw score methods significantly improved over the SPC analog, they still performed worse than the default P-value-based .
The comparison of various NPS approaches to considering peak intensities demonstrates that the ranks and log-bins methods are superior to the PN-bins approach on the test dataset. However, the differences in their results are mostly insignificant when using the two-stage scoring procedure.
MS-GF+ obviously outperformed all other approaches at all FDR levels. However, the beating of one of the leading proteomics tools on its own ground is clearly out of scope of this paper. Note that impressive MS-GF+ results are partially based on some extra peptide-specific techniques, such as comparing distances between experimental peaks with the known exact masses of 20 proteinogenic amino acids (Kim and Pevzner, 2014). Since NPS is designed for much more chemically diverse PNP structures, it cannot rely on such assumptions. Moreover, despite the set of NPS estimated parameters is large, it is still an order of magnitude smaller than the number of MS-GF+ parameters. Thus, our approach will normally lose to MS-GF+ and other leading proteomics tools on any regular peptide dataset.
The more important observation is that all three approaches outperformed at the most important 0–1% FDR levels. Albeit the increase is mostly fractional with just 6% more PSMs and 4% more peptides at FDR 1% for the best, rank-based NPS method (100 444 versus 94 663 PSMs and 16 570 versus 15 968 peptides, Supplementary Table S2). The small improvement on this dataset may be due to relative simplicity of the peptide identification from high-quality data. Note that the numbers of identifications are also close to almost gold-standard MS-GF+ results at strict FDR 1% level (5% less PSMs and 3% less peptides for the rank-based NPS method, Supplementary Table S2). The main aim of the NPS approach is to improve identification of mediocre PSMs which are often present in PNP identification experiments (see the benchmarking below).
3.1.5 Validation of the results
We validated output by comparing its identifications to the results of and MS-GF+ at FDR 1%. Supplementary Figure S4 shows that all methods are in fairly good agreement. Over 96% of PSMs reported by rank-based were also reported by MS-GF+ which output may be roughly considered as the ground truth annotations.
3.2 Benchmarking on PNP data
3.2.1 Spectral data
We created the main natural product test dataset by combining 13 high-resolution GNPS spectral datasets (Supplementary Table S3). The resulting dataset consists of ∼16 million spectra and we further refer to it as SpectraGNPS. Three out of these 13 GNPS datasets were extensively studied before, so we used them separately for more rigorous validation of the results and for benchmarking NPS within the VarQuest pipeline which is considered as less robust than Dereplicator. These three datasets are: SpectraPSEUD [∼400 000 spectra from Pseudomonas isolates (Gurevich et al., 2018; Nguyen et al., 2016)], [∼200 000 spectra from Streptomyces (Gurevich et al., 2018; Mohimani et al., 2014a)], [∼500 000 spectra from Streptomyces (Duncan et al., 2015; Gurevich et al., 2018; Mohimani et al., 2017a)].
3.2.2 PNP database
As a target chemical database we used the PNP database from Gurevich et al. (2018) (further referred to as ). consists of 5021 compounds (1582 PNP families) from AntiMarin (Blunt et al., 2007), DNP (Gozalbes and Pineda-Lucena, 2011), MIBiG (Medema et al., 2015) and StreptomeDB (Lucas et al., 2013) databases. The decoy database of the same size was generated using Dereplicator API.
3.2.3 NPS parameters
To learn NPS parameters for PNP identification, we form a training dataset from identifications on virtually the entire GNPS. To obtain the initial set of annotations, Dereplicator v.2.0 was run with the default parameters on 120 high-resolution publicly available GNPS datasets (∼130 million spectra) against . The run resulted in 14 757 PSMs corresponding to 420 unique PNPs. To get the training set of a reasonable size and quality, we further considered all identifications of charge + 1 and + 2 at FDR level 5% and keep up to five best PSMs per compound. The resulting dataset contains 2 213 PSMs (Supplementary Fig. S5). Supplementary Figure S2b shows the offset frequency functions (OFFs) computed for , which results in the ion types presented in Supplementary Table S1.
Using the same dataset for both training NPS parameters and evaluating the tool performance raises concern about overfitting. To prove that this is not the case, we come up with the following procedure. From , we randomly formed subsets Train1, Train2 and Test so that they do not contain PSMs obtained from the same spectral datasets. Since some of the spectral datasets share the producing organisms, we also required that Train1 and Train2 do not contain PSMs related to the same PNP families (see Fig. 2). The resulting datasets Train1 and Train2 contain 346 and 493 PSMs, respectively. Using these datasets we trained two sets of parameters. We compared performance of these two models on spectra from Test dataset. The comparison shows difference of less than 5% at FDR level 1% (Supplementary Fig. S6).
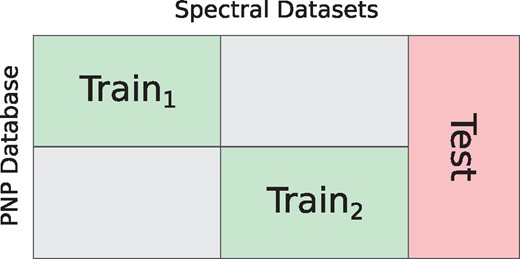
Split of into training and testing datasets
The final set of model parameters was trained on the full dataset. The resulting weights are shown in Supplementary Figure S7.
3.2.4 Standard identification
We matched SpectraGNPS against with (the three different intensity-aware models) and compared the results with the baseline (). To retain only the most reliable hits, all PSMs with P-values above were removed beforehand and the FDR was conservatively computed for the remaining PSMs (see Section 2).
Figure 3 depicts a significant boost in the number of PSMs identified by NPS comparing to at all FDR levels using all three models for considering peak intensities. The ranking approach (NPSranks) demonstrates the best results at all FDR levels, although its advantage over the normalized intensity methods ( and ) is insignificant despite the higher number of estimated parameters (50 ranks versus 4 and 10 intensity levels for each ion type, respectively). Nevertheless, the running time for all three methods is the same since all of them require O(1) lookup in the weight table. Thus, we decided to simply use currently the best strategy (NPSranks) as the only method in further experiments and refer to it simply as NPS. Note that this intensity-aware approach also shows the best results among the three alternative methods in the proteomics benchmarking experiment (see above).
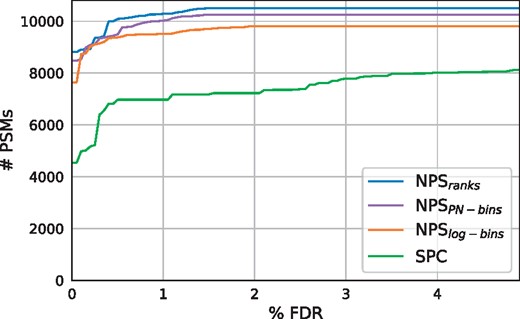
and results on SpectraGNPS. The curves display the number of identified PSMs at different FDR levels
Table 1 shows a more than 20% increase in the number of PNPs and a more than 45% increase in the number of PSMs identified by NPS at FDR 1% under the default decoy generation strategy. Experiments with two alternative strategies also demonstrate a superiority of the suggested scoring method over the baseline (Supplementary Fig. S8).
Summary on and results on natural products spectral datasets
| Method | Number of PSMs | Number of PNPs | Number of PNP families | ||||||
|---|---|---|---|---|---|---|---|---|---|
| FDR 0 | FDR 1 | FDR 0 | FDR 1 | FDR 0 | FDR 1 | ||||
| SpectraGNPS | |||||||||
| 8544 | 4538 | 6972 | 351 | 231 | 304 | 108 | 80 | 92 | |
| 10 504 | 8811 | 10 287 | 395 | 290 | 378 | 132 | 101 | 129 | |
| 1978 | 177 | 177 | 429 | 13 | 13 | 196 | 8 | 8 | |
| 2650 | 412 | 783 | 497 | 33 | 82 | 218 | 14 | 37 | |
| 233 | 230 | 233 | 21 | 20 | 21 | 10 | 10 | 10 | |
| 250 | 250 | 250 | 24 | 24 | 24 | 12 | 12 | 12 | |
| 220 | 15 | 15 | 78 | 2 | 2 | 52 | 2 | 2 | |
| 402 | 174 | 186 | 138 | 30 | 33 | 66 | 12 | 14 | |
| 83 | 83 | 83 | 13 | 13 | 13 | 6 | 6 | 6 | |
| 179 | 179 | 179 | 29 | 29 | 29 | 10 | 10 | 10 | |
| SpectraPSEUD | |||||||||
| 5311 | 280 | 949 | 290 | 32 | 68 | 145 | 15 | 30 | |
| 6562 | 2495 | 5405 | 256 | 143 | 226 | 121 | 58 | 102 | |
| 1380 | 814 | 1380 | 36 | 29 | 36 | 12 | 11 | 12 | |
| 1881 | 1881 | 1881 | 42 | 42 | 42 | 11 | 11 | 11 | |
Note: , FDR0 and FDR1 stand for the number of identified PSMs, unique PNPs or unique PNP families with P-value below , at FDR 0% and 1%, respectively. Here NPS stands for the rank-based NPS model, the finally best overall intensity-aware approach.
3.2.5 Variable identification
We benchmarked NPS within the VarQuest pipeline (referred to as ) on SpectraPSEUD, , and and compared its results to the VarQuest baseline () and the standard dereplication of these datasets ( and ).
Figure 4 shows that significantly increased the number of identified PSMs and PNP families comparing to all other considered methods at all FDR levels and on all spectral datasets. Table 1 demonstrates that while showed the less accurate results than the Dereplicator-based methods, NPS-powered version of VarQuest outperformed all the competitors even at the strictest FDR 0% level in all categories.
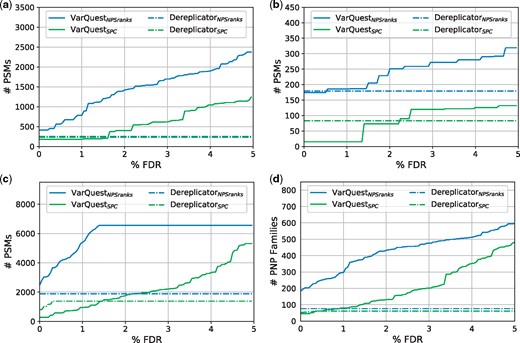
and results on (a) , (b) , (c) SpectraPSEUD and (d) the combination of the three. The curves display the number of identified PSMs (a–c) and PNP families (d) at different FDR levels
3.2.6 Validation of the results
A comparison of and identifications on SpectraGNPS shows that over 96% PSMs (91% PNPs) found by were also reported by (Supplementary Fig. S9). On the other hand, only 64% PSMs (70% PNPs) found by were reported by . To check that these additional identifications represent likely true positives, we limited ourselves to , and SpectraPSEUD datasets. We considered all PNPs found by at 0% FDR and compared them to identifications at FDR 0% and 5%. The results are listed in Supplementary Tables S4–S6. The origin of PNPs was determined based on literature search. Our analysis shows that in the Streptomyces datasets 72% for and 43% for of PNPs were found both by and . The rest of found PNPs can be attributed to Streptomyces spp. or contaminants such as Bacillus spp. which are common to these datasets (Gurevich et al., 2018). One of the PNPs found in is of unknown origin. We manually curated the corresponding PSM and it suggests that this identification represents contamination rather than a false positive (see Supplementary Fig. S10c). In the Pseudomonas dataset 72% of found PNPs were reported by both of the methods. Over 96% of found PNPs have Pseudomonas or Bacillus origin. We further examined identifications visualizing the PSMs related to PNPs which were reported only by . Some of the visualizations are presented in Supplementary Figure S10. Supplementary Figure S10b–d shows matches attributed to putative contaminants.
Supplementary Figure S11 shows that over 98% PSMs (87% PNP families) found by in dataset at FDR 1% were also reported by . For and SpectraPSEUD datasets, these figures rise to 100% PSMs (100% PNP families) and 97% PSMs (100% PNP families), respectively. VarQuest is designed to identify PNP families rather than PNPs, that is why we compared the PNP families identified by at FDR 0% to identifications at FDR 0% and 5% (Supplementary Tables S7–S9). We further visualized some of the identifications in Supplementary Figure S12 to show matches with PNPs related to the datasets origins and attributed to likely contaminants.
4 Discussion
Although there are many highly reliable computational tools for analysis of MS/MS spectra in proteomics, there is still a lack of them in the field of natural products discovery. Here, we demonstrate how some of the state-of-the-art computational ideas from proteomics could be adapted to the specifics of natural products data. The developed approach enabled a significant boost in the results of the leading PNP database search instruments.
Moreover, the proposed model can be further improved if more high-quality PNP training data become available in the future. In particular, it is known that peak intensities strongly depend not only on the ion type but also on the fragmentation site. While proteomics tools successfully utilize such information (Frank and Pevzner, 2005), there is currently not enough training data to learn these patterns in the case of PNPs. Other possible directions include structure-specific and/or instrument-specific weights, e.g. having different parameters for linear, cyclic or branch-cyclic compounds obtained on maXis, micrOTOF or LTQ-Orbitrap mass spectrometers.
The created method has a much wider range of applications than solely PNP dereplication. In particular, a proper procedure for scoring of PSMs and estimation of their statistical significance is desperately needed for discovery of novel PNPs. Recently developed NRPquest (Mohimani et al., 2014b) and MetaRiPPquest (Mohimani et al., 2017b) use genome mining technique for creating databases of putative compounds and further match them against MS/MS data to find the correct predictions. Since the PNP databases in such cases are huge and error-prone, it is critically important to minimize the number of false positive identifications.
Implementation of NPS inside easy-to-use Dereplicator and VarQuest pipelines makes it useful for natural product researchers with various computational background. In particular, the scientists without Unix command-line experience can use convenient web interfaces of the aforementioned tools at the GNPS platform. We believe that our method will be helpful for the natural products community and will be used for identifying numerous PNP spectra that evaded all attempts to interpret them.
Acknowledgements
We thank A. Korobeynikov, H. Mohimani and P.A. Pevzner for insightful suggestions and fruitful discussions.
Funding
This work was supported by Russian Science Foundation (grant 19-16-00049).
Conflict of Interest: none declared.
References
World Health Organization. (

