


Abstract
Our aim is to improve omics based prediction and feature selection using multiple sources of auxiliary information: co-data. Adaptive group regularized ridge regression (GRridge) was proposed to achieve this by estimating additional group-based penalty parameters through an empirical Bayes method at a low computational cost. We illustrate the GRridge method and software on RNA sequencing datasets. The method boosts the performance of an ordinary ridge regression and outperforms other classifiers. Post-hoc feature selection maintains the predictive ability of the classifier with far fewer markers.
GRridge is an R package that includes a vignette. It is freely available at (https://bioconductor.org/packages/GRridge/). All information and R scripts used in this study, including those on retrieval and processing of the co-data, are available from http://github.com/markvdwiel/GRridgeCodata.
Supplementary data are available at Bioinformatics online.
1 Introduction
Adaptive group regularized ridge regression (GRridge, van de Wiel et al., 2016) was introduced to improve the predictive performance of logistic ridge regression by incorporating external and/or internal auxiliary information on the features: the co-data. The co-data is used to define groups of features, e.g. two groups of genes based on their presence or absence in a known gene signature, or groups of microRNAs (miRNAs) based on conservation status. GRridge then estimates group-penalties using empirical Bayes. To date, GRridge is the only regularization method that can structurally and objectively account for multiple sources of information, whileother similar group regularization methods, e.g. group lasso (Yuan et al., 2007) and sparse-group lasso (Simon et al., 2013) can only include one source of information for grouping of features and do not allow a different weight for different groups.
GRridge is illustrated to be a methodology that benefits from multidisciplinary input: it combines statistical summaries of the data with biological knowledge on the molecular features. The promise of GRridge that it can use co-data to improve classification comes with the obligation to explore what types of co-data may be of general use. In addition, we present additional functionalities of the method including better stability of the solutions, penalty estimation for overlapping groups like gene signature pathways, automatic selection of relevant co-data sources and post-hoc feature selection by adding L1-penalty. The latter effectively reduces to a group-weighted elastic-net, which accommodates selecting features with orthogonal effects. Stringent feature selection is often desirable for developing diagnostic assays. Therefore, we evaluate the classifiers using a dynamic number of features.
We present two applications of the GRridge method on count-based(mi)RNAseq, data that were generated from difficult impure samples, i.e. self-collected cervicovaginal specimens and blood-platelets. Those samples are contaminated with non-disease related cells. We hypothesize the use of co-data can improve the performance of a classification model. We show the usage of different types of co-data from internal and external sources.
2 Co-data
We define co-data as nominal or quantitative feature-specific information, obtained independently of the response. Four types of co-data are distinguished, namely (1) response-independent summaries in the primary data (e.g. standard deviations); (2) feature-specific summaries from an independent study (e.g. p-values); (3) feature groupings from public data bases (e.g. pathways); (4) genomic annotation (e.g. chromosome). Co-data type 1, 2 and 4 were demonstrated by van de Wiel et al. (2016) to improve methylation-based diagnostics of precancerous cervical lesions. Co-data type 1 is easily obtained from the data at hand. Co-data type 3 and 4, on the other hand, make use of publicly available information and biological knowledge related to the setting at hand.
3 Applications
3.1 Cervical cancer diagnostics using miRNAseq data
A deep sequencing analysis on small non-coding ribonucleic acid (miRNAseq) was performed on 56 samples (24 women with high-grade cervical intraepithelial neoplasia (CIN3) and 32 healthy women) for the purpose of finding relevant screening markers for cervical cancer screening. We provide more details of the study and the pre-processing procedures in the Supplementary Material. To this pre-processed sequencing data, we applied GRridge to build a classification model by, first, incorporating co-data from internal sources, namely abundance and standard deviation (co-data type 1). This readily available information rises the AUC of the predictive model from 78.8% to 84.3%. We then added co-data from an external source, i.e. conservation status of a miRNA (Agarwal et al., 2015). Although there is no significant harm done by inclusion of more co-data, it does not guarantee a higher performance of the GRridge model. We provide an approach to order and to select multiple co-data sources to optimize model performance (Supplementary Material). Moreover, interpretability improves, because the algorithm automatically determines the relevant co-data and ensures the selected co-datasets have additional positive effects on the model performance. The co-data selection procedure yielded conservation and standard deviation as significant co-data sources (AUC = 87.2%). We then applied the post-hoc L1 selection (Supplementary Material) to the GRridge model with the selected partitions. The feature selection rendered a very competitive model with 3 markers, which was clearly better than lasso and standard elastic net (Fig. 1).
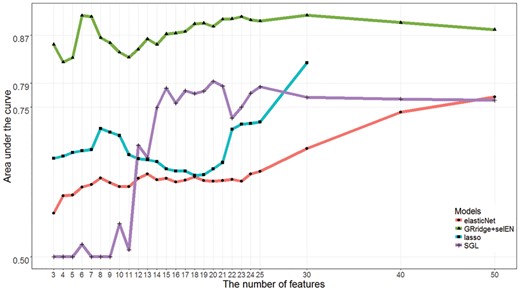
The performance of classification models, assessed by leave-one-out cross-validation, for given numbers of selected features in the miRNA sequencing dataset. X-axis: the number of selected features, amongst these following values 3:1:25, 30, 40 and 50. Abbreviations. GRridge + selEN: GRridge model by incorporating selected partitions; SGL:sparse-group lasso. The feature selection was based on group-weighted elastic-net; lasso: L1-penalized logistic regression. The AUCs of non-selecting classification models are: ridge:0.79; GRridge:0.87; SVM:0.75. Lasso models could not be estimated for 40 and 50 selected features due to a small value of λ1 (Color version of this figure is available at Bioinformatics online.)
3.2 Multi-organ classification using RNAseq data
Blood platelets extracted from patients with 6 cancer types were used to profile RNA markers for early cancer detection (Wurdinger et al., 2015). We focus on discriminating patients with breast and colorectal cancer. Results for the other binary classifications are in the Supplementary Material. To assess the relevance of external information, we focus on co-data types 3 and 4. The performance of the GRridge model with co-data selection outperformed a ridge model and support vector machine (SVM) algorithm (AUC = 89.2%, 77.8%, 77.9%, for GRridge, ridge and SVM respectively). The improvement persisted under feature selection and for most other binary classifications (Supplementary Material).
The external sources for the co-datasets include: (i) gene signature pathways, i.e. immunologic signature (Godec et al., 2016) and transcription factor based pathways (TRANSFAC version 7.4) from the Molecular Signatures Database (Subramanian et al., 2005); (ii) a list of expressed-platelet genes (Bugert et al., 2003; Gnatenko et al., 2003) and; (iii) chromosomal location of the genes. The co-data selection incorporated chromosomal location and immunologic signature pathway. Since pathways are overlapping groups of genes, we adjust GRridge to accommodate such overlap (mathematical details are in the Supplementary Material). We also describe co-data types, including those that did not improve the GRridge prediction in the Supplementary Material.
4 Conclusions
We show the additional functionality and the applications of GRridge on (mi)RNAseq datasets. The method increases the predictive ability of ordinary logistic ridge model with low computational effort. Further, post-hoc L1 selection reveals relevant markers while maintaining good performance of the model.
Funding
This work was supported by the European Research Council (ERC advanced 2012-AdG, proposal 322986; Molecular Self Screening for Cervical Cancer Prevention, MASS-CARE) and Cancer Center Amsterdam, VU University Medical Center (CCA 2014-5-20).
Conflict of Interest: none declared.
References

