


Abstract
Summary: Elucidation of human disease similarities has provided new insights into etiology, disease classification and drug repositioning. Since dysfunctional regulation would be manifested as the decoupling of expression correlation, disease similarity (DS) in terms of dysfunctional regulation mechanism (DRM) could be estimated by using a differential coexpression based approach, which is described in a companion paper. Due to the lack of tools for estimating DS from the viewpoint of DRM in public domain, we implemented an R package ‘DSviaDRM’ to identify significant DS via DRM based on transcriptomic data. DSviaDRM contains five easy-to-use functions, DCEA, DCpathway, DS, comDCGL and comDCGLplot, for identifying disease relationships and showing common differential regulation information shared by similar diseases.
Availability and implementation: DSviaDRM is available as an R package, with a user’s guide and source code, at http://cran.r-project.org/web/packages/DSviaDRM/index.html.
Contact: [email protected] or [email protected]
Supplementary information: Supplementary data are available at Bioinformatics online.
1 Introduction
Disease similarity (DS) study has emerged as an active research area, which helps to systematically investigate etiology, pathogenesis and even perform drug repositioning because drug clinical application can be appropriated from one disease to its similar ones. In recent years, scientists explored DS based on clinical manifestations (Robinson et al., 2008), electronic medical records (Blair et al., 2013), disease-related genes (Goh et al., 2007) and disease-related differentially expressed genes (Suthram et al., 2010). Accordingly, several analysis tools and databases have been released to detect disease relationships, such as DOSim (Li et al., 2011), DiseaseConnect (Liu et al., 2014), Human Phenotype Ontology (Robinson et al., 2008), Comparative Toxicogenomics Database (Davis et al., 2013) and MalaCards (Rappaport et al., 2013). It has been realized that although clinical manifestations and electronic medical records supply valuable information for estimating DS, it is hard to unravel underlying mechanisms hidden in disease relationships. While, the disease relationships generated from disease-related genes/pathways are inevitably biased to well-studied diseases and thus offer limited chance to discover novel findings.
It has been well established that diseases are highly correlated to the rewiring of gene regulatory network or dysfunctional regulation, and differential coexpression analysis (DCEA) has proved to be useful in exploring potential differential regulation mechanism (i.e. dysfunctional regulation mechanism, DRM; de la Fuente, 2010; Liu et al., 2010; Yu et al., 2011). In this sense, DCEA became a valuable complement to traditional differential expression analysis (DEA) in the field of transcriptomics. We have found that DCEA-based disease relationships are more relevant to pathogenic mechanisms than DEA-based ones, which is reported in a companion paper (Yang et al. submitted to Biology Direct, under the 1st revision). In this work, we developed an R package, DSviaDRM, implementing our novel approach for estimating DS via DRM and visualizing common DRMs shared by similar diseases.
2 Description
2.1 Design and methods
Figure 1 shows the overall design and main outputs of DSviaDRM. First, DCEA carries out differential coexpression analyses at both gene level and gene pair level (Liu et al., 2010; Yang et al., 2013; Yu et al., 2011). Second, DCpathway transforms the calculation results from gene level to pathway level, based on which DS estimates disease similarities and outputs significantly similar diseases in the form of a disease network. Then, comDCGL extracts common differentially coexpressed genes (DCGs) and differentially coexpressed links/pairs (DCLs) shared by similar diseases. Finally, by integrating transcriptional regulation information, the common DCGs and DCLs are presented as a gene network via comDCGLplot. Following this architecture, we introduce the above five functions one by one.
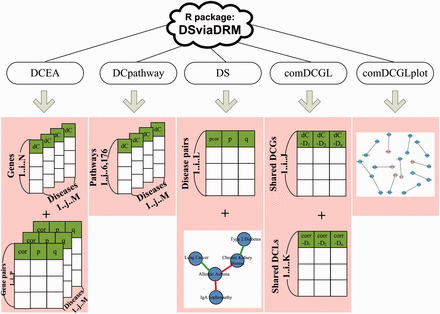
The overall design of DSviaDRM. DSviaDRM includes DCEA, DCpathway, DS, comDCGL and comDCGLplot functions. In comDCGL, dC − Dn is short for the dC values of genes for disease n; similarly, corr-Dn is short for the correlation values of gene pairs for disease n
DCEA: DCEA includes DCp and DCe methods which were developed in our previous works to identify DCGs and DCLs (Liu et al., 2010; Yang et al., 2013; Yu et al., 2011). DCp calculates differential coexpression values (dC) of N genes for M diseases, as well as their p- and q- values; while DCe calculates correlation values of P gene pairs for M diseases, and their p-, q-values (see the Supplementary File for more algorithmic information of DCp and DCe).
DCpathway: DCpathway includes a pathway library which comes from MSigDB and involves 6176 pathways and 21 075 genes. By calculating the dC of a pathway as the average dC of its component genes, DCpathway outputs the dC values of 6176 pathways for each disease as shown in Figure 1.
A permutation test is performed to evaluate the statistical significance of observed correlation coefficients, which randomly re-assigns the affiliation of gene to pathway with three values unchanged: (i) the number of pathways, (ii) the number of each pathway’s component genes, (iii) the number of pathways a given gene belongs to, and re-calculates the pathways’ dCs and partial correlation coefficients between every possible disease pairs. The resulting pseudo partial correlation coefficients form an empirical null distribution, from which the p-value and FDR value (i.e. q-value) can be estimated, and thus significantly similar diseases can be identified according to a user-defined cutoff.
Finally, significant disease relationships are displayed as a network, with nodes representing diseases, red lines representing positively correlated disease relationships, green lines representing negatively correlated relationships, as shown in Figure 1. It is note that when disease A and A′ form a negative link, the patient with disease A tends to be protected from having disease A′ and vice versa, which is probably due to the inversely regulated biological processes involved in the two negatively correlated diseases (Hu and Agarwal, 2009). We also propose that an anti-A drug may have an undesired property of inducing disease A′ when the drug is inversing its target processes (Yang et al. submitted to Biology Direct, under the 1st revision, see supplementary file).
comDCGL: comDCGL sorts out common DCGs and DCLs shared by similar diseases. Their corresponding dC values (for DCGs) and correlation values (for DCLs) are also displayed. Since DCGs and DCLs imply the rewiring of gene regulatory mechanism, DCGs and DCLs are highlighted with regulation information in the TF2target library which includes 199 950 binary tuples of transcription factor (TF)-to-target, as DRA module does in DCGL package (Yang et al., 2013).
comDCGLplot: To provide an intuitive illustration of the common mechanisms shared by similar diseases, comDCGLplot visualizes a DCL-centered gene network with squared pink node indicating DCG TF, squared blue node indicating non-DCG TF, circle pink node representing DCG target, circle blue node representing non-DCG target, line with arrow indicating regulation relation DCL and line without arrow indicating non-regulation relation DCL, still as DRA does in DCGL package (Yang et al., 2013).
2.2 Case study on GEO datasets
‘exprs1’, ‘exprs2’ and ‘exprs3’ which come from three expression datasets, GSE22528, GSE35487 and GSE9006 of GEO (http://www.ncbi.nlm.nih.gov/geo/) are included in the package for demonstrating the functions. ‘exprs1’, ‘exprs2’ and ‘exprs3’ are designed for Allergic asthma, Chronic kidney disease and Type 2 diabetes studies, respectively. dC values of genes and pathways for three datasets were obtained by using DCEA and DCpathway.DS results indicated that Allergic asthma and Chronic kidney disease, Chronic kidney disease and Type 2 diabetes are significantly correlated, respectively. comDCGL sorted out 14 shared DCGs and 1 shared DCL with known regulation information, which were plotted by comDCGLplot (supplementary file).
3 Conclusion
DSviaDRM is released as an R package into the Comprehensive R Archive Network (CRAN) and can be obtained at http://cran.r-project.org/web/packages/DSviaDRM/index.html. Functions of DSviaDRM generally expect gene expression matrices (with genes in rows and samples in columns in disease and normal samples) as a major input, the key output are disease pairs ranked by p-value and a network composed of significant disease relationships. Furthermore, DSviaDRM is able to identify and display common dysregulation information shared by similar diseases.
DSviaDRM is the first tool to exploit DS based on DRM. It facilitates the analysis of DS study and helps to systematically investigate diseases’ etiology and pathogenesis, perform drug repositioning and design novel therapeutic interventions.
Funding
This work was supported by the grants from the National ‘973’ Key Basic Research Development Program (2012CB316501 and 2013CB910801), the National Natural Science Foundation of China (31171268), the Program of International S&T Cooperation (2014DFB30020), and the Fundamental Research Program of Shanghai Municipal Commission of Science and Technology (14DZ1951300 and 14DZ2252000).
Conflict of Interest: none declared.
References
Author notes
Associate Editor: Jonathan Wren

