


Abstract
Motivation: In the past few years, an increasing number of crystal and cryo electron microscopy (cryo-EM) structures of large macromolecular complexes, such as the ribosome or the RNA polymerase, have become available from various species. These multi-subunit complexes can be difficult to analyze at the level of amino acid sequence in combination with the 3D structural organization of the complex. Therefore, novel tools for simultaneous analysis of structure and sequence information of complex assemblies are required to better understand the basis of molecular mechanisms and their functional implications.
Results: Here, we present a web-based tool, Integrative Biology of Sequences and Structures (IBiSS), which is designed for interactively displaying 3D structures and selected sequences of subunits from large macromolecular complexes thus allowing simultaneous structure-sequence analysis such as conserved residues involved in catalysis or protein-protein interfaces. This tool comprises a Graphic User Interface and uses a rapid-access internal database, containing the relevant pre-aligned multiple sequences across all species available and 3D structural information. These annotations are automatically retrieved and updated from UniProt and crystallographic and cryo-EM data available in the Protein Data Bank (PDB) and Electron Microscopy Data Bank (EMDB).
Availability and implementation: The database contains all currently available structures of ribosomes, RNA polymerases, nucleosomes, proteasome, photosystem I and II complexes. IBiSS is available at http://ibiss.igbmc.fr
Contact: [email protected]
Introduction
To obtain a better understanding of large macromolecular complexes that contain multiple and variable subunits, such as the ribosome, the RNA polymerase or the proteasome, appropriate tools are required to allow the integrated analysis of several subunit proteins down to the level of individual residues. For example, eukaryotic ribosomes contain ∼80 proteins of which some are conserved across species, some only share conserved domains, while others are specific to either prokaryotic or eukaryotic species. In this context, protein sequence analysis greatly benefits from the available 3D structures and vice versa. From an Integrated Structural Biology perspective, new tools are needed that allow researchers to conduct broader studies in which various techniques, such as bioinformatics, biochemistry, crystallography and cryo electron microscopy (cryo-EM), may be combined (Klostermeier and Hammann, 2013 Ménétret et al. chapter). Within such an interdisciplinary approach, the integration of diverse sequence–structure–function aspects of a macromolecular complex becomes critical, and it is challenging with regards to the growing amount of biological information. Moreover, because of frequently changing nomenclatures or different naming conventions of related proteins in different organisms, it can become quite tedious to perform a comprehensive study. For well-documented families, such as ribosomal proteins, Uniprot allows gathering through protein families to facilitate the search. In many cases, the nomenclatures of these proteins lack unifying names; an example of addressing this problem is the recent renaming of ribosomal proteins into a species-unifying nomenclature (Ban et al., 2014; Ben-Shem et al., 2011; Yusupov et al., 2001). Moreover, errors can occur and propagate due to automatic annotations which in turn are used for other annotations. The above-mentioned constraints make the use of these data complicated and require additional searching and tedious sorting and validation by the user.
While convenient stand-alone tools exist for sequence alignments (e.g. ClustalW (Thompson et al., 1994), PipeAlign (Plewniak et al., 2003)), taxonomic analysis (e.g. Phylogeny.fr (Dereeper et al., 2008), iTOL (Letunic and Bork, 2007)), and for structure analysis (e.g. Pymol (Delano, 2002) and Chimera (Pettersen et al., 2004)), there is no easy way to combine all this information (Procter et al., 2010) which would provide a better understanding of the basis of molecular mechanisms and their functional implications. Software such as Friend (Abyzov et al., 2005), STRAP (Gille and Robinson, 2006), Chimera's MultAlign viewer (Meng et al., 2006), ConSurf (Ashkenazy et al., 2010) and PyMod (Bramucci et al., 2012) are not connected to a database and require a lot of manual intervention by the user. In general, existing software are better adapted for manual analysis of individual proteins with relatively small data sets, while not being designed for large-scale sequence analysis required for multi-subunit complexes. Thus, interactivity between sequence alignments and 3D structures directly connected to a database often remains unsatisfactory.
Larger databases, such as the NCBI (Ostell and Kans, 1998) and EBI (Emmert et al., 1994), are focusing their efforts on data storage and allow data mining to some extent. Other website tools such as PipeAlign (Plewniak et al., 2003) focus on the processing of sequences, providing efficient and easy to use sequence alignment tools and classification into protein sub-families. Specialized databases such as the Protein Data Bank (PDB) (Bernstein et al., 1977; Meyer, 1997; Peitsch et al., 1995), allow a preview of the structural data online via a Jmol applet version, but simultaneous sequence analysis is not possible. The NCBI server allows finding structures with a sequence similar to that of the query by using CBLAST (Wang et al., 2007), and structures can be viewed with the sequence alignment using the software Cn3D (Hogue, 1997) (‘see in 3D’). However, there are some limitations in that it requires downloading the software and retrieve all the structure and sequence data to perform the analysis locally, and the sequence alignment is limited to two sequences only, while protein subunits may contain hundreds; also, there is no particular amino acid color code there which could facilitate the identification of residues. Taken together, there is a critical need for tools, which could directly combine multiple sequence alignments and structures specifically for large and complex molecular assemblies which are particularly challenging to analyze.
Here, we propose an interactive tool that directly combines structure and sequence analysis using an integrated database of the relevant protein sequence alignments and available 3D structures. Using a web database, it provides access to data relevant for all the subunits of a given macromolecular complex. Such a multi-subunit complex is handled as a set of proteins, each of which contains the relevant data (sequences and atomic coordinates) and which are validated beforehand (e.g. protein sequence fragments are removed). The database contains the pre-calculated sequence alignments which are viewable in a Jalview applet window, and structures can be visualized in a Jmol applet window. It thus becomes easy to correlate structure and sequence alignments directly online for all available structures. Other tools, such as phylogenetic trees, tools for coevolutionary analysis, comparison between species with different composition of complexes are also available.
Methods
The development tools used for the database are web technologies, which are the most appropriate with respect to speed and ease of use. The database is based on the NoSQL language (Lith and Mattsson, 2010) and uses MongoDB (Chodorow and Dirolf, 2010), which allows heterogeneous data to be handled, irrespective of their nature and quantity and which ensures a fast access for intensive search requests. The online services are written in Java and JavaScript.
Proteins included in the database were retrieved from Uniprot (Apweiler et al., 2004), provided they have the status ‘reviewed’ as annotated in Swiss-Prot (Bairoch and Boeckmann, 1991; Bairoch and Apweiler, 1996). For each protein family, selection criteria such as protein name, gene name, sequence length were manually applied to check for errors such as annotation errors and partial sequences, before adding a given protein into a list for automatic updating. All PDB files associated with the sequences have been integrated in the database, together with extensive links to other databases, e.g. PubMed (Liu and Altman, 1998) and EMBL (Hamm and Cameron, 1986), and references have been linked to each protein. For each protein, IDs to all other databases referenced by UniProt are used to create links to each of the corresponding databases. For each protein subunit of a macromolecular complex, a global, multiple sequence alignment has been pre-calculated with the software ClustalW2 and Mafft (Katoh et al., 2002; Thompson et al., 1994), integrated into the database, and the user can choose between the two sequence alignments. To enable the simultaneous visualization of sequence alignments and 3D structures, an interactive link between sequence and structure was created using the software packages Jalview (Clamp et al., 2004; Waterhouse et al., 2009) and Jmol (Herráez, 2006; Cammer, 2007) (Java applet version). This allows processing data directly online in a fully interactive manner with an interface that comprises two windows for 3D structure and sequence, respectively. Interfacing between sequence alignments and 3D structure visualization is facilitated by the Jalview version that is part of Jmol. Amino acids are thus connected between the 2D sequence alignment and 3D structure, and a simple mouse movement over the sequence or structure easily displays the link by changing the appearance of the residue of interest. All Jalview and Jmol applet options remain available, such as editing of sequence alignments. The color code of the sequence alignment is transferred onto the structure using the amino acid color code implemented in PipeAlign according to distinct physicochemical properties (Plewniak et al., 2003). An additional user interface implemented in JavaScript allows quick visualization of structures without displaying the sequences.
Results
From the perspective of integrated structural biology, it is essential to be able to visualize and handle protein sequences and 3D structures in a correlated manner. The present tool, called Integrative Biology of Sequences and Structures (IBiSS), provides a user-friendly interface to interactively link and analyze sequences and 3D structures. Several types of information are needed to facilitate the connection between the analysis of 3D structures and sequence alignments from the level of the full complex down to individual protein subunits and residues. One of the key characteristics of IBiSS is to allow the identification of a conserved amino acid in a given sequence and have it simultaneously highlighted and localized in the 3D structure. This allows the user to analyze its role in molecular recognition in protein–protein or protein–nucleic acid interfaces and interactions (e.g. for translation and transcription complexes (Anger et al., 2013; Ban et al., 2000; Eiler et al., 2013; Harms et al., 2001; Klaholz et al., 2004; Klaholz, 2011; Maletta et al., 2014; Marzi et al., 2007; Orlov et al., 2012; Simonetti et al., 2008; Simonetti et al., 2013a, b; Wimberly et al., 2000), in catalysis or in other functions.
To enlarge the potential applications of IBiSS, several important, widely studied macromolecular complexes involved in transcription or translation or other key cellular processes have been incorporated in the IBiSS database. These include the ribosome, the nucleosome, the RNA polymerase, the proteasome and photosystem complexes I and II (Fig. 1A) (Beck et al., 2012; da Fonseca et al., 2012; Golbeck, 1987; Guskov et al., 2009; Low et al., 2014; Loll et al., 2005; Saenger et al., 2002). For each complex, a set of protein subunits is defined. Additional, more specific functionalities allow the comparison of protein composition in different species and taxonomic tree grouping based on species.

Integrated structure-function analysis with the IBiSS interface. (A) Overall home webpage from which a macromolecular complex can be selected. (B) Sequence analysis display. The purple box includes navigation tabs to access different functions to analyze the results of the table section. The red box allows changing analysis tools for a given complex. The blue box contains a scrollable sequence alignment tab. The green box contains a table of results for the tool ‘All species for one protein’. (C) 3D structure analysis display. The blue box is part of the 3D structure content tab, which comprises a 3D structure viewer Jmol with a control panel for quick structure visualization. The red box contains the 3D selection tools. The green box is a PDB file viewer for displaying the PDB file content
The development tools used for the database are web-based technologies, which have proven to be the most appropriate in terms of speed and ease of use. Indeed, the database NoSQL allows handling very heterogeneous data, as is often the case in biology. Web-based technologies allow the tool to be used on any operating system (OS), without special installation requirements or compatibility problems, facilitating software access and distribution. The choice of the MongoDB database that contains all the data provides high-speed interactivity. External databases, such as Uniprot and PDB are used only in the context of updating, but are not called directly through the interactive user interfaces. Because precalculated sequence alignments and PDB coordinates are stored in MongoDB, a quick and interactive access to the web site is achieved, which greatly enhances the data access speed through the web site. The update is done automatically on a monthly basis. To take into account modifications of sequence annotations and corrections, not only novel sequences are added but the entire sequences are updated with the associated structures. The aligned sequences are obtained from a global alignment to minimize alignment errors by using a large number of sequences. When required, it is possible to extract and display just two sequences out of many, while still benefiting from the better global alignment as compared to a simple pair-wise alignment (Fig. 1B). It is also possible to select a portion of the alignment for a quick taxonomic analysis using the checkbox, the results in the Sequence tab or directly on the co-evolution page.
In the following, we describe practical aspects of the IBiSS tool that are available to the user. On the main web page, the user selects the complex of interest, e.g. ribosome, nucleosome, etc. Next, a specific protein can be chosen. IBiSS then produces a page that contains all sequences related to this protein, and sequence alignment and 3D structure tools available for each sequence. The residue color code of the alignment is reported on the 3D structure and facilitates residue identification. A Jmol window allows visualizing the 3D structure and a Jalview window shows the sequence alignment. The two windows are connected interactively (Jmol is integrated in Jalview and serves for the 3D visualization). If the mouse is positioned over an amino acid of the 3D structure, the same amino acid in the corresponding sequence in the sequence alignment is automatically recentered and changes color in the Jalview window. Inversely, if the mouse is over an amino acid in the 2D sequence alignment window, the corresponding amino acid becomes highlighted in the structure (Fig. 2A). On the left panel, a table is included with the description of each sequence and an annotation of the protein describing name, species, UniProt identifier, tools for 3D visualization and correlation between sequences and structures that are displayed for each structure. Full information for each protein is also visible in a checkbox and by referring to a ‘References tab’ that allows a complete description of the protein with active links to other databases, in a manner as implemented in UniProt (Apweiler et al., 2004). Displaying the results for the selected sequence is achieved without leaving the web page to avoid toggling between pages. A panel on the right of the interface provides access to sequence alignments, 3D structures, taxonomy and bibliographic references. Multiple sequence alignments can be retrieved from the IBiSS webpage. A portion of the alignment can be isolated to compare two or more sequences. The ‘3D’ tab allows handling all the information relevant to the available 3D structures. A Jmol window is embedded in the web page with an interface to access the main features. The ‘3D’ tab provides a quick and interactive view, for any of the available structures for this protein (structure of the protein alone, and structure of the protein complex). Displaying the PDB text file provides a view of the comments about the structures, such as the COMPND record that describes the macromolecular contents of an entry. The functionalities of Jmol are available by right clicking, in the same way as on the Jmol application of the PDB website, and some options are facilitated through the JavaScript interface (e.g. display options of macromolecules; Fig. 1C). All 3D functionalities, including those for structure-sequence correlation, will automatically load the Java applets. The ‘taxonomy’ tab allows displaying an interactive taxonomic tree summary for each species for which at least one sequence is present.
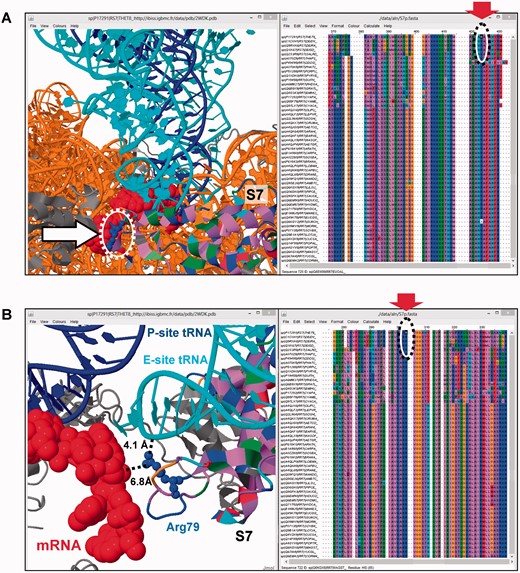
A concrete example of linking sequence alignments and structure information of a ribosomal protein, as part of the multi-proteinsubunit 70S ribosome. (A) Global view of the structure with protein S7 (small ribosomal subunit, 30S) interactively linked with the sequence alignment. The mRNA and tRNAs are indicated in red and blue, respectively. (B) In the example given, ribosomal protein S7 is localized on the structure window with the backbone chain residues labeled according to the residue color code in the sequence window. The solvent-exposed and conserved residue Arg 79 is highlighted in red as a good candidate for interactions with mRNA bound in the 30S platform region. mRNA and tRNAs are colored in red, blue and cyan respectively. For simplicity, ribosomal rRNAs and the 50S ribosomal subunit are not shown
To analyze correlated amino acid changes, a coevolution analysis tool has been integrated in IBiSS which includes the entire protein database. It allows choosing a taxon for the protein of interest in a taxonomic tree, and visualizes the corresponding sequence alignments. Coevolutionary sequence variability between taxa can also be observed, e.g. if a taxon reveals a mutation in a binding site, the interacting protein partner of the same taxon may carry a complementary or compensatory mutation.
To illustrate the main features of the IBiSS tool, we present a typical example of a ribosomal protein, S7, which is part of the bacterial ribosome (∼54 proteins, 3 rRNAs; Anger et al., 2013; Ban et al., 2000; Harms et al., 2001; Wimberly et al., 2000). S7 is located on the platform region of the 30S ribosomal subunit, close to the interface with the 50S subunit and the exit-site tRNA. It is involved in the binding of mRNA to the small ribosomal subunit. Using IBiSS, the number of sequences available for the S7p protein can be visualized at a glance. The sequence alignment reveals high sequence conservation across species, with one variable domain between prokaryotes and eukaryotes.
This example illustrates the powerful potential of a convenient interactive analysis linking 3D structure and sequence alignment. By analyzing the amino acid conservation in the sequence alignment, a series of amino acids can be identified that are positively charged and highly conserved in all species of ribosomal protein S7. These residues are mainly located in the C-terminal region of protein S7. Because they do not interact with other proteins or with other ribosomal components, but instead are solvent-exposed, it can be concluded that they are important for the binding of mRNA considering that many of the conserved residues carry positively charged side-chains which could interact with the negatively charged phosphate moieties of the mRNA. Thus, it is very easy to localize surface-exposed residues that could be involved in mRNA recognition (Fig. 2B). In a previous study, all of this comprised a tedious manual analysis, including the retrieval of structures, sequences and residue identification (Marzi et al., 2007).
An additional taxonomy analysis is also possible, which in this example leads to a large number of proteins because of the broad representation of protein S7 in prokaryotes, eukaryotes or archaea. The taxonomy can be used to study coevolutionary aspects from the ‘co-evolution’ page. From the taxonomic tree, one can select the protein of interest for many taxa of interest and display the corresponding alignments. Because several amino acids of interest have been already identified, each taxon can be displayed to more easily identify at what point of evolution a given mutation occurred. It is also possible to use multiple Jalview and Jmol windows simultaneously (e.g. with multiple screens). The 3D structure shows that protein-protein interactions occur between protein S7 and proteins S9 and S11 (Fig. 3), for which the identification of amino acids is straightforward in IBiSS. Moreover, co-evolution analysis in IBiSS conveniently identifies a conserved residue pair at the interface between proteins S7 and S11 (Fig. 3). Inversely, strictly conserved amino acids in proteins S9 and S11 which are involved in protein-protein interactions with S7 can be identified easily within the ribosome complex.
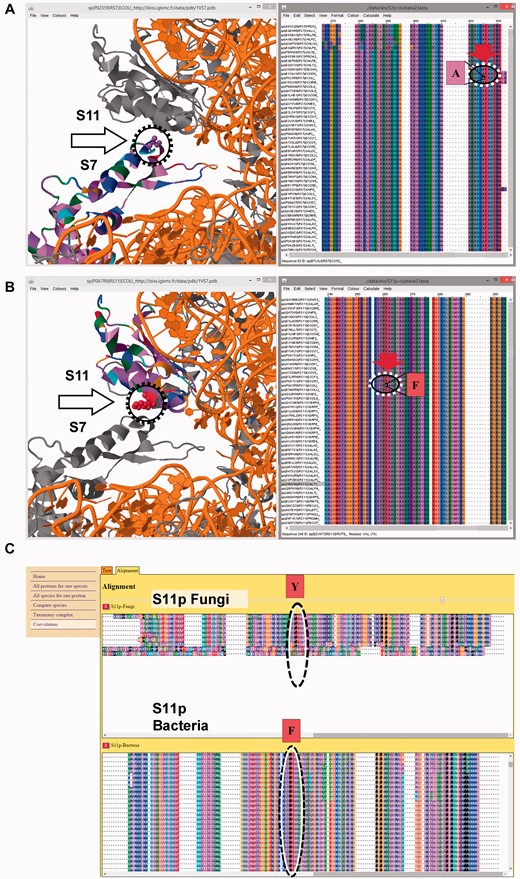
Example of coevolution study between ribosomal S7 and S11 proteins using IBiSS. (A) Global view of the ribosome structure with the S7 protein interactively linked with the corresponding sequence alignment. (B) Global view of the ribosome structure with the S11 protein interactively linked with the corresponding sequence alignment. (C) The selection of sequences of the multi-sequence alignment based on taxa reveals a coevolution at the interface between proteins S7 and S11. In protein S11, a phenylalanine (B) residue conserved in bacteria (label ‘F’) is replaced by a tyrosine (label ‘Y’) conserved in fungi; within a 3 Å distance, in protein S7, an alanine (A) residue is replaced by a serine residue, suggesting an additional hydrogen bond between protein S7 and S11 in fungi. With the IBiSS tool, this analysis is quick and easy thanks to its integrated database
Taken together, IBiSS provides a convenient, interactive and robust tool that facilitates combined structure and sequence analysis of complicated, multi-subunit macromolecular complexes. As compared to the combined usage of independent tools such as STRAP, Friend, Chimera and PyMOL, IBiSS represents a significant added value in that it provides an immediate, interactive and structured way to access the data through an integrated database which interactively links structures, pre-computed multi-sequence alignments, co-evolutionary and phylogeny tools. The data are standardized and grouped into protein families thus simplifying work when the same protein has several different names in the databanks. All features are integrated and can be used directly without the need of plugins. This is very useful for the identification of conserved amino acids and their 3D localization, eventually leading to design of new experiments for testing the functional implications of a particular residue. Using a web-based database, IBiSS gives immediate access to the relevant protein sequence alignments and available 3D structures for all the subunits of a given macromolecular complex. An additional typical feature of IBiSS is that phylogenetic analysis and coevolutionary tools are linked to multi-sequence alignments.
Taken together, the present tool provides an easy and unified access to structure and sequence information of large complexes and allows data mining in an interactive and correlated manner, thus facilitating the identification of conserved amino acids in a sequence and their localization in the 3D structure. In the example provided above, residues exposed on the surface of the small ribosomal subunit platform can be identified much more easily than in the previously published manual analysis (Marzi et al., 2007). In general, IBiSS contributes to the development of integrative tools which are increasingly needed for integrated biology approaches. The preprocessed data which are accessible online allow performing bioinformatics analysis without requiring much data manipulation nor advanced knowledge in bioinformatics data processing. The database within IBiSS currently contains a series of typical large complexes, the ribosome (including the latest human ribosome structure; (Khatter et al., 2015), translation initiation factors, the RNA polymerases, nucleosome, proteasome and photosystem I and II complexes. Currently, the database comprises 62 000 sequence entries and 2400 structure entries which are pre-processed to enhance interactivity. In the future, it could become interesting to extend IBiSS to include user-defined complexes to create their own data base within IBiSS.
Acknowledgements
We thank Julie Thompson, Jean-François Ménétret, Kareem Abdul Mohideen and Isabelle Billas for comments and the other group members for discussions, Remy Fritz for making the software available online, and the referees for nice suggestions.
Funding
This work was supported by the European Research Council (ERC Starting Grant 243296), the BioScape Project, the Centre National pour la Recherche Scientifique (CNRS), the French Infrastructure for Integrated Structural Biology (FRISBI) ANR-10-INSB-05-01, and Instruct as part of the European Strategy Forum on Research Infrastructures (ESFRI) and the IGBMC facilities. The electron microscope facility is supported by the Alsace Region, the Fondation pour la Recherche Médicale (FRM), INSERM, CNRS and the Association pour la Recherche sur le Cancer (ARC). Université de Strasbourg (IDEX, Investissement d’Avenir).
Conflict of Interest: none declared.
References
Author notes
Associate Editor: Anna Tramontano

