


Abstract
Motivation: RNA-Seq experiments have shown great potential for transcriptome profiling. While sequencing increases the level of biological detail, integrative data analysis is also important. One avenue is the construction of coexpression networks. Because the capacity of RNA-Seq data for network construction has not been previously evaluated, we constructed a coexpression network using striatal samples, derived its network properties and compared it with microarray-based networks.
Results: The RNA-Seq coexpression network displayed scale-free, hierarchical network structure. We detected transcripts groups (modules) with correlated profiles; modules overlap distinct ontology categories. Neuroanatomical data from the Allen Brain Atlas reveal several modules with spatial colocalization. The network was compared with microarray-derived networks; correlations from RNA-Seq data were higher, likely because greater sensitivity and dynamic range. Higher correlations result in higher network connectivity, heterogeneity and centrality. For transcripts present across platforms, network structure appeared largely preserved. From this study, we present the first RNA-Seq data de novo network inference.
Contact: [email protected]
Supplementary information: Supplementary data are available at Bioinformatics online.
1 INTRODUCTION
RNA-Seq is a relatively new method for gene expression analysis that has provided important insights into transcriptome structure. The level of detailed biological insight available through transcriptome sequencing is superior to microarray platforms, most notably in detecting alternatively spliced isoforms (Wang et al., 2008) and non-coding RNAs and small RNAs that are not generally interrogated using microarray platforms. In addition, RNA-Seq offers significantly higher levels of transcript accuracy when compared to microarray platforms (Wang et al., 2009). While increasing our understanding of specific biological processes, these new insights have also brought into focus the full extent of the complexity of eukaryotic transcriptomes. In this context, integration of RNA-Seq data into a systems-level framework of transcription analysis is increasingly important.
Network analysis provides a productive approach to visualization and analysis of high-throughput biological data. Transforming the data into a graph/network framework offers distinct advantages, allowing the adoption of techniques developed in graph theory, engineering and computer science; these approaches can directly relate specific biological interactions or disease states with the network properties and dynamics (Chen et al., 2008; Farber, 2010; Iancu et al., 2011; Muers, 2011; Mukhtar et al., 2011).
Gene coexpression networks have provided important insights into the global structure of the transcriptome in a variety of species (Oldham et al., 2006, 2008). The transcriptome coexpression network displays many properties often associated with biological and social networks: modularity, centralization, heterogeneity and clustering (Dong and Horvath, 2007; Prifti et al., 2010). As experimental techniques improve and the level of technical/experimental noise decreases, improved estimates of these parameters can be expected.
2 METHODS
2.1 Data selection and preprocessing
Detailed descriptions of RNA-Seq and microarray data-processing steps have been published elsewhere (Bottomly et al., 2011); here, we provide a brief outline of the procedures. All experimental procedures were reviewed and approved by the Portland Veterans Affairs Medical Center Institutional Animal Care and Use Committee under protocol ID VA1509. The Illumina microarray data (Illumina MouseRef-8 v2.0) consisted of 24 male mice [12 C57BL/6 (B6) and 12 DBA/2 (D2)]; seven samples of each strain were in common with the RNA-Seq data. The Illumina data were analyzed using the lumi Bioconductor package and normalized using the robust spline normalization procedure (Du et al., 2008). The Affymetrix microarray data (Affymetrix MOE 430 2.0) consisted of 20 samples, equally divided across genders and strains. These data were processed using the Robust Multichip Average methodology as implemented in the Affymetrix Bioconductor package, with background correction and quintile normalization (Irizarry et al., 2003); a custom script was used for SNP correction.
The RNA-Seq data (Illumina GAIIx) consisted of 10 B6 and 11 D2 mice. The reads were aligned using the Bowtie short read alignment program. For the D2 mice, the reads were aligned to a SNP-corrected mouse genome assembly based on the NCBI m37 assembly and SNPs obtained from the Sanger Mouse Genome Project (http://www.sanger.ac.uk/resources/mouse/genomes/). The counts were summarized relative to Ensembl 59 gene models and the read counts were corrected using upper quartile normalization from EdgeR (Robinson et al., 2010). Read count normalization and microarray datasets are publicly available in the Gene Expression Omnibus database (Edgar et al., 2002) under accession number GSE26064, while the RNA-Seq data are publicly available through the ReCount data repository (Frazee et al., 2011).
To compare analysis results across platforms, all datasets were restricted to probes, probe sets and reads that correspond to Ensembl build NCBIm37 build 59 unique exons. In the microarray datasets, individual probes that spanned a single nucleotide polymorphism between the B6 and D2 strains were masked (Walter et al. 2009); probes deemed undetectable were also removed. For the RNA-Seq data, genes with zero read counts in at least one B6 and one D2 sample were removed.
2.2 Coexpression network construction and validation
 represents the number of transcripts connected to both transcripts i and j, while u indexes all the transcripts in the network.
2.3 Gene ontology annotation of network modules
Network modules were tested for gene ontology (GO) enrichment (Ashburner et al., 2000) using the GOstats R package (Falcon and Gentleman, 2007). To adjust for the nested structure of the GO database, we used a graph decorrelation procedure (Alexa et al., 2006). Significance values were Bonferroni adjusted due to testing of each GO category against multiple modules.
2.4 Module overlay with Allen Brain Atlas
The Allen Brain Atlas contains information about the spatial distribution of genes within the mouse brain (Lein et al., 2007). Using the NeuroBlast algorithm (Ng et al., 2009), it is possible to retrieve correlation values between the spatial patterns of genes and compare this correlation structure with the microarray coexpression (Iancu et al., 2010). For each gene, NeuroBlast retrieves the top 250 genes with the most closely matched spatial profiles. To test whether our network modules have significant spatial overlap, we counted the number of ‘spatial edges’ between module genes. A spatial edge is considered present between two genes when one gene is between the top 250 genes most closely overlapping with the other gene. The number of spatial edges in a module was compared with the number of edges found in random groups of genes of the same size.
2.5 Evaluation of module preservation across datasets

For the tabulation-based preservation measure, each module in the test network is compared with one of the modules in the base network; the module chosen for comparison is the strongest counterpart based on number of common nodes. Statistical significance and Z scores are evaluated using randomly selected groups of nodes and measuring their overlap with the module of interest.
3 RESULTS
3.1 Structure and properties of the RNA-Seq coexpression network
A gene coexpression network was constructed using the normalized RNA-Seq data (Bottomly et al., 2011), as outlined in Section 2. The branches of the clustering tree correspond to modules or groups of transcripts with similar coexpression profiles. We identified 21 initial modules in RNA-Seq data; after validation using a bootstrapping procedure (see Section 2), 18 modules displayed TO that was higher than what can be expected for random groups of transcripts (Fig. 1).
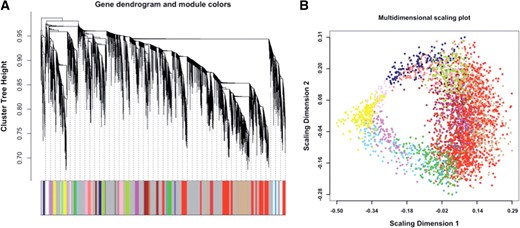
High-level structure of the RNA-Seq coexpression network. Modules are denoted by arbitrary colors. (A) Dendrogram based on the topological overlap between transcripts. (B) Multidimensional scaling plot of dissimilarities between genes, based on topological overlap. Module genes appear clustered together
Biological networks frequently display scale-free properties (Barabasi and Oltvai, 2004), which for weighted networks implies that the network connectivity (sum of connection strengths) is exponentially distributed. In other words, a few nodes (denoted as hubs) have high connectivity, while a much larger number of nodes have small connectivity. We assessed how well our RNA-Seq network conforms to this model of network structure by computing the linear fit, log10(p(k))=c+g log10(k) where p(k) is the proportion of nodes with connectivity k and c is a constant (Zhang and Horvath, 2005). Because the network properties are dependent on the parameter β (see Section 2), we evaluated the fit and the average connectivity for a range of β parameters (Fig. 2). On the basis of the scale-free fit criteria (Zhang and Horvath, 2005), we chose a value of 10 for the soft-thresholding power.
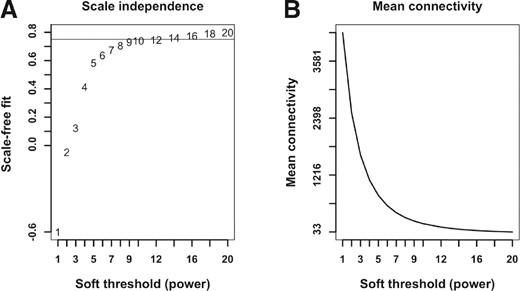
Topological properties of the RNA-Seq network. (A) Scale-free fit as function of soft threshold power. (B) Mean connectivity
3.2 Module biological annotation and neuroanatomical properties
To evaluate the biological significance of the network modules, we quantified the overlap between modules and GO categories. We determined that most of the modules were associated with distinct GO categories (see Supplementary Table S1), signifying that there is a level of distributed functionality within the transcriptome network.
Using microarray data from striatal samples, we have previously detected a relationship between microarray coexpression and spatial colocalization within the striatum (Iancu et al., 2010). We inquired whether the same relationship with spatial colocalization is detectable using RNA-Seq data. Using spatial colocalization information available in the Allen Brain Atlas, we detected significant spatial colocalization for four modules (significant at α=0.05 after Bonferroni correction for comparison against 18 modules P<0.002).
3.3 Similarities and differences in network properties across platforms
To have an unbiased comparison of network properties, we selected a set of transcripts that had high connectivity across all three datasets: for each dataset, we selected the transcripts with connectivity in the top 50%; the intersection of these transcripts resulted in 3618 transcripts further used for network construction and comparison. All parameters used in network construction were equal.
One of the advantages of RNA-Seq versus microarray platforms is the greater sensitivity (capacity to evaluate transcripts at extremely low abundance levels), as well as a greater dynamic range, because the detection technology is not susceptible to saturation. We inquired whether these advantages translate into better ability to infer the network structure. The basis for coexpression network structure is the pairwise correlation between transcripts. It is conceivable that in microarray studies the true expression levels are truncated below because of the inability to detect low levels—and truncated above because the detection technology is subject to saturation. If these assumptions are correct, then we could expect that microarray data would have lower levels of variability compared with RNA-Seq data. Our results are concordant with these predictions: both the pairwise correlations (network adjacency) and the coefficient of variation are higher in the RNA-Seq versus the microarray platforms (Fig. 3A and B, respectively). The connectivity values are also higher (Fig. 3C); this is expected given the fact that connectivity sums adjacency values for each node. All comparisons of RNA-Seq versus microarray values are highly significant (t-test P-value of <10−15).
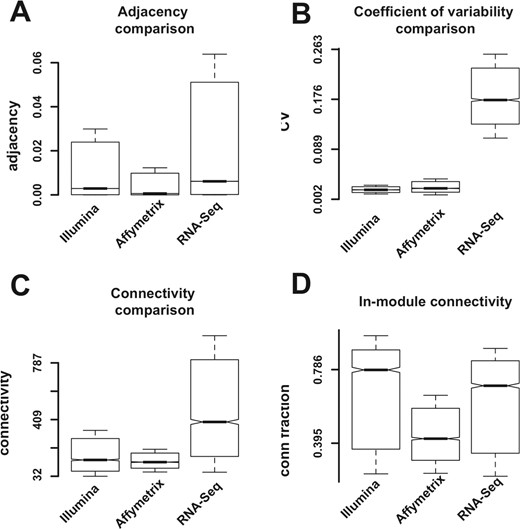
Comparison of network statistics. (A) Pairwise adjacencies. (B) Coefficient of variability. (C) Transcript connectivity. (D) Ratio of module versus total connectivity
Connectivity values can be separated between in-module connectivity and out-module connectivity. For modular networks, most of the connectivity lies within the module. We evaluate the fraction of in-module connectivity for each transcript by the ratio of module connectivity and total network connectivity. For all three networks, large fractions of total connectivity are in-module: for the Illumina microarray and RNA-Seq, the median values are 0.8 and 0.7, respectively, while for the Affymetrix platform the ratio was 0.4 (Fig. 3D); this could be a consequence of the lower adjacency and connectivity values in the Affymetrix platform.
The global structure of networks can be evaluated using a set of network statistics, including density, centrality and node heterogeneity (Dong and Horvath, 2007): high centrality indicates that a few modes have significantly higher connectivity values than average, and node heterogeneity measures the degree of variability in node connectivity values.
We computed the network statistics for each of the three networks, and we found that in most cases the RNA-Seq values are higher than each of the microarray-derived quantities (Table 1).
Global network statistics comparison
| Illumina array | Affymetrix array | RNA-Seq | |
|---|---|---|---|
| Density | 0.02 | 0.018 | 0.05 |
| Centralization | 0.08 | 0.05 | 0.12 |
| Heterogeneity | 0.83 | 0.64 | 0.83 |
| Illumina array | Affymetrix array | RNA-Seq | |
|---|---|---|---|
| Density | 0.02 | 0.018 | 0.05 |
| Centralization | 0.08 | 0.05 | 0.12 |
| Heterogeneity | 0.83 | 0.64 | 0.83 |
Network density, centralization and heterogeneity are higher in RNA-Seq compared with microarray networks.
One method of evaluating the robustness of network construction is by constructing the network using a smaller number of samples and evaluating how fast the network structure converges to the final full-data network. Partial-data and full-data networks are compared using matrix correlation. We applied this subsampling procedure to our datasets and compared the convergence rates; this revealed that the RNA-Seq data appears to converge faster than both microarray platforms (Fig. 4). We suggest that the higher quality of the sequencing data renders the network construction procedure more robust to sample removal.
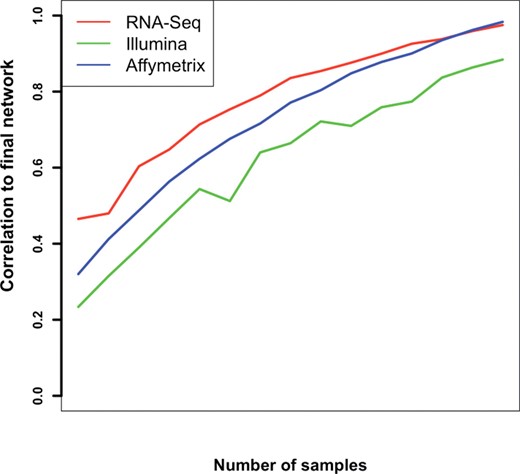
Rate of convergence of subsampled networks. Networks constructed using a subset of the samples are compared with full-data network
3.4 Evaluation of module preservation across platforms
We further evaluated whether modules detected independently in the datasets retained their structure across platforms. We employed three methods of evaluating module preservation: density-based methods, connectivity-based methods and tabulation-based methods (Langfelder et al., 2011). Density-based methods evaluate several adjacency matrices; one adjacency matrix is denoted as the reference matrix (Illumina microarray in our case). Modules are detected using the reference adjacency matrix; the reference modules are then evaluated for increased coexpression in each of the test datasets. Connectivity-based methods evaluate whether node connectivity values are preserved between networks. Tabulation-based methods independently detect modules in each dataset; subsequently, these modules are tested for significant overlap. Strong tabulation-based preservation implies that each module in a test dataset has one and only one counterpart in the reference dataset.
Overall, we found that the density measures detected significant preservation across the three networks structure, while tabulation-based methods did not report preservation for all modules.
The preservation values for each module are summarized using bootstrap-derived Z values, based on selecting random groups of genes of the same size (see Section 2). We use the Illumina microarray as the reference network, and we compare the other two networks against it. Most density-based Z values were large, signifying preservation above chance (Table 2). In contrast, using the tabulation-based preservation measure, only about half the reference modules appeared preserved in the RNA-Seq dataset.
Module preservation statistics of RNA-Seq and Illumina microarray modules
| Module | Module size | Z overlap | Z density | Z connectivity | Z matrix correlation | Z summary |
|---|---|---|---|---|---|---|
| Black | 160 | −0.08 | 3.4 | 4.88 | 13.63 | 4.14 |
| Blue | 377 | 38.02 | 2.85 | 12.7 | 73.64 | 7.78 |
| Green | 238 | 5.04 | 5.29 | 4.76 | 13.78 | 5.03 |
| Red | 216 | −0.6 | 5.2 | 9.54 | 31.49 | 7.37 |
| Turquoise | 1000 (truncated) | 2.02 | 5.7 | 8.2 | 39.54 | 6.94 |
| Yellow | 240 | −1.07 | 5.67 | 8.86 | 31.66 | 7.26 |
Module assignment based on Illumina network, arbitrary colors for modules. For computational efficiency, the large turquoise module has been truncated to 1000 randomly selected member genes.
4 DISCUSSION
Our results illustrate the advantages of RNA-Seq data in gene coexpression network construction. Importantly, we find that the increased dynamic range and accuracy of deep sequencing as compared with microarray platforms allows better estimation of network properties, such as network density, connectivity, centralization and heterogeneity. We find that RNA-Seq estimates of these values are generally higher than values derived from microarray data; this is of interest because heterogeneity and centralization distinguish hierarchical networks from purely random networks (Ravasz et al., 2002). Note that several modules do not appear preserved based on cross-tabulation-based preservation measures. While this may reflect real differences between platforms, it could also be due to the instability observed in many clustering procedures (von Luxburg, 2010). A major advantage of the network-based module preservation statistics (Z density, etc) used in this article is that they do not require module assignment in the test dataset and therefore, allow one to make rigorous claims regarding module preservation. According to these preservation statistics, we find that network module structure is significantly preserved across platforms in particular with respect to density-based preservation statistics. We derive functional annotation and neuroanatomical features of the transcriptome that provide insights into the biological mechanisms underlying the coexpression structure: we find that genes that share functional annotation are often coexpressed, as are genes that share spatial localization within the striatum.
Taken together, our results suggest that network approaches are a promising avenue of integrative RNA-Seq data analysis.
ACKNOWLEDGEMENTS
Funding: This work was supported by grants MH051372 (O.D.I. and R.H.), DA005228 and AA011114 (N.W.), AA013484 (R.H.), AA010760 (R.H., S.K.M. and N.W.), 5UL1RR024140 (D.B. and S.K.M.), 5P30CA069533-13 (S.K.M.), the Veterans Affairs Research Service and a grant from the MJ Murdock Charitable Trust.
Conflict of Interest: none declared.
REFERENCES
Author notes
Associate Editor: Ivo Hofacker

