


Abstract
Motivation: MicroRNAs (miRNAs) are small non-coding RNAs that regulate transcriptional processes via binding to the target gene mRNA. In animals, this binding is imperfect, which makes the computational prediction of animal miRNA targets a challenging task. The accuracy of miRNA target prediction can be improved with the use of machine learning methods. Previous work has described methods using supervised learning, but they suffer from the lack of adequate training examples, a common problem in miRNA target identification, which often leads to deficient generalization ability.
Results: In this work, we introduce mirSOM, a miRNA target prediction tool based on clustering of short 3′-untranslated region (3′-UTR) substrings with self-organizing map (SOM). As our method uses unsupervised learning and a large set of verified Caenorhabditis elegans 3′-UTRs, we did not need to resort to training using a known set of targets. Our method outperforms seven other methods in predicting the experimentally verified C.elegans true and false miRNA targets.
Availability: mirSOM miRNA target predictions are available at http://kokki.uku.fi/bioinformatics/mirsom.
Contact: [email protected]
Supplementary information: Supplementary data are available at Bioinformatics online.
1 INTRODUCTION
MicroRNAs (miRNAs) are an abundant class of small, non-coding RNAs found in diverse organisms (Bartel, 2009; Lee et al., 1993). miRNAs direct the post-transcriptional repression and degradation of mRNAs by binding to their sequence with partially complementary sites and thus impact a variety of biological functions, including cell differentiation, organism growth, development and tumor suppression (Kloosterman and Plasterk, 2006). While the amount of published miRNAs is increasing and a large number of genes is predicted to be regulated by miRNAs, only a small fraction of miRNA–target genes are experimentally verified. For example, there are now 175 Caenorhabditis elegans miRNAs annotated in miRBase database (Griffiths-Jones et al., 2008), but only 15 entries for six of these miRNAs in the latest release of TarBase (Papadopoulos et al., 2009). As experimental identification of miRNA targets is difficult, the computational prediction of the target genes is a valuable tool to investigate miRNA functions and in guiding related wetlab experiments.
Occurrence of perfect seed matches (seed = the nucleotides 1–8 of the miRNA 5′-end) from the 3′-untranslated region (3′-UTR) of the mRNA, evolutionary conservation of the miRNA–target relationship and the free energy ΔG of the miRNA:mRNA duplex are the most often used determinants in miRNA target recognition (Brennecke et al., 2005; Enright et al., 2003; Krek et al., 2005; Lewis et al., 2003). However, in animals, miRNA binding to the mRNA is imperfect, and a perfect seed matching site is neither necessary nor sufficient for downregulation (Didiano and Hobert, 2006; Vella et al., 2004). Thus, the importance of miRNA 3′ base pairing to compensate for weak seed pairing has become another factor in identifying potential miRNA targets (Brennecke et al., 2005). Also the sequence context of the miRNA target site and the amount of sites in a 3′-UTR are suggested to have effect on the miRNA binding efficacy (Didiano and Hobert, 2008; Grimson et al., 2007; Sætrom et al., 2007; Vella et al., 2004). In all, the predictions given by different tools are diverse, and the amount of overlapping miRNA:target gene predictions is small (Bartel, 2009).
The use of machine learning methods can improve the accuracy of miRNA target prediction (Kim et al., 2006; Wang and El Naqa, 2008; Yousef et al., 2007). However, the performance of these methods is dependent on the quantity and quality of the dataset used in the training. The number of experimentally validated miRNA true and false targets is small, and while we have some knowledge about miRNA binding to the target site, our knowledge regarding false target sites is limited. This problem can be avoided by using unsupervised learning. In this work, we show how the self-organizing map (SOM) (Kohonen, 1995) can be used to identify potential miRNA target sites from C.elegans 3′-UTR sequences. The SOM is a neural network algorithm widely used to categorize large, high-dimensional datasets by mapping the data into a smaller dimension, typically into a 2D lattice of interconnected neurons. Each neuron of the SOM contains a reference model, which represents a local domain in the input space. In bioinformatics, SOM is applied to problems like gene expression data analysis (Törönen et al., 1999), study of codon usage (Kanaya et al., 2001), clustering of protein sequences (Kohonen and Somervuo, 2002), gene finding (Mahony et al., 2004) and identification of transcription factor binding sites (Mahony et al., 2005). We trained the SOM using short substrings of C.elegans 3′-UTR sequences so that the putative target sites for each miRNA were clustered in one or in two adjacent neurons in the lattice. As the clustering is based on the overall similarity of the training strings, the SOM captures not only those verified miRNA target sites with perfect 7mer and 8mer seed matches, but also those sites with more imperfect matches. The SOM contains the whole repertoire of putative miRNA target sites ordered according to similar seed complementarity, so it likely includes also the target predictions for currently unknown miRNAs.
2 METHODS
Our goal was to find putative miRNA target sites by clustering all the substrings extracted from the regions of experimentally verified C.elegans 3′-UTRs. To do this, we constrained the target sites of all miRNAs to have the same length. As the length of miRNA target site is close to the length of the binding miRNA and 95% of C.elegans miRNAs are 20–24 nt long, with an average length of 22 nt, we chose 22 nt as the length of training sequences. Although the length of the most miRNAs differ from 22 nt within a few nucleotides, this has a minor effect on the result since the last nucleotides in the 3′-end are not as important as the seed area in the miRNA—target site interaction. A process flow chart describing the mirSOM method is given in Figure 1.
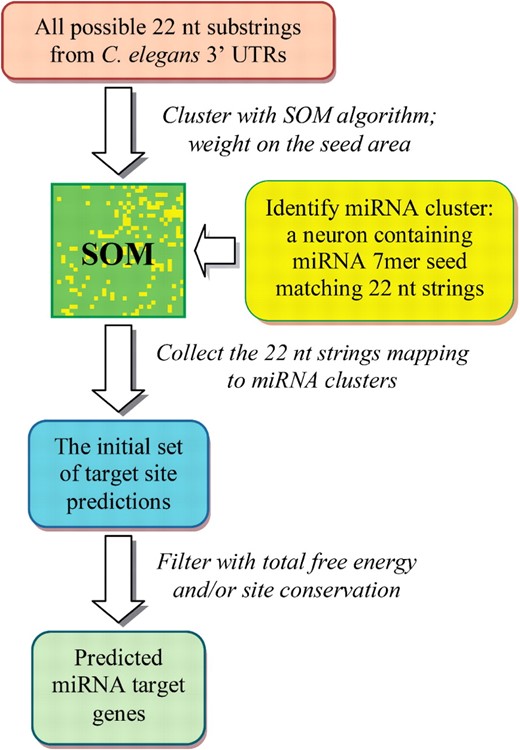
Flow chart for the miRNA target prediction using mirSOM.
Caenorhabditis elegans 3′-UTR sequence data used for SOM training: we downloaded all the experimentally verified C.elegans 3′-UTR sequences contained in WormBase release WS195 (Harris et al., 2010). If there were several transcripts available for a gene, the transcript with longest 3′-UTR was selected, and those sequences that were <50 nt long were discarded. The final sequence set used for training the SPM contained 8980 verified 3′-UTR sequences, 50–1912 nt in length. These sequences were then segmented into every overlapping 22 nt substrings, resulting a training set with 1 813 599 22 nt 3′-UTR substrings.
miRNA sequences: the sequences of C.elegans and C.briggsae mature miRNAs and miRNA*s were downloaded from miRBase release 15 (Griffiths-Jones et al., 2008). This dataset includes 176 miRNA and 57 miRNA* sequences for C.elegans, and 121 miRNA and 10 miRNA* sequences for C.briggsae. This set contains 92 orthologous miRNAs with a conserved hairpin precursor.
SOM architecture: the structure of the SOM is a 32 × 32 lattice of interconnected neurons. Each neuron contains a 4 × 22 model matrix, which is initialized with a random sequence, but is through an unsupervised learning process modified to represent the position-specific characteristics of a larger set of repeated features in the training data, for example target sites of a miRNA. As Watson–Crick base-pairing of a target site to the miRNA seed is crucial for targeting, the last 8 nucleotides (nucleotides 15–22) in the neuron model matrix representing the seed were weighted so that the input sequence distance from the model matrix in nucleotides 15 and 22 was multiplied by a factor of two and in nucleotides 16–21 with a factor of five, while the distances in the rest of the nucleotides were not weighted. Training of the SOM was carried out sequentially, so that after finding the most similar neuron weight matrix for a randomly picked training sequence, this ‘winner’ weight matrix and the weight matrices of its neighbor neurons were immediately updated towards the training sequence. Thus, during the training, the weight matrix in each neuron was adjusted to represent a position-specific frequency matrix of 3′-UTR substrings clustered to it. The SOM was trained with 20 epochs with the whole training dataset. In the ordering phase (epoch 1), the neighborhood of the best matching unit contained the whole net, but was then decreased linearly so that during the last fine-tuning phase (epoch 20), it contained only the closest neurons around the winner node. The learning rate parameter was held constant in the first (lr = 0.9) and last epoch (lr = 0.0001), but was decreased linearly in between. The size of the SOM and the seed weighting schema used in the final network were found to work best when all networks containing 16 × 16, 24 × 24 and 32 × 32 neurons with different emphasis in the seed area were trained and their capability to separate the miRNA clusters was analyzed. The SOM algorithm was implemented with Java 2 SE, the source code is available as Supplementary Material.
miRNA clusters: for each miRNA, we searched all the 22ṅt sequences in our training set that had perfect Watson–Crick base-pairing in their section of the last 8 nts with a miRNA 7mer seed. Neurons that contained these seed matching sequences for a miRNA were attached to the cluster of that miRNA, and so each C.elegans miRNA cluster came to include 1–3 neurons. For C.briggsae, the miRNA clusters were defined similarly.
Initial set of miRNA target sites: a larger sequence set containing all the verified 3′-UTRs for C.elegans coding transcripts in WS213 was extracted from WormBase. Again, only the transcript with the longest verified 3′-UTR for each gene was kept for analysis, leading to the set of 12 866 verified 3′-UTRs. All of the 22 nt substrings of these 3′-UTRs were then introduced to the trained SOM and the substrings hitting the miRNA cluster neurons were collected, yielding the sets of initial target site predictions for each miRNA.
Orthologous 3 ′-UTR sequences and the initial set of miRNA target predictions for C.briggsae: the predicted C.briggsae WormBase orthologs for all C.elegans protein coding genes were downloaded from WS215. This set contained at least one predicted C.briggsae ortholog for 11 851 C.elegans genes included in our miRNA target prediction gene set. The predicted 3′-UTR sequences for these orthologs were constructed by extracting 1000 nt downstream from the end of the last exon of each C.briggsae gene included. The initial C.briggsae miRNA target sites were obtained by collecting the 22 nt substrings whose most similar neuron in the SOM was a C.briggsae miRNA cluster neuron.
Total free energy for miRNA binding: the total free energy was calculated for each miRNA–target site pair in the initial prediction set of the two worms. First, a larger sequence containing the 22 nt target site and 70 nt upstream and downstream from it was extracted from the 3′-UTR. This length of 70 nt was chosen based on the fact that secondary structure base-pairing interaction between nucleotides that are separated by > 70 nt is unlikely (Kertesz et al., 2007). If the first nucleotide of the site was located closer than 70 nt from the 3′-UTR start, a part of the last exon was attached to get the 70 nt upstream. If the last nucleotide of the site was closer than 70 nt from the 3′-UTR end, the downstream part was truncated to this smaller size. To get the energy needed to open the site area for miRNA binding, ΔGopen, we calculated the free energy of the thermodynamic ensemble using RNAfold (Hofacker, 2003), first for this 162 nt sequence as such, and then when the target site in the middle of it was forced to be open. ΔGopen is the difference of these energies. Next, we calculated the free energy of the thermodynamic ensemble for the miRNA–target site duplex with RNAcofold (Hofacker, 2003) and obtained the total energy freed in miRNA binding to the site with equation Δ Δ G = Δ Gduplex + ΔGopen.
3 RESULTS
3.1 SOM trained with C.elegans 3′-UTR substrings
The SOM trained with 22 nt substrings of C.elegans experimentally verified 3′-UTRs is illustrated in Figure 2. Each short sequence in the training data is assigned to one, most similar neuron in the net. Sequences mapped to the same neuron are similar with each other, and especially similar they are in the region of the last 8 nt complementary to the miRNA 8mer seed area. In Figure 2, the number of training sequences mapped to each neuron is shown, and the yellow color indicates the locations of miRNA cluster neurons. For C.elegans, there are 160 cluster neurons in total, containing an average of 2148 training data strings each.
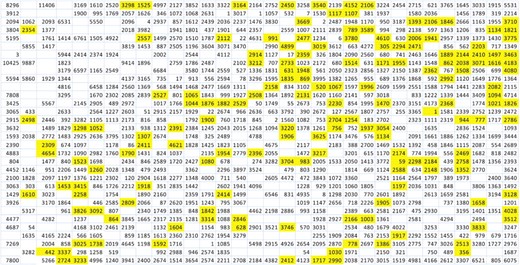
The SOM trained with C.elegans 3′-UTR substrings. The yellow colored cells indicate the locations of C.elegans miRNA cluster neurons in the lattice. The numbers display the amount of training sequences mapped to each neuron of the trained map, empty cells are neurons with no hits.
In Figure 3, the miRNA names are attached to their clusters. miRNAs that share the same 8mer seed sequence are always clustered to the same neuron and their names are coupled together in a single miRNA name ending with an ‘F’ representing ‘family’. To save space, we used this abbreviation also in some cases where two miRNAs with the same cluster share a 7mer seed. For example let-7F stands for let-7, miR-241, miR-48, miR-795 and miR-84 sharing the 8mer seed UGAGGUAG and also for miR-793 (UGAGGUAU) and miR-794 (UGAGGUAA) which share a 7mer seed with the first five miRNAs. The abbreviations used in the Figure 3 are clarified in Supplementary Table S1. The seven let-7F miRNAs and two other miRNAs, miR-124 (UAAGGCAC) and miR-2211 (UCAGGUAG) share the same, one and only cluster neuron of the SOM lattice. Altogether, 211 of 233 miRNAs contain only one neuron in their cluster and 117 neurons of these are clusters for only one miRNA. Twenty-one miRNAs have two neurons in their clusters, while the cluster for one miRNA star sequence, cel-lin-4* contains three neurons. When there is more than one neuron in a miRNA cluster, these neurons are adjacent in the map, except for mir-240 and mir-63* for which these neurons are more distant but still quite near to each other. Note that only the upper right quarter of the SOM is shown in Figure 3. For the whole network, see Supplementary Figure S1.
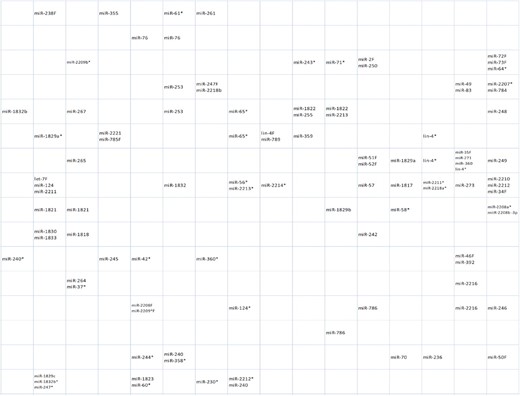
Caenorhabditis elegans miRNA cluster locations. The cluster of each miRNA is shown by the miRNA name. A name ending with ‘F’ indicates a miRNA family, a couple of miRNAs with the same 8mer or 7mer seed with the same cluster neuron. Only the upper right quarter of the SOM is shown. The entire network can be seen in Supplementary Figure S1.
To visualize how the different miRNA 8mer seed complementary sequences are distributed in the SOM lattice, we presented the consensus sequences of the substrings mapped to each neuron, including only the last 8 nt (see Fig. 4 for the upper-right quarter of the SOM and Supplementary Figure S2 for the entire SOM). Consensus sequences that contain an abundance of nucleotide T are located in the upper left corner of the net while sequences in the opposite, right lower corner of the net are rich of A:s instead. The clusters of about a third of all known C.elegans miRNAs are located in the upper right quarter of the net. The consensus sequences often contain an N in the first and in the last place, for example the consensus sequence of the let-7F cluster is NTNCCTNN. When there are fewer miRNAs attached to a neuron, the consensus sequence often is more precise. For example, NTACAAAN for the lsy-6 sole cluster neuron.
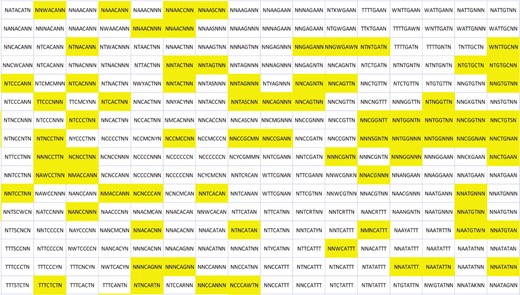
The distribution of 8mer seed complementary sequences in the SOM. Yellow color indicates the clusters of C.elegans miRNAs. Only the upper right quarter of the SOM is shown. The entire network can be seen in Supplementary Figure S2.
3.2 miRNA target prediction using mirSOM
All the 22 nt 3′-UTR substrings mapped to a miRNA cluster neuron in the SOM were considered as the initial set of target sites for that miRNA. The total free energy showing the accessibility of the site for the miRNA binding was calculated for each site in the initial prediction set. In order to optimize the predictions made by our tool, its capability to correctly pick out the 20 experimentally verified miRNA–target genes and discard the 13 well-characterized cel-lsy-6 false targets (for a list of genes see Supplementary Table S2) was measured as the function of the total free energy cut-off used (Fig. 5). The optimal threshold was −7.2 kcal/mol, when 17 of 20 verified true targets were found and 12 of 13 false targets were rejected. Then, for each miRNA in both nematode species, we left out those sites in the initial prediction set whose total free energy value exceeded this threshold. For the orthologous miRNAs, the conservation of each miRNA–target gene relationship in C.elegans and C.briggsae was studied: if also the ortholog gene 3′-UTR included a predicted site for the miRNA located closer than 20 nt from the site in the C.elegans 3′-UTR, the miRNA–target gene relationship was classified as conserved. As phylogenetic conservation is a very strong indicator for a miRNA–target relationship, we restored to the set of final predictions target genes which included a perfect 7mer or 8mer seed match with too large total energy, but instead a conserved predicted site in C.briggsae, thus resulting in the final set of mirSOM target predictions. The sensitivity and specificity of mirSOM are 0.90 and 0.92, when calculated using the sets of experimentally verified miRNA true and false target genes. It is noteworthy that while the initial prediction set for all miRNAs with the same cluster neuron were the same, this is not the case in the final predictions. For example, if we consider miRNA let-7, 56% of its final predicted targets are shared with the miRNAs with the same seed and the same cluster neuron, and only 17% of its targets are shared with all eight miRNAs with the same cluster neuron.
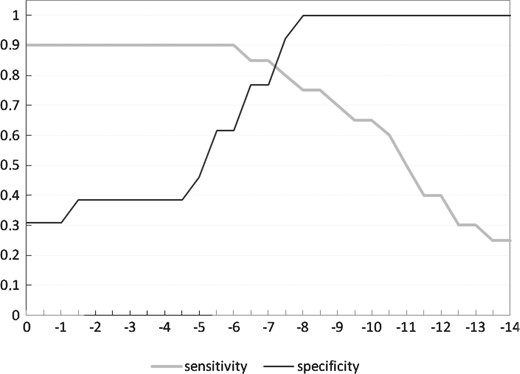
The sensitivity and specificity of the model as the function of the total energy threshold used. The verified true (20 genes) and false (13 genes) miRNA–target relationships were used to optimize the output of the SOM model. The optimal energy threshold is −7.2 kcal/mol, when 17 of 20 true targets were accepted and 12 of 13 false targets rejected.
3.3 Comparison of mirSOM with other methods
We compared the miRSOM performance with seven other miRNA target prediction tools available: NBmiRTar (Yousef et al. 2007); PITA (Kertesz et al., 2007); rna22 (Miranda et al., 2006); MicroCosm (Griffiths-Jones et al., 2008); TargetScanWorm (Ruby et al., 2006); PicTar (Lall et al., 2006); and mirWIP (Hammell et al., 2008). Of these, NBmiRTar uses supervised machine learning by a naïve Bayes classifier applied to the output of miRanda program (John et al. 2004). NBmiRTar is a model generated from sequence and miRNA:mRNA duplex information from validated targets and artificially generated negative examples. Rna22 uses short patterns extracted from mature miRNA sequences to find eligible places for miRNA targeting, and then pairs up these islands with a miRNA. PITA first identifies the initial seeds for each miRNA in the 3′-UTR, then calculates the site accessibility and combines the sites for the same miRNA to get the total interaction score. NBmiRTar, rna22 and PITA (version PITA All) do not apply any cross-species sequence conservation filter to the target predictions. MicroCosm (earlier known as miRBase Targets), TargetScanWorm and PicTar are the three tools most commonly used for miRNA target prediction in C.elegans. While MicroCosm searches for maximal local complementarity alignments between a miRNA and a 3′-UTR and uses the conservation filter afterwards, TargetScanWorm and PicTar predict conserved miRNA targets using genome-wide alignments of the 3′′UTRs of C.elegans, C.briggsae and C.remanei. mirWIP is a recent tool based on contextual features of miRNA binding sites enriched in a set of genes predicted by immunoprecipitation to be targets of a set of conserved C.elegans miRNAs (Zhang et al., 2007). mirWIP differs from the other six computational tools compared in that it is based on unique biological experiments.
First, we compared the overlap of the miRNA target sites predicted with these tools. NBmiRTar was excluded from this part of the comparison, because there is no bulk download available for its prediction data. As mirSOM has also the conserved site prediction aspect, we made these comparisons separately for tools that do not require conservation and for tools with a conservation filter. The Venn diagram in Figure 6a shows the number of predicted sites common to mirSOM, PITA and rna22. In comparison to the number of predictions made in all, the size of target gene set predicted with all the three tools is small. Approximately 28% of mirSOM predictions are common with PITA, but PITA also contains the largest number of predictions in all. The low number of common predictions with rna22 may be due to the small number of predictions downloadable for rna22 which contains sites from <3000 genes.
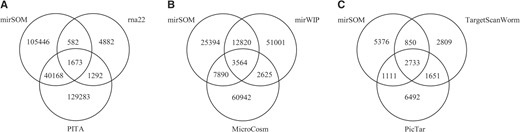
The degree of overlap between the predictions of mirSOM compared with six other miRNA target prediction tools. The number of mirSOM predictions included in each comparison depends on the scope. (A) All mirSOM predictions compared with rna22 and PITA, (B) mirSOM predictions for orthologous miRNAs compared with mirWIP and MicroCosm and (C) mirSOM conserved predictions compared with TargetScanWorm and PicTar.
When we compared mirSOM with tools utilizing a conservation filter, only the mirSOM predictions for the orthologous miRNAs were taken into calculations. The number and intersections of miRNA–target gene interactions predicted by mirSOM, mirWIP and MicroCosm are shown in the Venn diagram in Figure 6b. About 30% of mirSOM predictions are common with mirWIP and ∼50% of the mirSOM predictions are found with either of the tools. The results of a similar comparison made between mirSOM, TargetScanWorm and PicTar are shown in Figure 6c. As TargetScanWorm and PicTar search for conserved targets, only the 10 070 conserved miRNA–target gene pairs contained in mirSOM predictions were taken along. Forty percent of these mirSOM predictions are shared with either PicTar or TargetScanWorm, and about one-third of the mirSOM predictions are common to all of the three tools, thus underlining the ability of them all to find the perfect seed matching, conserved miRNA target sites. Altogether, ∼35% of the miRNA–target gene interactions predicted by mirSOM are included in the prediction set of at least one of the six other tools. Among the predictions made only with mirSOM are the predicted targets for 57 star miRNAs and 23 miRNAs that are not included in any of the other tools. Also the gene sets and 3′-UTR sequences incorporated in these tools are unequal, which has an impact to the comparison results.
Secondly, we tested the ability of these tools to find the experimentally verified C.elegans miRNA–target genes and to reject the lsy-6 false target genes (Supplementary Table S2). For seven of the 33 genes studied, there was no verified 3′-UTR available; so for them we extracted the 1000 nt sequence downstream from the last exon to act as the predicted 3′-UTR. mirSOM found 18 of 20 true target genes in the list (Table 1). The two verified targets not found are let-7 target genes let-60 and lin-41. Interestingly, let-60 and lin-41 have a couple of sites in neurons adjacent to let-7 cluster. Of these, the let-60 sites in positions 479–500 and 128–149 in its 3′-UTR have also acceptable total free energy values, −13.9 kcal/mol and −9.1 kcal/mol, respectively. Thus, if we would include also the adjacent neurons to let-7 cluster, mirSOM would correctly predict all but one of the true targets. However, even with the 18 true targets found, mirSOM outperforms all the other methods. Of the 13 well-characterized lsy-6 false targets mirSOM rejects 12, together with rna22. NBmiRTar is the only tool that rejects all the false targets, when used with the default values of its parameters. The number of rejections made by the other five tools is between 3 and 11 (Table 2). For mirWIP and PITA, the largest set of predictions available is used in the comparison, which has an effect to the number of false target predictions.
The experimentally verified C.elegans miRNA–target genes found by mirSOM, NBmiRTar, PITA, rna22, MicroCosm, TargetScan, PicTar and mirWIP
| miRNA | Gene | mir | NBmiR | PITA | rna22 | Micro | Target | PicTar | mirWIP |
|---|---|---|---|---|---|---|---|---|---|
| name | Som | Tar | Cosm | Scan | |||||
| let-7 | C35E7.4 | X | X | X | – | – | – | – | – |
| let-7 | ceh-16* | X | X | – | – | – | – | – | X |
| let-7 | daf-12 | X | X | X | X | X | X | X | X |
| let-7 | die-1 | X | X | X | – | X | – | – | – |
| let-7 | hbl-1 | X | X | X | X | X | X | X | X |
| let-7 | let-60 | – | X | – | – | – | – | – | X |
| let-7 | lin-41 | – | – | – | X | – | – | X | X |
| let-7 | let-526 | X | X | X | – | – | – | – | – |
| let-7 | nhr-23 | X | – | – | – | – | – | – | X |
| let-7 | nhr-25 | X | X | X | – | – | – | – | X |
| let-7 | nhr-4 | X | X | X | – | – | X | X | – |
| let-7 | pha-4 | X | – | – | – | – | – | – | X |
| let-7 | T14B1.1 | X | X | X | X | X | X | X | X |
| let-7 | uba-1 | X | X | X | – | – | – | – | X |
| let-7 | unc-129 | X | X | X | – | X | X | X | X |
| lin-4 | lin-14* | X | X | – | – | – | X | X | X |
| lin-4 | lin-28 | X | X | X | – | X | X | X | X |
| lsy-6 | cog-1 | X | - | X | – | X | X | X | X |
| mir-273 | die-1 | X | X | X | – | – | – | – | – |
| mir-61 | vav-1 | X | X | X | – | – | X | X | X |
| 18 | 16 | 14 | 4 | 7 | 9 | 10 | 15 |
‘X’ = the gene is included; ‘-’ = the gene is not included in the predictions. Asterisks (*) next to gene name refers to targets which did not have a verified 3′-UTR in WS213, and the 1000 nt downstream sequence was used instead to test the mirSOM method.
Verified C.elegans lsy-6 non-target genes found by mirSOM, NBmiRTar, PITA, rna22, MicroCosm, TargetScan, PicTar and mirWIP
| miRNA | Gene | mir | NBmiR | PITA | rna22 | Micro | Target | PicTar | mirWIP |
|---|---|---|---|---|---|---|---|---|---|
| name | Som | Tar | Cosm | Scan | |||||
| lsy-6 | C27H6.3 | – | – | – | – | X | X | X | – |
| lsy-6 | ptp-1 | – | – | X | X | – | – | – | – |
| lsy-6 | fkh-8 | – | – | X | – | X | X | X | X |
| lsy-6 | nsy-1 | – | – | X | – | – | – | – | – |
| lsy-6 | acl-5 | – | – | X | – | – | X | X | – |
| lsy-6 | aex-4 | – | – | X | – | – | X | X | – |
| lsy-6 | T20G5.9 | – | – | – | – | – | X | X | – |
| lsy-6 | glb-1 | – | – | – | – | X | X | X | – |
| lsy-6 | hlh-8* | – | – | – | – | – | X | X | – |
| lsy-6 | F55G1.12* | – | – | – | – | – | X | X | – |
| lsy-6 | T04C9.2* | X | – | – | – | – | X | X | X |
| lsy-6 | T05C12.8* | – | – | – | – | – | X | X | – |
| lsy-6 | T23E1.1* | – | – | – | – | – | – | X | – |
| 1 | 0 | 5 | 1 | 3 | 10 | 11 | 2 |
‘X’ = the gene is included; ‘-’ = the gene is not included in the predictions. Asterisks (*) next to gene name refers to targets which did not have a verified 3′-UTR in WS213, and the 1000 nt downstream sequence was used instead to test the mirSOM method.
4 DISCUSSION
We have here introduced a new machine learning-based method, mirSOM, for miRNA target finding. Our method is founded on the basic knowledge about miRNA target sites: these sites have imperfect complementarity with the miRNA sequence, where the most crucial part is the miRNA seed, these sites are preferentially located in the 3′-UTR of the transcript and they are accessible to miRNA binding. This means that a chunk of short substrings of the 3′-UTRs are miRNA target sites. We sought these sites by clustering short 3′-UTR substrings with the SOM. The training data consisted of all possible 22-nt long substrings extracted from verified C.elegans 3′-UTRs, and the trained SOM contains, besides the information about the target sites of miRNAs known today, also a view of the mutual similarity of miRNA sequences. The fact that 90% of the miRNA clusters reside in a single neuron of the lattice implies that the SOM is well organized, and it is quite probable that also the clusters for miRNAs yet to be found from C.elegans are located in one or two nearby neurons of the map. Once trained, the SOM can be applied, not only to find putative targets for new C.elegans miRNAs, but also to find the targets for the orthologous miRNAs in other worms thus enabling the study of target conservation. As mirSOM uses only the filtering by site accessibility to post-process the initial target sites obtained from the SOM, it opens up a simplification to the miRNA target prediction, but still works well in finding the verified miRNA target sites, while keeping the number of predictions moderate.
A common problem in miRNA target finding is the small number of experimentally verified miRNA–target genes, which has hindered efforts to develop machine learning methods for target prediction tasks. In particular, this makes it hard to build a supervised model whose performance is highly dependent on the quantity and quality of the positive and negative training datasets used. The unsupervised learning algorithm used by mirSOM clusters the putative target sites for each miRNA objectively, using no knowledge about the verified true and false targets until the optimal total free energy threshold for the site accessibility is defined. When compared with NbmiRTar, a method using supervised machine learning, mirSOM finds 18 of the 20 experimentally verified targets while NBmiRTar predicts 16 of 20. These are the two best results in the comparison (Tables 1 and 2). Since both of these tools are also very specific in their predictions, it suggests that miRNA target prediction truly can be improved by the use of machine learning methods.
The standard SOM algorithm has some limitations, like the non-adaptable fixed architecture, which is relative to the expected number and structure of the clusters. Instead of using an algorithm that would adaptively determine the number of clusters (Mavroudi et al., 2002; Hsu et al., 2003), we searched experimentally for such size and weighting schema for the standard SOM that would work best in this particular problem. As the solution does not necessarily need a more sophisticated architecture, we decided to keep the original SOM algorithm which is well known and easy to understand.
mirSOM finds well those verified miRNA targets which include a perfect 7mer or 8mer seed match, and also most of those target genes with a shorter or otherwise imperfect miRNA seed match. It also successfully rejects the sites from known false target genes with a perfect seed match by using the total energy filter to the initial prediction set. The energy threshold used, which relies on just a few verified miRNA–target gene interactions presently available, should be adjusted as more miRNA–target genes in C.elegans are verified. Also, the SOM used in the initial target site finding step is trained with verified 3′-UTR data, so it may be not suitable for finding miRNA target sites from other sequence data, for example from 5′-UTRs and the coding region. This is because the sequence characteristics, like nucleotide composition and functional elements, of these regions of mRNA differ from the 3′-UTRs, and the clustering result using these sequences would likely be different. We demonstrate here that mirSOM can identify targets in nematodes and it should be possible to construct SOMs for other species. Future studies will be aimed at verifying targets in more complex organisms such as human and mice.
ACKNOWLEDGEMENTS
Jussi Paananen, Mitja Kurki and Petri Törönen are acknowledged for technical assistance, comments and discussion.
Funding: Saastamoinen Foundation; Finnish Cultural Foundation, North Savo Regional fund; Finnish Cultural Foundation; Doctoral Program in Molecular Medicine at the University of Eastern Finland.
Conflict of Interest: none declared.
REFERENCES
Author notes
Associate Editor: Ivo Hofacker

