


Abstract
Motivation: Over the recent years, the vision that RNA simply serves as information transfer molecule has dramatically changed. The study of the sequence/structure/function relationships in RNA is becoming more important. As a direct consequence, the total number of experimentally solved RNA structures has dramatically increased and new computer tools for predicting RNA structure from sequence are rapidly emerging. Therefore, new and accurate methods for assessing the accuracy of RNA structure models are clearly needed.
Results: Here, we introduce an all-atom knowledge-based potential for the assessment of RNA three-dimensional (3D) structures. We have benchmarked our new potential, called Ribonucleic Acids Statistical Potential (RASP), with two different decoy datasets composed of near-native RNA structures. In one of the benchmark sets, RASP was able to rank the closest model to the X-ray structure as the best and within the top 10 models for ∼93 and ∼95% of decoys, respectively. The average correlation coefficient between model accuracy, calculated as the root mean square deviation and global distance test-total score (GDT-TS) measures of C3′ atoms, and the RASP score was 0.85 and 0.89, respectively. Based on a recently released benchmark dataset that contains hundreds of 3D models for 32 RNA motifs with non-canonical base pairs, RASP scoring function compared favorably to ROSETTA FARFAR force field in the selection of accurate models. Finally, using the self-splicing group I intron and the stem-loop IIIc from hepatitis C virus internal ribosome entry site as test cases, we show that RASP is able to discriminate between known structure-destabilizing mutations and compensatory mutations.
Availability: RASP can be readily applied to assess all-atom or coarse-grained RNA structures and thus should be of interest to both developers and end-users of RNA structure prediction methods. The computer software and knowledge-based potentials are freely available at http://melolab.org/supmat.html.
Contact: [email protected]; [email protected]
Supplementary information: Supplementary data are available at Bioinformatics online.
1 INTRODUCTION
Over the recent years, the vision that RNA molecules only serve as a genetic information carrier has dramatically changed. Today, it is widely accepted that most of the genome is actively transcribed (Wong et al., 2001) and that non-coding RNA molecules would have key functional roles in several fundamental cell processes such as cell division, growing and differentiation (Storz, 2002). Indeed, RNA molecules are now known to carry diverse functions, such as catalysis (Staple and Butcher, 2005), transcription regulation (Doudna and Cech, 2002) and chromosome repair (Storici et al., 2007), among others.
In this context, experimental determination of RNA three-dimensional (3D) structures has become an essential tool for characterizing the functional activity of new RNA molecules. As a direct consequence of this, the number of RNA structures deposited in the Protein Data Bank (PDB) has rapidly increased over the past few years, reaching now over 1800 structures (Berman et al., 2002). Additionally, new computational tools for the assessment, prediction and comparison of RNA structures have been recently developed (Capriotti and Marti-Renom, 2008b, c, 2009; Das and Baker, 2007; Dror et al., 2006; Ferre et al., 2007; Parisien and Major, 2008; Sharma et al., 2008). Therefore, the total number of RNA structures—either solved by experiment or predicted by computer-based methods—is expected to continue to increase at a high rate (Capriotti and Marti-Renom, 2008b). This fact poses the urgent need for developing accurate RNA structure assessment methods and tools. The development of new methods for assessing the accuracy of RNA structure models can benefit from previous experience gathered in the field of protein structure prediction and assessment. One of the most popular approaches to assess the quality of 3D protein structures has been the use of knowledge-based or statistical potentials (Capriotti and Marti-Renom, 2008a; Ferrada and Melo, 2007, 2009; Ferrada et al., 2007; Melo and Feytmans, 1998, 2008; Melo and Marti-Renom, 2006; Melo and Sali, 2007; Sippl, 1993b). However, a drawback of this methodology is that it ideally requires a non-redundant set with several dozens to hundreds of experimentally solved structures (Melo et al., 2002; Sippl, 1990), which in the case of RNA may be difficult to obtain because most of the known RNA molecules available in the PDB are highly redundant at the sequence level. Despite this, a recent publication has reported the first calculation of a knowledge-based potential for RNA structure prediction and assessment (Jonikas et al., 2009). This new knowledge-based scoring function for RNA structures, named NAST, relies on a coarse-grained representation (i.e. C3′ atoms only) of RNA geometrical features (i.e. distances, angles and dihedral angles) and it has been derived by calculating statistics from only three experimental structures of large ribosomal units. The NAST scoring function was used for successfully predicting coarse-grained 3D structures of RNA sequences of varying length. NAST was able to build RNA structure models averaging 8.0 and 16.3 Å root mean square deviation (RMSD) for the yeast phenylalanine tRNA and the P4–P6 domain of the Tetrahymena thermophila group I intron, respectively (Jonikas et al., 2009). More recently, a full-atom potential available within the ROSETTA suite was successfully used for the de novo prediction and design of non-canonical RNA 3D structures (Das et al., 2010). This new full-atom potential contains weak carbon hydrogen bonding and solvation terms, as well as a complete description for potential hydrogen bonds between bases and backbone oxygen atoms.
Here we introduce the description and development of a new knowledge-based or statistical potential for RNA structure prediction and assessment called Ribonucleic Acids Statistical Potential (RASP), which has the following features: (i) it has been derived from a non-redundant set of 85 RNA structures; (ii) it has geometrical descriptors that explicitly account for base pairing and base stacking interactions, both being important features that contribute to the thermodynamic stability of native RNA structures; (iii) it is a detailed full-atom potential that includes a representation for local and non-local interactions in RNA structures; and (iv) some of its key parameters have been optimized by calculating information theory measures in the same set of native structures used to derive the potential and not from a specific benchmark that may introduce some bias in the optimization process (Ferrada and Melo, 2009; Solis and Rackovsky, 2006, 2008). Moreover, we have built a new and independent set of RNA structures, which was used to benchmark the performance of RASP through the use of a jackknife procedure. Our full-atom RASP potential was validated against other simpler and coarse-grained RASP potentials, which were derived by using common parameters, optimized with the same set of RNA structures and tested in the same benchmarks. Finally, the RASP potentials were also compared against the NAST and ROSSETTA potentials, as well as the AMBER99 force field.
We begin this article by describing a new benchmark set of RNA structures that was used by us to test the RASP, as well as to optimize its parameters. We continue by showing the results of the optimized potential scores in model ranking and accuracy correlation tests. Next, we illustrate some energy score functions of the RASP potential accounting for base pairing and base stacking interactions. We continue by describing the results of RASP at selecting near native models in a real RNA modeling scenario, by assessing its performance at selecting accurate models in a dataset of hundreds of 3D models of 32 RNA motifs with non-canonical base pairs. Finally, we apply RASP to study the effects of mutations (including compensatory mutations) in the self-splicing group I intron of Azoarcus pre-tRNAIle and in the stem-loop IIIc of an internal ribosome entry site (IRES) element from the hepatitis C virus (HCV).
2 METHODS
2.1 Experimental RNA structures dataset
All crystallographic RNA structures deposited in the PDB (April 2009) were collected and then filtered by removing structures shorter than 20 nucleotides and solved at resolutions <3.5 Å. In a second step, the remaining structures were clustered using the BLASTN program with default options except for not filtering short alignments (Altschul et al., 1997). All redundant RNA structures that aligned at least 80% of their sequences with sequence identities >95% were removed. Finally, the remaining structures were also filtered to remove any structure that formed base pairs between non-connected chains as calculated by the 3DNA program (Lu and Olson, 2003, 2008). After applying these filters, the final dataset contained 85 structural RNA chains, which were used to calculate the RASP variants described in this work (Supplementary Table S1). The list of PDB chain identifiers for each of the selected structures is available as Supplementary Material at: http://melolab.org/sup-mat.html.
2.2 Decoy sets
The RASP variants have been tested using the randstr decoy set, which was obtained by generating from the 85 native structures a set of Gaussian restraints for dihedral angles and atom distances. We used eight RNA dihedral angles (α, β, γ, δ, ξ, ζ for the nucleotide backbone, ν2 for the sugar ring and χ for the base) and two pseudo dihedral angles (θ, η). In addition, distance restraints were calculated considering all the intra-nucleotide backbone atom (P, O5′, C5′, C4′, C3′, O3′) pairs <15 Å and all the intra-nucleotide base atom pairs <10 Å. For each native RNA structure, a set of 500 decoy structures was built by randomly removing an increasing fraction of constraints generated from the native RNA structure. To explore the space of alternative RNA conformations, the probability threshold to remove a given structural restraint was decreased using an exponential decay function. Each decoy was built using the MODELLER computer program (Sali and Blundell, 1993) using a subset of restraints as Gaussian potentials. The standard deviation values for the Gaussian energy functions were set to π/4 for dihedral restraints and 0.5 Å for atomic distance restraints. The set of decoys of RNA structures and sequences are available as supplementary data at: http://melolab.org/sup-mat.html.
Additionally, a benchmark dataset containing hundreds of 3D RNA models (Das et al., 2010) was used in this work to test RASP potential in a real RNA structure prediction scenario. The benchmark set contains 407 structure models for 32 different RNA motifs containing non-canonical base pairs. These structure models correspond to the five lowest energy clusters obtained with FARFAR force field from ROSETTA (Das et al., 2010). This dataset was downloaded from the Das Group Web site at: http://www.stanford.edu/∼rhiju/data.html.
2.3 The RASP variants
Four different knowledge-based potentials were calculated (Supplementary Table S1). The main difference between them was the number and type of atoms used to represent a RNA nucleotide. A detailed description of the calculation and the optimization of the knowledge-based potentials, and also the accuracy measures used to test their performance are provided as Supplementary Material. For all RASP variants, the computer software takes as input a single chain RNA structure in PDB format and outputs a RASP score profile, the total score and the total number of interactions that contributed to it. The total RASP score is the sum of the individual scores of all interactions found within an RNA molecule. In the tests reported here for RASP, the total normalized score was used, which corresponds to the total score divided by the total number of interactions that contributed to that score. In the case of the mutant examples (see section 3.5), the total raw score was used. Finally, it is important to mention that, to avoid biases in the benchmark results, a jackknife procedure was always used when assessing a RASP potential. Such procedure implied the removal of the structure being evaluated from the set used to derive the potential. Thus, 85 different potentials were calculated for each of the four RASP variants assessed (i.e. a total of 340 potentials).
2.4 Other tested RNA potentials
The AMBER (Wang et al., 2000) pseudo-energies were calculated after a minimization procedure of 500 ps using the GROMACS package (Van Der Spoel et al., 2005). The minimizations were performed using implicit solvent models represented by generalized Born formalism. The Born radii were calculated using the Still algorithm (Qui et al., 1997). All simulation parameters in GROMACS were selected by default except for emtol, emstep and nstcgsteep that have been set to 10−5, 10−1 and 103, respectively. ROSETTA (Das et al., 2010) was used with and without a few steps of energy minimization based on a computer script provided by the authors. NAST (Jonikas et al., 2009) and RASP variants were used to calculate the energy score of the decoys without any modification of their original conformations.
3 RESULTS
3.1 Calculation and optimization of the potentials
To assess whether RASP accuracy was dependent on its resolution, we calculated four different statistical potentials, ranging from coarse-grained descriptions to a full-atom potential (Supplementary Table S1). Such dependency, known to affect statistical potentials derived from protein structures (Melo and Feytmans, 1997; Melo and Marti-Renom, 2006; Melo et al., 2002), is relevant when a small number of non-redundant RNA structures is available (i.e. only 85 structures). It is important to note that for deriving a statistical potential, the total number of distinct particles or atom types increases linearly, but the size of the pairwise interaction matrix increases quadratically. Such effect quickly leads to sparse data and poor statistics when using a finite data source. Therefore, in addition to the full-atom potential (named RASP-ALL) representing each nucleotide with all its non-hydrogen atoms (Supplementary Table S2 and Fig. S2), we also calculated the following three coarse-grained potentials (Supplementary Table S1): (i) RASP-C3, representing each nucleotide with its C3′ atom (Supplementary Table 3 and Fig. S3); (ii) RASP-BB, representing each nucleotide with its backbone atoms (Supplementary Table 3 and Fig. S4); and (iii) RASP-BBR, representing each nucleotide with its backbone and ribose atoms (Supplementary Table 3 and Fig. S5). All these RASP variants include the topological factor parameter k that is used to differentiate between local and non-local interactions by accounting for the sequence separation of the interacting atoms (Ferrada and Melo, 2007; Ferrada et al., 2007; Melo and Feytmans, 1998; Sippl, 1990). The selection and definition of the optimal sequence separation threshold for each potential was based on the information product values (Ferrada and Melo, 2009; Solis and Rackovsky, 2006, 2008) and defined as the value that caused an incremental information product gain smaller than 5% (Supplementary Material). The optimal sequence separation threshold for each of the four potentials was 8, 4, 4 and 5 for RASP-C3, RASP-BB, RASP-BBR and RASP-ALL, respectively (Supplementary Fig. S6). Each of the RASP potential variants was then derived and used with its corresponding optimal topological factor threshold value (Supplementary Table S1).
3.2 Accuracy of RASP variants
To evaluate the accuracy of RASP variants in identifying native RNA structures, we performed a leave-one-out or jackknife protocol consisting in removing a specific RNA structure from the benchmark dataset, recalculating the potential from the remaining 84 native RNA structures and then using it to assess the removed RNA structure. Thus, this procedure, which was repeated 85 times for each RASP potential, ensured that a specific potential was not biased towards the structure being evaluated. Using the randstr benchmark dataset, RASP-C3, RASP-BB, RASP-BBR, RASP-ALL, NAST, ROSETTA, ROSETTA_min (i.e. with a few energy minimization steps before calculating the final energy score) scored with the lowest energy 8, 35, 89, 93, 22, 62 and 85% of the native RNA structures, respectively (Supplementary Table S4). Their accuracy increased to 32, 78, 93, 95, 65, 75 and 100%, when the native RNA sequence/structure pair was ranked within the 10 lowest energy scores (Supplementary Table S4). The use of ROSETTA with few steps of energy minimization previous to the calculation of the final energy score (ROSETTAmin) resulted in an improvement over using it without the energy minimization steps (ROSETTA). Energy scores obtained with AMBER99 force field, after a few steps of energy minimization, correctly ranked 73 and 88% of the native structures with the top and top 10 energy scores, respectively (Supplementary Table S4).
To test whether the energy score of RASP potentials correlate with the observed structural deviation from the native conformation (Fig. 1), we calculated two structural deviation measures for each decoy model in the randstr benchmark set (C3′ RMSD and the GDT-TS after the optimal structure superposition of the model and the native structure). Energy scores obtained with RASP-BB, RASP-BBR and RASP-ALL potentials resulted in an average correlation of 0.82, 0.84, 0.89 with RMSD and 0.85, 0.88, 0.91 with GDT-TS, respectively. However, RASP-C3, NAST and ROSETTA energy scores resulted in an average correlation of 0.56, 0.43, 0.41 with RMSD and 0.57, 0.42, 0.43 with GDT-TS, respectively. As expected, ROSETTAmin resulted in higher correlation coefficients than ROSETTA (0.64 with RMSD and 0.68 with GDT-TS, respectively), but still below those obtained with the RASP potentials. AMBER99 energy scores, with a few steps of energy minimization, resulted in average correlation values of 0.48 and 0.49 with RMSD and GDT-TS measures, respectively (Fig. 1). The accuracy of RASP significantly increased when a higher resolution was used (i.e. larger number of atom types used to build the potential). The observed differences of the correlation coefficients between the different potentials were statistically significant in almost all cases (Supplementary Tables S5 and S6). The detailed correlation plots of all decoys for each of the 85 native RNA structures with RMSD and GDT-TS for all RASP variants are provided as Supplementary Data.
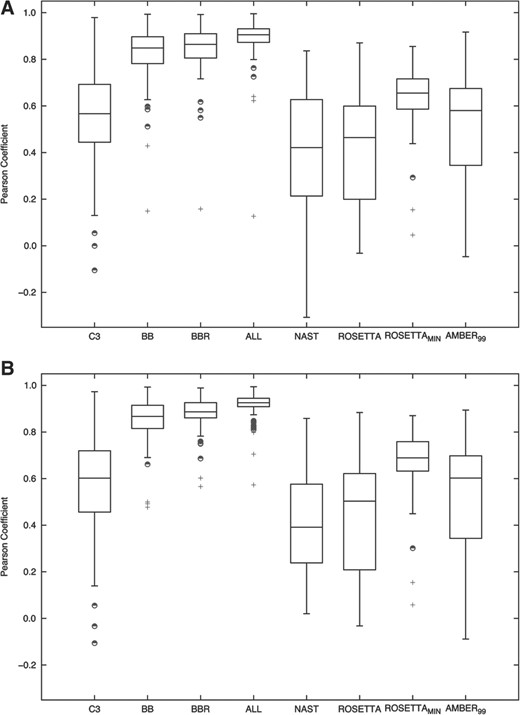
Correlation tests. Box and whisker plots illustrating the distribution of the Pearson's correlation coefficients for the potential scores and the structural deviation between the decoys and the native RNA structures in the randstr dataset. (A) Pearson correlation coefficient between energy scores and the RMSD of C3′ atoms. (B) Pearson correlation coefficient between energy scores and the GDT-TS of C3′ atoms. The central rectangle spans the first quartile to the third quartile (the interquartile range). The segment inside the rectangle indicates the median and ‘whiskers’ above and below the box indicate the locations of the boundaries after which outliers are defined. Outliers are represented by the ‘+’ symbol. Suspected outliers are shown as half-filled circles.
3.3 Implicit description of base pairing and base stacking geometry in potential energy functions
The AU and CG Watson–Crick base pairs and base stacking are the most common type of interactions in RNA structures and contribute to stabilize native conformations (Yang et al., 2003). Depending on the nucleotide type, different atoms can be involved. For example, in canonical Watson–Crick base pairs, the interactions between N1–N3 are observed for each base pair. Interactions between O2–O6 and O2–N6 are only observed for base pairs C–G and A–U, respectively. However, additional non-canonical base pairs can also be often observed in RNA structures (Gendron et al., 2001; Olson et al., 2009). These non-canonical base pairs include the G–U and U–U Wobble, G–A sheared, A–U Hoogsteen and G–A Watson–Crick. For example, in the G–U Wobble base pair hydrogen bonding occurs between N2–O4, O2–O6 and N1–N3.
Such interactions (canonical and non-canonical) are well captured by the RASP-ALL potential (Fig. 2). These main stabilizing base pair interactions result in energy score functions with a defined energy score minimum at about 2.7–2.9 Å. In addition to base pairing, the RASP-ALL potential also captures the underlying geometry that occurs at the base stacking of consecutive bases within a single RNA chain. In this case, the energy score minimum of a function that describes a typical atomic interaction that occurs in base stacking show a clear dependence on the topological factor parameter in the RASP-ALL potential (Fig. 2). That is, the distance at which the energy score minimum occurs periodically increases with the values of the topological factor parameter.
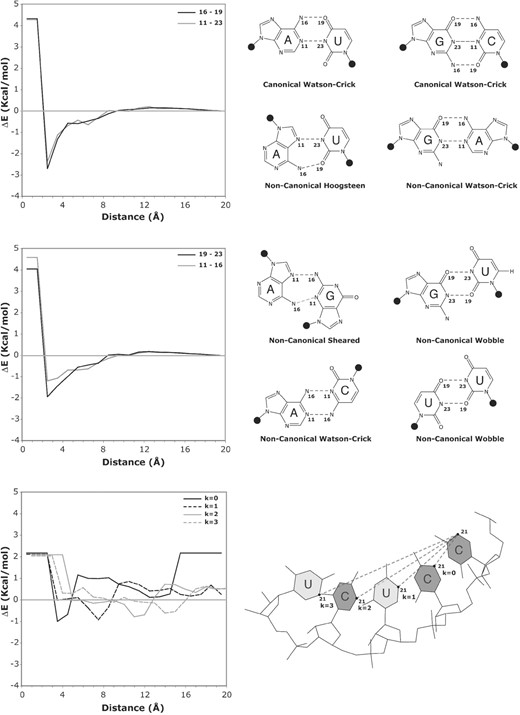
Example energy score functions of RASP-ALL potential. Pairs of interacting atom types are shown in the inset legend of the graphs. The type of interaction being described is graphically illustrated at the right side of each graph. Top Panel: hydrogen bonding energy score of base pairing geometry in canonical Watson–Crick pairs (A–U and C–G), non-canonical Hoogsteen base pairs (A–U) and non-canonical Watson–Crick A–G pair for non-local potentials (i.e. topological factor or k ≥ 6). Mid panel: hydrogen bonding energy score describing non-canonical base pairs such as Sheared (A–G), Wobble (G–U and U–U) and non-canonical Watson–Crick A–C pair for non-local potentials. Bottom panel: energy score for the interaction of atom types 21 versus 21 at different topological factors illustrating geometrical aspects of the base stacking in RNA.
3.4 Ranking near-native RNA models with non-canonical base pairs
A difficult and important challenge in current RNA structure prediction is the selection of near-native conformations that contain non-canonical base pairs (Das et al., 2010). To test whether RASP-ALL was capable of properly ranking near-native conformations of RNA motifs containing non-canonical base pairs, we used a recently published benchmark set of 407 structure models for 32 RNA motifs built with ROSETTA (Das et al., 2010). For each of the 407 RNA structure models, we calculated the total energy score with RASP-ALL and ROSETTAmin and selected the lowest energy score model according to each potential (Fig. 3; Supplementary Table S7). ROSETTAmin and RASP-ALL were able to accurately select the best model produced by ROSETTA in 1 and 7 RNA motifs, respectively. ROSETTAmin was able to select a more accurate model (i.e. with lower RMSD) than RASP-ALL in 13 out of the 32 motifs. Alternatively, RASP-ALL was able to select more accurate model than ROSETTAmin in 17 out of the 32 motifs. For two RNA motifs both scoring functions returned the same solution, which was structurally close to the best model generated by ROSETTA (Fig. 3; Supplementary Table S7). The calculated energy scores for each model in this benchmark set are available as Supplementary Material.
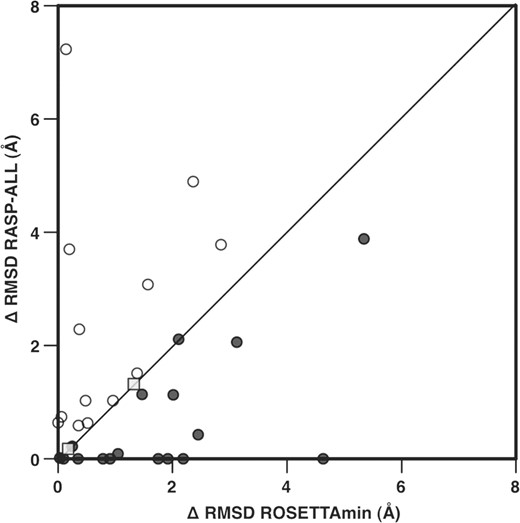
RMSD differences between the lowest energy score model by ROSETTAmin or RASP-ALL and the most accurate model in the dataset. The 17 cases below the diagonal (black dots) correspond to the cases where RASP-ALL selected a more accurate model compared to ROSETTAmin. The 13 cases above the diagonal (white dots) correspond to the cases where ROSETTAmin selected a more accurate model compared to RASP-ALL. In two cases (gray square) RASP-ALL and ROSETTAmin returned the same result.
3.5 Assessing the folding stability of RNA structures with RASP-ALL potential
The discovery of the RNA self-splicing group I intron provided the first example of a non-protein molecule with enzymatic activity (Kruger et al., 1982). Recently, the self-splicing group I intron in Azoarcus pre-tRNAIle was studied by perturbing its tertiary interactions with site-directed mutagenesis (Chauhan and Woodson, 2008). In particular, the tetraloop-receptor interactions bridging two major helical domains were destabilized with the A190U (GUAA) and A190U/A191G (GUGA) mutants, which affected the interaction with the J5/5a region. Non-denaturing gel electrophoresis experiments demonstrated that wild-type ribozyme (GAAA) folded with an intermediate state that migrated at the same speed than the native conformation. However, mutations introduced in the P9 region disfavored the formation of native-like intermediates and increased the conformation heterogeneity of the RNA population. Experimental data also showed that the GUGA mutant migrated slowly with respect to GUAA mutant (Chauhan and Woodson, 2008). We have applied RASP-ALL potential to the analysis of the effect that a point mutation could have in the structure stability of this self-splicing group I intron (Table 1).
Assessment of folding stability of RNA structures
| RNA molecule | Mutant phenotype | Mutant description | Energy score (kT units) | Energy score differencea (kT units) | Relative translationb (%) | Data source |
|---|---|---|---|---|---|---|
| Pre-tRNAIle | – | Wild-type | −95514.9 | – | – | Adams et al., 2004 |
| Pre-tRNAIle | Destabilizing | A190U | −95247.5 | 267.4 | – | Chauhan and Woodson, 2008 |
| Pre-tRNAIle | Destabilizing | A190U/A191G | −95282.7 | 232.2 | – | |
| Pre-tRNAIle | Compensatory | C146A/G164U | −95470.3 | 44.6 | – | Costa and Michel, 1997 |
| Pre-tRNAIle | Compensatory | C146G/G164U | −95614.1 | −99.2 | – | |
| Pre-tRNAIle | Compensatory | C146U/G164A | −95427.4 | 87.5 | – | |
| Pre-tRNAIle | Compensatory | G151A/U160A | −95479.0 | 35.9 | – | |
| Pre-tRNAIle | Compensatory | G151A/U160C | −95417.2 | 97.7 | – | |
| HCV-IIIc-loop-IRES | – | Wild-type | −1998.3 | – | 100 | Rijnbrand et al., 2004 |
| HCV-IIIc-loop-IRES | Increased activity | G3A-C8U | −1967.3 | 31.1 | 115 | |
| HCV-IIIc-loop-IRES | Increased activity | C4U-G7A | −2151.2 | −152.9 | 140 | |
| HCV-IIIc-loop-IRES | Increased activity | C4A-G7U | −2147.9 | −149.6 | 140 | |
| HCV-IIIc-loop-IRES | Increased activity | G5A | −2117.6 | −119.3 | 110 | |
| HCV-IIIc-loop-IRES | Increased activity | U6A | −2266.4 | −268.0 | 150 |
aThe total RASP-ALL energy score of the wild-type structure was subtracted from the total energy score of the mutant.
bThese values were extracted from Figures 7B, C and D in Rijnbrand et al., 2004.
The 3D structure of the ribozyme from Azoarcus was solved with a resolution of 3.1 Å (Adams et al., 2004) and was used here as template to model the 3D structures of the studied mutants using the MODELLER program (Sali and Blundell, 1993). The RASP-ALL profiles for the whole structure differed only in the mutated region (P9 loop) as well as other interacting loops (i.e. J5/5a loop). GUAA and GUGA mutants resulted in higher RASP scores. The wild-type structure resulted in difference of the total energy score of 267 and 232 kT units for GUAA and GUGA mutants, respectively (Table 1). Such differences did not only account for the contribution of the region mutated but also for the interacting J5/5a region.
To discard the possibility that the increased RASP energy scores observed in the GUGA and GUAA mutants were a direct consequence of modeling artifacts, we decided to build five additional models of the pre-tRNA-Ile molecule including known compensatory mutations (Costa and Michel, 1997) in the P8 region of the pre-tRNA-Ile molecule (Adams et al., 2004). The selected compensatory mutations were observed with a high frequency after several rounds of in vitro selection (Costa and Michel, 1997) and corresponded to: C146A/G164U, C146G/G164U, C146U/G164A, G151A/U160A and G151A/U160C. RASP-ALL energy scores obtained for these compensatory mutants show that C146G/G164U mutant was stabilized by ∼99 kT units compared to the wild-type (Table 1). The other four mutants have energy scores higher than the wild-type, but in the range between ∼45 and ∼98 kT units. Thus, the magnitude of these energy differences was between 2.4 and 6.0 folds smaller than those observed for the GUGA and GUAA mutants described above (Table 1). Altogether, the results indicate that the RASP-ALL energy scores for the GUGA and GUAA mutants are not simply a direct consequence of structure modeling artifacts.
Finally, the accuracy of the RASP-ALL potential was assessed using the stem-loop IIIc from the IRESs found in HCV. The 3D structure of the IRES (PDB code 1IDV) has been previously solved by Nucleic Magnetic Resonance spectroscopy (Rijnbrand et al., 2004). In the absence of any other canonical translation factors, the IRES binds to both the 40S ribosomal subunit and the eukaryotic initiation factor 3 (Kieft et al., 2001). Thus, the functionally of IRES can be easily tested through in vitro translational assays using bicistronic RNA encoding reporter elements. Five mutants of IRES element with higher translational activity compared to the wild-type sequence have also been characterized (Rijnbrand et al., 2004). These mutants are: G3A-C8U, C4U-G7A, C4A-G7U, G5A and U6A. Translational activity of the IRES element is conditioned to the stability of its loop IIIc. We have used the MODELLER program to build the 3D structures of the five described mutants, which were assessed by the RASP-ALL potential (Table 1). The assessment of the C4U-G7A, C4A-G7U, G5A and U6A mutations resulted in more favorable RASP-ALL energy scores ranging 119–268 kT of increased stability. Only one mutant (G3A-C8U) resulted in a structure with less favorable RASP-ALL energies (∼31 kT units).
4 DISCUSSION
To date, few computational tools have been developed and are freely available to assess the accuracy of RNA structures. Among those, the NAST (Jonikas et al., 2009) and ROSETTA (Das et al., 2010) tools were recently developed and have proven to be useful in the assessment and prediction of RNA 3D structures. In this work we have developed a new knowledge-based potential by using a list of 85 non-redundant experimental RNA structures. Despite the limited number and size of currently known experimental RNA structures, our potential called RASP was able to accurately discriminate between near-native and misfolded RNA structures.
RASP has several unique features that can render it as a complementary tool to the existing ones. RASP has been optimized by means of information product maximization, a single measure that has strong support from the field of information theory. As it has been previously demonstrated, this strategy allows for an elegant and unbiased optimization of knowledge-based potentials (Ferrada and Melo, 2009; Solis and Rackovsky, 2000, 2002, 2006, 2008). RASP inherits key parameters that have proven to be successful in the related field of protein structure assessment and prediction (Ferrada and Melo, 2007; Ferrada et al., 2007; Melo and Feytmans, 1997; Melo et al., 2002; Sippl, 1990, 1993a, 1995). These parameters are the distance-dependent geometrical descriptions for atom pairs in a molecule (Melo et al., 2002; Sippl, 1990), the topological factor or sequence separation to split local from non-local interactions (Melo and Feytmans, 1997; Melo et al., 2002; Sippl, 1990, 1996) and the use of properly defined atom types to reduce the matrix size and avoid sparse data (Melo and Feytmans, 1997; Melo and Marti-Renom, 2006; Melo et al., 2002). In addition to this, RASP has been calculated from a dataset of experimental structures that is larger and more diverse than those used in previous efforts. Our RNA structure dataset is representative of the currently known RNA structural space, as highly redundant structures have been removed from the final dataset. RASP describes the geometrical restraints that naturally arise in base pair formation through hydrogen bonding and base stacking through π–π interactions (Lu and Olson, 2003, 2008; Zheng et al., 2009). More importantly, RASP not only describes the canonical Watson–Crick base pairs, but also the non-canonical pairs that are highly abundant in native RNA structures (Olson et al., 2009). Moreover, the RASP scores were highly correlated with the structural deviation from native conformations. It is expected that as more non-redundant RNA structures become available, the accuracy and performance of a potential such as RASP will improve. Meanwhile, RASP can assist the accuracy evaluation of predicted RNA structure models by computer-based techniques as well as in assessing the quality of experimental RNA structures, as demonstrated by the three real-case examples analyzed here.
Despite of the important features described above, the current version of RASP has limitations that need further improvements. For example, the incorporation of a solvation term would allow for a more accurate description of the energy in highly unfolded and non-compact RNA conformations. In the case of proteins, this term clearly contributes to improve the performance of knowledge-based potentials in the assessment and prediction of 3D structures (Melo and Feytmans, 1998; Melo and Sali, 2007; Melo et al., 2002; Sippl, 1993a, b). Additionally, deriving RASP from a larger and more diverse set of RNA structures would likely result in a more accurate knowledge-based potential, as it has also been demonstrated for proteins (Melo and Feytmans, 2008; Melo et al., 2002). Unfortunately, experimental difficulties for working with RNA using either X-Ray crystallography or nuclear magnetic resonance spectroscopy have resulted so far in a limited number of determined structures.
Although with outlined limitations, the results obtained here using two different benchmarks demonstrate that RASP still is a competitive potential when compared to NAST, ROSETTA and AMBER force fields. Future improvements of RASP will certainly attempt to overcome the two drawbacks mentioned above, as well as the ability to perform energy score minimizations with this potential function. The results obtained here with ROSETTA force field have clearly demonstrated how important it is to perform a few steps of energy minimization prior to calculate the final energy score of the structure.
It is important to note that we have benchmarked the RASP, NAST, ROSETTA and AMBER scoring functions using a non-redundant (at 95% sequence identity) dataset of RNA structures. Unfortunately, using a more strict sequence identity cut-off resulted in the removal of a very large number of RNA structures, which made the derivation of a knowledge-based statistical potential impractical. We recognize that such limitation could have an impact in the benchmark sets used to test the performance of the potentials. Even if a jackknife method was used for all testing, it is still possible that a small bias towards the RASP potential could exist. Unfortunately, the current spectrum of known RNA structures is limited and any new development of tools for RNA structure prediction and assessment based on the existing experimental data would also suffer from such biases. Therefore, we would like to state that the performance comparison of RASP with ROSETTA and NAST in the randstr dataset should be considered with caution. Nevertheless, we trust that the particularities of RASP make it a complementary method to be used in combination with ROSETTA and NAST for the assessment of RNA structures. Moreover, we expect that the development of new assessment tools will contribute to a further development of the field.
As for protein structure prediction, RNA structure prediction faces two main challenges: (i) the ability of generating near-native conformations (sampling); and (ii) the ability of selecting the conformation closest to the native structure (scoring). Recent work carried out with the ROSETTA force field has demonstrated that good sampling of native like conformations can be achieved for a large number of cases (Das and Baker, 2007; Das et al., 2010). However, there were a limited number of cases where accurate predictions were not possible because the scoring function failed to detect near-native conformations that were indeed generated or sampled (Das et al., 2010). Here we have shown that RASP was able to select more accurate models than FARFAR force field in a dataset generated by ROSETTA (Fig. 3; Supplementary Table S7). Therefore, it is clear that RASP constitutes a useful tool, which is complementary to existing tools, for the assessment and prediction of RNA structures.
In summary, in this work we have focused in developing a new knowledge-based potential for addressing the scoring challenge. Despite its current limitations, RASP can prove useful not only to developers of RNA prediction methods but also to end-users who drive their research upon RNA-predicted 3D models.
ACKNOWLEDGEMENTS
We are very grateful to Dr Magdalena Jonikas and Dr Rhiju Das for kindly sending us the required computer scripts to use the NAST and ROSETTA software, respectively. We are also grateful to Dr Kai Kohlhoff for his help running the energy minimization of the models using GROMACS.
Funding: E.C. acknowledges support from the European Community (Marie Curie International Outgoing Fellowship PIOF-GA-2009-237225). T.N. acknowledges a PhD fellowship from Comision Nacional de Investigacion Cientifica y Tecnologica de Chile (CONICYT). M.A.M.-R. acknowledges support from the Spanish Ministerio de Ciencia e Innovación (BIO2007/66670 and BFU2010/19310). F.M. acknowledges support from the Fondo Nacional de Desarrollo Cientifico y Tecnologico de Chile (FONDECYT 1080158).
Conflict of Interest: none declared.
REFERENCES
Author notes
†The authors wish it to be known that, in their opinion, the first two authors should be regarded as joint First Authors.
‡Present address: Department of Bioengineering, Stanford University, 318 Campus Drive Room S240, Palo Alto, 94305 CA, USA and Department of Mathematics and Computer Sciences, University of Balearic Islands, Ctra. Valldemossa Km 7.5, 07122 Palma de Mallorca, Spain.
Associate Editor: Ivo Hofacker

