


Abstract
Motivation: Business Architecture Models (BAMs) describe what a business does, who performs the activities, where and when activities are performed, how activities are accomplished and which data are present. The purpose of a BAM is to provide a common resource for understanding business functions and requirements and to guide software development. The cancer Biomedical Informatics Grid (caBIG®) Life Science BAM (LS BAM) provides a shared understanding of the vocabulary, goals and processes that are common in the business of LS research.
Results: LS BAM 1.1 includes 90 goals and 61 people and groups within Use Case and Activity Unified Modeling Language (UML) Diagrams. Here we report on the model's current release, LS BAM 1.1, its utility and usage, and plans for future use and continuing development for future releases.
Availability and Implementation: The LS BAM is freely available as UML, PDF and HTML (https://wiki.nci.nih.gov/x/OFNyAQ).
Contact: [email protected]; [email protected]
Supplementary information: Supplementary data) are avaliable at Bioinformatics online.
1 INTRODUCTION
Business Architecture is defined as a ‘blueprint of the enterprise that provides a common understanding of [an] organization and is used to align strategic objectives and tactical demands’ (Object Management Group, 2010). It provides clear, concise descriptions of what an enterprise does (its business capabilities), who performs the activities within the enterprise (organizational hierarchy and governance structures), how activities are accomplished (business processes), which data are present within the enterprise (business knowledge) and where activities and processes occur. These characterizations are documented within business models, such as Use Case (descriptions of goals), Activity and Class Diagrams (The Open Group, 2007), each of which provides a different view of the enterprise. Business models can be used to (i) identify gaps, dependencies or redundancies in personnel, procedures and software; (ii) standardize how enterprises operate and train people who lack domain expertise; (iii) define business rules and logic; and (iv) prioritize business goals and match business priorities with information technology solutions (International Institute for Business Analysis, 2010). Due to these and other benefits, the models have been successfully used within domains as diverse as accounting (McCarthy, 1982), information technology (Arraj, 2010), food service (Hammer and Champy, 2001), supply chain management (Poluha, 2007) and telecommunications (Kelly, 2003).These domains have robust, mature processes supporting software requirements gathering and development efforts that can be leveraged by informatics teams within the biomedical domain. Indeed, international standards bodies such as the Clinical Data Interchange Standards Consortium (CDISC) and HealthLevel7 (El Fadly et al., 2007; Fridsma et al., 2008) and the federal government, including the National Cancer Institute (NCI; United States Federal Government, 2007) have begun adopting the models to support their informatics efforts for life sciences (LSs) and clinical research (CR).
The community of researchers, clinicians, vendors and patient advocates taking part in the NCI caBIG® initiative is developing a standards-based informatics framework with the goal of establishing a shared and standardized infrastructure that will facilitate software interoperability. Platform-independent interoperability (i.e. software communication independent of operating system and computer language) is crucial to creating a collaborative information network driving the exchange of data regardless of who collected them or how they are stored. Such interoperability will help accelerate the discovery of new approaches for cancer diagnostics, detection and therapeutics. Biomedical data sharing is widely held as a key component to accelerate scientific progress, reduce costs and decrease the time to move discoveries from the bench to the bedside (Piwowar et al., 2008), thus paving the way to the discovery of new approaches for diagnostics, detection and therapeutics. To exchange data between independently built systems, cancer research software must utilize common semantics to combat ambiguity. Data elements must have precise meanings, conveyed by standard terminologies, and must be set in the context of well-described research processes to define how the software should function, what data should be collected and when and with whom these data can be shared.
Business models can support and facilitate the goal of software interoperability by providing a standard context describing LS research goals and activities. To this end, members of the caBIG LS community have developed the LS Business Architecture Model (LS BAM). The LS research domain encompasses hypothesis and discovery-based basic and pre-CR spanning disciplines that include genetics, biochemistry, cell and molecular biology and bioinformatics. LS research is aimed at understanding biological mechanisms, processes and disease states; discovering disease biomarkers and potential drug targets; and facilitating translational research. The LS BAM documents the people, organizations, goals and processes that are part of the LS research domain enterprise through use cases (Fig. 1) and actors. Use cases are textual descriptions of tasks that are performed to achieve specific goals, while actors are the entities that carry out or are otherwise associated with the goals defined in the use cases. Actors can be individuals (e.g. principal investigators or graduate students), groups or committees (e.g. the Institutional Review Board or Core Facilities) or entire institutions. The model is composed of a Use Case Diagram, which depicts the compositional relationship between use cases, and Activity Diagrams, which logically order use cases and actors. The LS BAM describes goals that are common to all LS research sub-domains, including how LS research is planned and performed; the organizations, resources and methodologies involved; how data and materials are controlled and analyzed; and how outputs are disseminated. The model provides a framework for understanding the business of LS research through a common set of LS use cases and vocabulary that, when used to define requirements for information systems supporting LS work, will facilitate data exchange and integration. The LS BAM may further be useful for staff training, standards development and software validation for software development efforts in the public and private sectors. Here we report on the model's current release [LS BAM 1.1; Use Case Unified Modeling Language (UML) Model, PDF and Internet Explorer Viewer (https://wiki.nci.nih.gov/x/OFNyAQ), Activity Diagram), its real world applications, and plans for its usage, continuing development and integration with other models to create a Translational Medicine BAM. The caBIG community welcomes feedback on this model (http://bit.ly/9DYSX1).
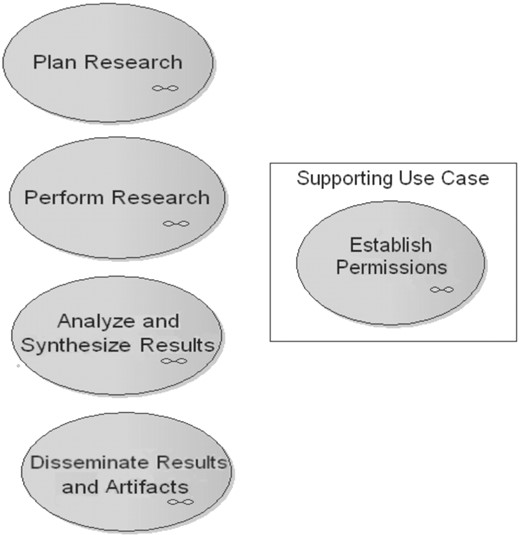
caBIG LS BAM 1.1 Use Case Diagram: Top level and supporting Use Case detail. LS research activities are decomposed in a top-down approach; this UML Use Case Diagram subset shows the four most general use cases, as ovals, that represent the activities that life scientists undertake. One supporting use case, which can occur at the enterprise level of an organization or within subdivisions of the enterprise, is shown in the inset. The small icon in the bottom right corner of the use cases indicates that the use case is a composite, i.e. it has one or more child use cases.
2 METHODS
2.1 Model components
The LS BAM consists of use cases and the actors that perform them. They can be ordered to represent specific activities. Use cases are text descriptions of tasks that are performed to achieve specific goals. Each use case includes a background, storyboard describing all components of the goal, and itemized pre-conditions, basic flow of events, post-conditions and alternative conditions, should they exist (International Institute of Business Analysis, 2010). Actors and use cases are defined in a Use Case Diagram. Activity Diagrams model actors and necessary use cases from the Use Case Diagram in a logical order with defined decision points.
2.2 Development of the model
The Use Case Diagram of LS BAM 1.1 consists of 90 use cases and 61 actors. The LS BAM was created in over a year of twice to thrice weekly meetings. The first 9 months were spent on the 1.0 release and another 5 months for the current 1.1 release. To create these artifacts, the LS BAM Team iteratively decomposed LS research goals in a top–down fashion, such that use cases describing broad research goals were written first (‘parent’ use cases) and then each was deconstructed into finer-grained ‘child’ goals (e.g. Fig. 2 compares the top-level ‘parent’ use case with the second-tier ‘children’). Typically, child use cases were identified from the sub-goals within a storyboard and basic flow of events of parent use cases. Some additional child use cases were identified by reviewing the model for gaps in content. When this occurred, the parent use case was also reviewed to ensure that its text appropriately covered the newly identified child. A list of common LS research actors was created by the LS BAM development team and reviewed against the caBIG CR BAM (http://bit.ly/ihmpwO) for overlap.
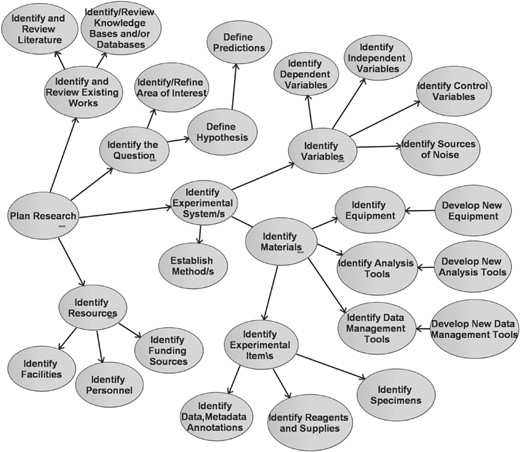
caBIG LS BAM 1.1 Use Case Diagram: Plan Research detail. This UML Use Case Diagram includes Plan Research and its 29 child use cases, as ovals, each of which are components of the goal to plan research.
Activity Diagrams typically document very specific activities and are created as areas of priority are identified. For LS BAM 1.1, an exemplar Activity Diagram was created to illustrate how these diagrams can be developed. Use cases and actors from the Use Case Diagram that were required to accomplish the selected activity were identified and placed in a logical order, with decision points and outcomes noted, using Microsoft Visio (Microsoft Corporation, Redmond, WA, USA).
Controlled vocabularies from the NCI's Enterprise Vocabulary Services [EVS, e.g. the NCI Thesaurus and Metathesaurus, (de Coronado et al., 2004; Haber et al., 2007) which include terms from caBIG, CDISC, Logical Observation Identifiers, Names and Codes (LOINC®), etc.] were utilized in the use cases and actors. A Vocabulary Task Group comprised of members of the LS BAM Development Team, NCI EVS group and other caBIG group members met to review the definitions identified by the BAM Team and to ensure terminological harmony between the LS BAM and other related models.
Text for each use case and actor was written in Microsoft Word (Microsoft Corporation, Redmond, WA, USA). The text was incorporated into UML diagrams with Enterprise Architect 7.1 (EA, Sparx Systems, Creswick, Victoria, Australia). UML and Word files were both utilized because they provided two different views on the model. The former was better for quick visualization of the use cases, actors and their inter-relationships, but was limited in that text cannot be viewed simultaneously for many use cases or actors. The latter was better for reviewing all use case and actor text for the model, and utilization of Word's global search capabilities further facilitates consistent use of key vocabulary.
2.3 Vetting the model
A multidisciplinary group of experts with diverse LS experience in areas such as basic and translational research, business analysis and informatics at academic, government and industrial organizations was assembled to develop the LS BAM (Supplementary Table S1). This group was divided into two teams, designated the small and large teams. Both teams were composed of subject matter experts from across various disciplines and an LS business analyst. The large team consisted of all small team members with additional subject matter experts, a program manager and a representative from the NCI. The small team met twice a week via web conference to identify and prioritize LS use cases and actors, create artifacts, and review and vet the work. The large team met every 2 weeks to review and critique the work of the small team. As the large team vetted subsections of the LS BAM, they were released for review by members of the LS community, including the caBIG Integrative Cancer Research and Tissue Banks and Pathology Tools Workspaces, which encompass domain and technical experts from NCI-Designated Cancer Centers, Medical Centers, the NCI and commercial vendors.
3 RESULTS
The LS BAM 1.1 contains a Use Case Diagram and an exemplar Activity Diagram. The Use Case UML consists of 90 use cases and 61 actors (https://wiki.nci.nih.gov/x/OFNyAQ). As part of future efforts, the actors will be integrated into the Use Case Diagrams. The LS BAM 1.1 Activity Diagram logically orders seven use cases into a workflow, associates three actors to the appropriate goals and is also available for download (http://bit.ly/bqySlv).
3.1 Use Case Diagram
3.1.1 Use Cases and Diagram Interpretation
Each use case (Figs 1 and 2), gives significant detail about an LS business goal through detailed storyboards, pre-conditions that must be met before use case can be started, basic flow of events for accomplishing the goal and post-conditions. Use cases often include a set of sub-goals in the basic flow of events that must be met as part of the major goal, and these sub goals can themselves be described in associated ‘child’ use cases. For example, the LS BAM 1.1 contains four general use case packages (Fig. 1), describing the major goals to: Each of these high-level use cases cascades to more ‘child’ use cases. The LS BAM is intentionally general enough to represent any LS research; therefore these goals remain very broad.
Plan Research;
Perform Research;
Analyze & Synthesize Results; and
Disseminate Results & Artifacts
The 29 child use cases of Plan Research describe more fine-grained goals such as ‘identification of the scientific question or hypothesis’ and ‘identification of the experimental systems, materials and resources that will be used to address the question’ (Fig. 2). The 28 children of Perform Research detail goals such as obtaining the materials and resources identified within the children of Plan Research, as well as those that are part of executing planned experiments. The seven children of Analyze & Synthesize Results provide descriptions of processing data, analyzing data and interpreting the analyzed results. Those 11 of Disseminate Results & Artifacts communicate details of annotating results, summarizing experimental findings, and sharing data and interpreted results through a variety of mechanisms (the term Artifacts refers to man-made materials such as data, materials or tools). The iterative nature of LS research is explicitly noted within the text of these child use cases and their parents. For example, activities performed as part of the goal Identify Resources, such as identifying grant funding sources, may shape what publications and other background information is reviewed in the use case Identify and Review Existing Works. Reciprocally, review of existing works may suggest new resources. The structure represented in the Use Case Diagram is not intended to convey any particular ordering of goals in a workflow. The hierarchy of use case relationships within the Use Case Diagram exists strictly for the organization of concepts and inheritance of properties from parent use cases.
3.1.2 Supporting Use Case
Certain functions in research might be considered ‘support’ functions that are necessary for a complete understanding of business process, but possibly spanning multiple higher level use cases and their children. These use cases describe goals most often relevant across an organization, but that may also occur within divisions or subdivisions of the organization. This is exemplified in Establish Permissions (Fig. 1, inset) where, for instance, permissions for human subjects research is managed by a single institution-wide Institutional Review Board and must be obtained prior to performing research, whereas a single department may regulate permission to publish the experimental findings.
3.1.3 Actors
Actors identify and perform the work needed to accomplish various goals and can be individuals, systems, groups, committees or entire institutions. They are associated with use cases in Use Case and Activity Diagrams to explicitly define roles and responsibilities. Actors generically describe functional responsibilities of a person, group or institution, and their names may be, but are not necessarily, job titles or organization categories, such as Biostatistician or Vendor.
The LS BAM contains 61 actors grouped into three categories: Organizations, People and Systems. Twenty of these actors, such as a Principal Investigator and Research Laboratory, are generally applicable to biomedical research as a whole and are present within both the LS and CR BAMs. The other 41 actors are specific to the LS BAM, such as the actor Institutional Animal Care and Use Committee (IACUC). LS research has a strong training component, so actors also include Student/Trainee, with the children Undergraduate Student, Graduate Student and Postdoctoral Scholar. The actors have not yet been associated with the use cases of the Use Case Diagram of the LS BAM 1.1, but are available as part of the EA and PDF files (https://wiki.nci.nih.gov/x/OFNyAQ).
3.2 Activity Diagrams
While the LS BAM use cases and actors present common ‘building blocks,’ LS research actually is carried out as a series of specifically ordered goals. Activity Diagrams graphically illustrate the chronological and logical arrangement of these goals (using the use case pre-conditions, basic flow of events and post-conditions) performed by specific actors for the purpose of rendering a workflow. An exemplar Activity Diagram has been constructed for LS BAM 1.1 that represents a general workflow of identifying and obtaining archival human tissues for a research study (Fig. 3). It demonstrates how seven use cases (Train Personnel, Identify & Review Knowledge Bases and/or Databases, Identify Specimens, Establish Permissions, Obtain Specimens, Manage Specimens and Perform Research) and three actors (Researcher, Materials Oversight Committee and Technician) from the Use Case Diagram can be ordered and associated to document: (i) temporal relationships of tasks and decisions; (ii) points at which data are created/collected; and (iii) iterations or dependencies that may span a series of use cases. Activity Diagrams document very specific processes and not general goals, e.g. compare the specificity of a researcher identifying specimens available from specific tissue banks (Fig. 3, top right square in the dashed-line box), with the more general goal to Identify Specimens (Fig. 2). Select use cases from the Use Case Diagram can be implemented as a single Activity Diagram task, as in the example above and ‘Specimens are stored per local standard operating procedures (SOPs)’ (bottom of Fig. 3) mapping to the Manage Specimens use case. Multiple tasks can also be traced to a single use case, such as both ‘Specimens are received at a local bank’ and ‘Researcher retrieves and evaluates the specimens fit for purpose’ mapping to the use case Obtain Specimens. LS workflows tend to be diverse among different laboratories, and there are thousands of different types of LS methods that can be used in various combinations to achieve a scientific goal. It is not possible to document all possible LS activities or even to reduce the domain to a small number of generic practices represented as workflow diagrams. Instead, additional Activity Diagrams will be created as areas of priority are identified.
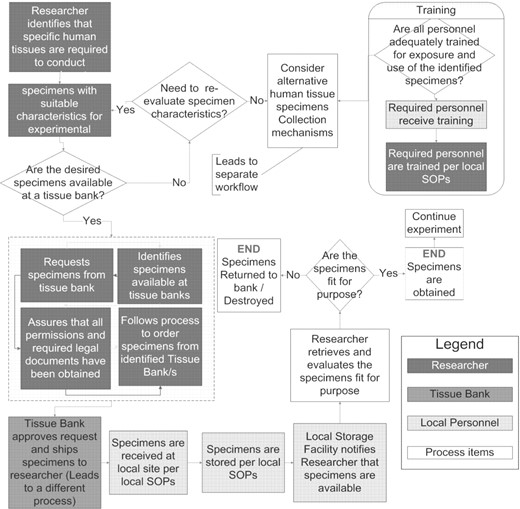
caBIG LS BAM 1.1 Exemplar Activity Diagram: Identifying and Obtaining Archival Human Tissue Biospecimens. The workflow of identifying and obtaining archival human tissue biospecimen is shown. Processes are represented as squares and decision points are triangles. Dark gray indicates tasks performed by the researcher, medium gray by the tissue bank, light gray by local personnel and white are general processes. The dashed-line box encapsulating four dark gray processes indicates that the order of these processes depends upon the policies of individual tissue banks, e.g. the research may be able to identify specific specimens or s/he may have to make a general request to the tissue bank, which will identify available specimens for the researcher.
4 DISCUSSION
The caBIG LS BAM 1.1 provides a blueprint of the business capabilities, business processes and business knowledge common to the LS domain. The scope of the LS BAM 1.1 Use Case Diagram was established such that it is not an exhaustive description of the details of all institutional governance structures or the business capabilities, processes and knowledge of each LS sub-domain, but rather those entities that are common across the LS domain. Indeed, if the goal of the LS BAM were to exhaustively describe all details of biomedical research, it could of course expand indefinitely. As areas of priority are identified by NCI governance teams for software development or other business needs, future LS BAM releases will be extended as required to meet these needs. Thus, the LS BAM should provide enough detail to meet the current informational needs of stakeholders by documenting goals common among all LS research with the anticipation of further use case decomposition as needed. Specific examples of how the LS BAM is currently being used for software development and requirements traceability are described below.
4.1 LS BAM and the caBIG LS Domain Analysis Model 1.1
The business processes described in a BAM also provide context for the development of information models, e.g. Class Diagrams. Class Diagrams present common representations of the data of a domain and their attributes, datatypes, permissible values and relationships. Workflows and references to data that are collected, exchanged, integrated or processed in the LS BAM Use Case and Activity Diagrams can be used to create a Class Diagram for an entire domain, such as the LS Domain Analysis Model (DAM). Information models for many different pieces of software supporting diverse LS sub-domains or workflows can be created from a single domain analysis model.
While the LS BAM provides a description of the business processes of the LS domain, the LS DAM provides a description of the data semantics of the LS domain and is traceable to the business capabilities and processes in the LS BAM. For example, the data class ExperimentalItem was created in the Domain Analysis Model to capture the BAM concept of experimental items, which are specialized study materials usually required to conduct an experiment and are logically distinct from general reagents and supplies, e.g. see ‘Identify Experimental Items’ (https://wiki.nci.nih.gov/x/OFNyAQ). As the LS BAM describes how one researcher's processed data may be another researcher's primary data, the existing LS DAM class, ProcessedData, was generalized to Data. In addition, classes and attributes in the Domain Analysis Model are being traced back to the BAM to provide a holistic representation of business processes and the data elements necessary to describe LS research concepts. As the LS BAM is a ‘living’ model, the LS DAM will continue to be updated as required as the LS BAM expands.
To create platform-independent interoperability among software systems, both data standards and a common business context must be applied. To this end, the LS DAM defines the data properties within its classes and attributes, and the LS BAM defines which of these data should be captured and exchanged, at what time and with whom. Conformance to these models can ensure some basic level of interoperability, as all services and applications will map to the standard use cases and classes. This conformance and interoperability can be validated using test conditions that validate that a given interface is conformant to the LS BAM and LS DAM specifications supporting a given LS scenario. For example, test scripts can be written to verify that a system's data model matches classes from the LS DAM, which are derived from use cases and actors from the LS BAM [see conformance statements in (http://bit.ly/dXkMXB)].
4.2 LS BAM, the Enterprise Conformance and Compliance Framework and the caBIO Molecular Annotation Service Reference Implementation
The caBIG initiative is adopting the HL7 Services Aware Interoperability Framework (SAIF) to support the development of semantically interoperable services. One SAIF component, the Enterprise Conformance and Compliance Framework (ECCF), provides software development teams with clear guidelines and a standard methodology to show compliance of the planned service to existing standards reference models such as the LS BAM and the LS DAM (http://bit.ly/abFyxP). The service use cases, processes and storyboards must be mapped to a standardized Use Case Diagram. For LS services these items are mapped to the LS BAM.
As a reference implementation of the ECCF, the LS BAM has been used in support of the development of a Molecular Annotations (MA) Service (http://bit.ly/ax0UWK) based on the caBIO (cancer Biomedical Informatics Objects). caBIO is an open-source object-oriented model and data resource that integrates biomedical annotations on genes, proteins, disease ontologies, pathways and other biological entities with controlled vocabularies and metadata models originating from 23 data sources (Covitz et al., 2003; Komatsoulis et al., 2008). The MA service allows programmers and scientists to quickly access biological annotations in a platform-independent fashion and is currently available as a pre-production resource. As part of their ECCF-compliant development process, the MA service development team created artifacts detailing the service specifications for three business use cases and mapped them to the four LS BAM 1.1 use cases: Characterize/Organize the Data, Integrate Data Sets, Annotate Findings/Results, and Identify and Review Knowledge Bases and/or Databases. For example, the service objective to obtain ‘information associated with molecular entities to assist in annotating findings/results’ maps to the LS BAM use case Annotate Findings/Results (Supplementary Table S2 illustrates how MA use cases map to those from the LS BAM).
4.3 LS BAM, caLIMSv2 and NCI Enterprise Services
The cancer Laboratory Information Management System (caLIMSv2) development team has also extensively used the LS BAM to facilitate the design of core aspects of their ongoing efforts to create an interoperable laboratory information management system (LIMS). caLIMSv2 is being developed as a configurable, open-source system that utilizes a set of services to manage a complete laboratory workflow. These services are designed to interoperate with biospecimen management and experimental results management services, such as those that are being implemented in caTissue and caArray, respectively. Core LIMS functions include the management of personnel, equipment, lab supplies, reagents, samples, workflows and experimentally derived metadata and data. The team reviewed the Use Case Diagram and utilized concepts such as equipment (Identify Equipment), facilities (Identify Facilities particularly core facilities), data and metadata (Obtain Data, Metadata and Annotations) and configuration of the experimental system (Configure Equipment and Configure Software Tools). In addition to the LS BAM use cases, the actors within the model were also of significant value to the creation of privilege-based roles for end users in the system. These actors included organizations such as Collaborative teams (Collaborators), Oversight Bodies [Institutional Review Board (IRB) and IACUC] and individual persons, such as Bioinformaticians, Statisticians and Students. caLIMSv2 developers also provided critical feedback to the LS BAM team, as during their review process they identified the need for use cases surrounding the management of data (Manage Data). Thus, the LS BAM was utilized to identify areas that were within the scope of a LIMS, but had not previously been included in a standardized way in caLIMSv2 development plans.
LS BAM is also being used to evaluate and identify NCI Enterprise Services (NES). The NES is a portfolio of software services that can be implemented in any LS application to facilitate interoperability. Services that have been implemented through the caBIG program include those that expose data for organizations, people, protocol abstraction and the correlation among these entities. Once core specifications were developed for the caLIMSv2 services, analysts reviewed the existing NES to determine if all concepts were present and found that some of the concepts that were taken from the LS BAM were missing in the Correlation of Organizations and Person services. The analysts took these findings back to the NCI Enterprise Architecture team, who are currently reviewing the feedback and may revise or create additional standard services. Using the LS BAM, the caLIMSv2 team was able to review the existing services within the NES portfolio to identify areas in which such services were needed.
4.4 Future directions
Efforts are underway to expand the LS BAM by creating additional Activity Diagrams for priority concerns in the areas of next generation sequencing, pathology and imaging, all areas of particular interest to the caBIG community. The LS BAM is one of several caBIG BAMs, including CR, population sciences, clinical information and patients involved in human subjects research. As there are significant areas of overlap and synergy of purpose among these BAMs, there are plans to integrate them to create a caBIG Translational Medicine BAM (Fig. 4). Coordinating the growth and expansion of the Translational Medicine BAM will be important to its sustainability; therefore, the governance processes are being developed to manage updating, expansion and maintenance of the BAMs in response to user feedback. A number of activities in LS BAM development and use have been identified for future work. The LS BAM use cases will be expanded in areas of priority, actors will be fully incorporated into the Use Case Diagram, and additional Activity Diagrams will be created for processes related capabilities critical to the caBIG community.
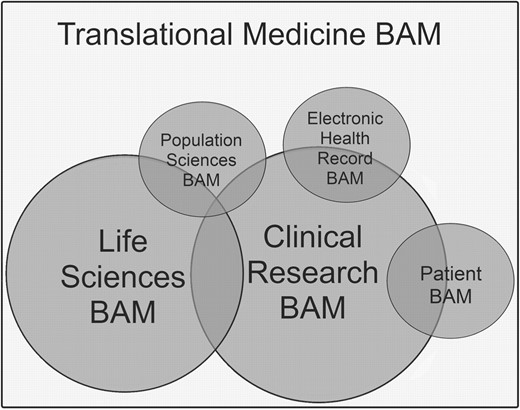
The Translational Medicine BAM—conceptual future vision. Currently there are two mature caBIG BAMs—a LSs research BAM and a CR BAM. Work has begun to create BAMs for population sciences, cancer electronic health records and patients involved in human subjects research (Patient BAM). The vision is that these individual models will eventually be integrated to form the Translational Medicine BAM (rectangle). Areas of synergy between goals documented within the various BAMs are represented by overlap. BAM circle circumference represents the current relative maturity and size of each model.
Mapping the LS BAM to the LS DAM will be a priority activity for the caBIG program and the SAIF ECCF governance process to promote semantic harmonization across business processes supported in the NCI inventory of services. Mapping existing caBIG software capabilities to the BAM is another area of possible activity to communicate where there is current tooling support and where there are gaps.
As the model continues to mature, its utilization will likely expand beyond informing NCI system requirements. Although it is not possible to predict all of the ways in which the model will be utilized, the CR BAM is likely a useful indicator for how the LS BAM will be used in the future, as it shares much of the same biomedical research-oriented target audience as the LS BAM. The Mayo Clinic is using the CR model to direct the development of functional requirements for the creation of software (Sharon Elcombe, personal communication). As the CR BAM provides clear descriptions of business processes, Wake Forest University uses the model as a training tool for those who are unfamiliar with CR actors, goals, processes and terminologies (Bob Morrell, personal communication). This usage can be particularly helpful for those in the role of business analyst, as the BAM can help identify the appropriate personnel with whom to speak and formulate questions. It is anticipated that the LS BAM and the overarching Translational Medicine BAM will be used in a similar manner.
To facilitate system interoperability across the cancer research enterprise, the LS BAM (and the LS DAM) can be used beyond caBIG to support their requirements definition efforts. Common business and information models provide a consistent understanding of business processes and data to be collected and exchanged, which should lower the barrier to interoperability. The model may therefore be a resource to train software engineers, facilitate development of standards and underpin software validation in many organizations, such as cancer centers, commercial tool providers or other large research institutions. To meet this goal, feedback from the community will be required to ensure that the LS BAM accurately models goals and activities of the LS domain; thus, members of the LS research community are asked to review the model, provide feedback and post questions (http://bit.ly/9DYSX1).
ACKNOWLEDGEMENTS
We thank Bob Morrell, Sharon Elcombe, Jason Hipp, Robert Freimuth and Konrad Rokicki for helpful discussions and advice.
Funding: Contracts from Booz Allen Hamilton on behalf of the National Cancer Institute as a part of the cancer Biomedical Informatics Grid (caBIG) Initiative Integrative Cancer Research Workspace.
Conflict of Interest: none declared.
REFERENCES
Author notes
Associate Editor: Martin Bishop

