


Abstract
Motivation: In current databases, there are many genes with inconsistent mapping positions between their cytogenetic annotations and sequence map positions. However, not all inconsistencies are the same. Some of them may be problematic which should be corrected in the future; while others may result from the imprecise nature of chromosomal banding which may be tolerable. It is important to stratify the cytogenetic position information into different confidence groups with the recognition of the impreciseness of cytogenetic banding.
Results: When plotting their cytogenetic annotations against sequence map positions on a 2D plane, the consistent genes tend to have a compact linear distribution; while genes with inconsistent positions are more scattered. The overlapping areas between these two groups are defined as the tolerable imprecision zones by linear regression and distance analysis. The system was implemented using sequence information from NCBI Map Viewer Build 36.3 and cytogenetic annotations from NCBI Entrez Gene. The genes' position information is classified into five confidence groups: inconsistent-intolerable, inconsistent-tolerable, consistent-imprecise, consistent-precise and consistent-rough. Using information from NCBI Map Viewer Build 36.3 and NCBI Entrez Gene, the percentages of these confidence groups are 1.4%, 7.0%, 54.0%, 35.4% and 2.2%, respectively. Using information from NCBI Map Viewer Build 36.3 and NCBI online Mendelian inheritance in man (OMIM), the percentages are 3.7%, 16.9%, 49.0%, 19.0% and 11.4%, respectively. Combining these two results, a confidence table of genes' position information was constructed.
Availability: The detailed results are accessible over the Internet at http://centrallab.hosp.ncku.edu.tw/imz.
Contact: [email protected]
1 INTRODUCTION
Cytogenetic annotation and sequence map are two different systems to determine the position of genes on human chromosomes. The cytogenetic annotations of many genes had been determined by fluorescence in situ hybridization (FISH) (Kirsch et al., 2000; Korenberg et al., 1999), which is a technique based on metaphase chromosomal preparations. Similarly, many disease-associated cytogenetic regions were determined by metaphase chromosomal techniques, such as G-banding, comparative genomic hybridization (Kallioniemi et al., 1992), and spectral karyotyping (Liyanage et al., 1996; Schrock et al., 1996). There is a lot of cytogenetic information in the public domain. For example, the Mitelman database of chromosome aberrations in cancer is a web-service that systematically collects disease-specific structural abnormalities (Mitelman and Heim, 1988; Mitelman et al., 2008), while the NCBI Entrez Gene is a comprehensive source for genes' cytogenetic locations (Maglott et al., 2005). NCBI online Mendelian inheritance in man (OMIM) (McKusick, 1998) is a catalog of human genes and genetic disorders. On the other hand, the human genome sequence provides precise positions of genes on chromosomes. The sequence mapping of genes is stored in the NCBI RefSeq database (Pruitt et al., 2005). NCBI Map Viewer is an alignment viewer designed to integrate feature identity information with whole-genome sequencing results (Wheeler et al., 2006). It is a comprehensive resource for the sequence map of genes based on RefSeq. Many disease-associated chromosomal regions were determined by sequence-based techniques, such as digital karyotyping (Wang et al., 2002) and array CGH (Davies et al., 2005, Solinas-Toldo et al., 1997). These techniques will give rise to very precise genome mapping and are gaining increasing popularities.
Since each system has its own value (large amount of existing information versus position preciseness), the integration of cytogenetic annotation and sequence map information would provide the most comprehensive solution for genome research (Furey and Haussler, 2003; Knutsen et al., 2005). Recently, a numerical transformation algorithm, designated as the cytoband query system (CQS), was developed to perform accurate cytobands searching using cytogenetic annotations (Yen et al., 2005). In an attempt to integrate CQS with the sequence map, we found much inconsistency between cytogenetic and sequence information. Such inconsistency had been reported in 2006 (Cuticchia et al., 2006). Using information from OMIM and Ensembl for the 6830 records with HUGO gene symbols, Cuticchia et al. found that the percentage of inconsistency is 18%. However, not all inconsistencies are the same. Some of them may be truly problematic, while others may result from the imprecise nature of human interpretation in chromosomal banding. Given the same FISH image, different researchers may assign a gene to different cytogenetic bands which are usually close to each other. It is not surprising to find genes annotated to different cytogenetic bands in different literatures. The difference does not dictate that one is correct while the other is wrong. It may reflect human imprecision rather than errors and therefore should be tolerated. The imprecise nature of human judgment needs to be considered when using cytogenetic information. In this study, a method to define the imprecision zone was developed and the result was stratified into five groups: inconsistent-intolerable, inconsistent-tolerable, consistent-precise, consistent-imprecise and consistent-rough. Such grouping provides a practical guide for genomic scientists to use cytogenetic annotations.
2 SYSTEM AND METHODS
2.1 The discordant gene pairs identified by positional order analysis
It is believed that a pair of genes' cytogenetic positional order conforms to their locations on the sequence map. That is, if gene A is before gene B on the sequence map then gene A must precede gene B in the cytogenetic annotation. However, many genes in current databases violate this intuitive positional parallelism. Table 1 shows four examples from the NCBI Map Viewer Homo sapiens build 36.3. In example 1 (Ex. 1), the sequence region of SKI (2149994, 2229316) is before ABCA4 (94230981, 94359293), but the cytogenetic annotation of SKI (1q22-q24) is after ABCA4 (1p22.1-p21). The other three examples in Table 1 are extracted from chromosome 2, 3 and 4, respectively.
Four examples of discordant gene pairs
| Ex. | Gene id | Gene name | seq_start | seq_stop | Cytoband |
|---|---|---|---|---|---|
| 1 | 6497 | SKI | 2149994 | 2229316 | 1q22-q24 |
| 24 | ABCA4 | 94230981 | 94359293 | 1p22.1-p21 | |
| 2 | 617 | BCS1L | 219232623 | 219236410 | 2q33 |
| 33 | ACADL | 210760959 | 210798392 | 2q34-q35 | |
| 3 | 5067 | CNTN3 | 74394412 | 74653033 | 3p26 |
| 30 | ACAA1 | 38139211 | 38153619 | 3p23-p22 | |
| 4 | 11275 | KLHL2 | 166348238 | 166463749 | 4q21.2 |
| 2243 | FGA | 155723730 | 155731347 | 4q28 |
Examples of position discordance between cytogenetic annotation and sequence map.
Figure 1 states the algorithm to find all discordant gene pairs by positional order analysis. This algorithm will be used throughout the system to ensure the consistency of genes' positions in the target set.
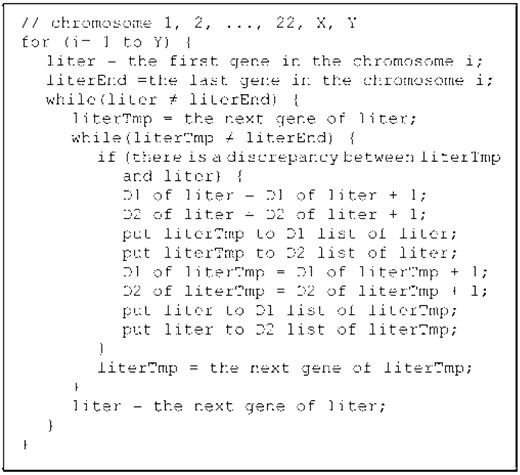
Algorithm to find all discordant pairs of genes in database.
However, discordant information does not look all the same. For example in Table 1, the cytogenetic annotation of SKI seems to be incorrect. Sequence map states that SKI is in the short arm of chromosome 1; but cytogenetic annotation locates the gene to the long arm. On the contrary in example 2, BCS1L and ACADL are next to each other in both sequence map and cytogenetic annotation. Such discordance seems to be tolerable, if taken into account the imprecise nature of cytogenetic banding.
2.2 The imprecise nature of cytogenetic banding
NCBI Entrez Gene and NCBI OMIM are two major resources of cytogenetic annotations. Many of the annotations are based on literature reviews. Since different researchers may assign a gene to different cytogenetic locations, the annotators of Entrez Gene and OMIM may select different literatures and annotate the gene to different cytobands accordingly. Indeed, there are quite a few discrepancies between Entrez Gene and OMIM. Table 2 shows some examples selected from chromosome 1. This demonstrates the imprecise nature of cytogenetic banding and annotation.
Examples of imprecise nature of cytogenetic banding
| Ex. | Gene id | Symbol | Entrez Gene | OMIM id | OMIM |
|---|---|---|---|---|---|
| 5 | 80263 | TRIM45 | 1p13.1 | 609318 | 1p22 |
| 6 | 10542 | HBXIP | 1p13.3 | 608521 | 1p13.2 |
| 7 | 2135 | EXTL2 | 1p21 | 602411 | 1p12-p11 |
| 8 | 5792 | PTPRF | 1p34 | 179590 | 1p32 |
| 9 | 8718 | TNFRSF25 | 1p36.2 | 603366 | 1p36.3 |
Examples of different cytogenetic annotations in NCBI Entrez Gene and NCBI OMIM for the same genes.
2.3 Mapping the cytogenetic annotation to sequence map
The method described in Section 2.1 offers an elegant way to find all positional discordance in databases without introducing any additional presumption other than the assumed positional parallelism between sequence map and cytogenetic annotation. However, this method cannot determine which gene causes the discordance in the gene pair. In order to analyze the level of consistency between each gene's cytogenetic annotation and its sequence position, we employ another strategy using the ideogram of NCBI Map Viewer Build 36.3 (ftp://ftp.ncbi.nlm.nih.gov/genomes/H_sapiens/mapview/ideogram.gz), which defines the positions of cytogenetic banding junctions on the sequence map. We use the junction information in the ideogram to transform cytogenetic annotations into sequence-start and sequence-stop positions on the sequence map. For example, Table 3 shows the mapping results of genes in Table 1. In example 1-1 (Ex. 1-1), the cytogenetic annotation of SKI (1q22-q24) is transformed into the sequence segment cyto2seq (153300000, 171200000), which does not overlap with the original sequence segment of SKI, seq (2149994, 2229316) derived from RefSeq. A gene with non-overlapping cyto2seq and seq segments would be regarded to have inconsistent information between cytogenetic annotation and sequence map. On the other hand, for ABCA4, its cyto2seq (92000000, 107000000) overlaps with seq (94230981, 94359293). Genes with overlapping cyto2seq and seq segments would be regarded as consistent.
Transform the cytogenetic annotation to the sequence map
| Ex. | Gene id | cyto2seq_start | cyto2seq_stop | seq_start | seq_stop |
|---|---|---|---|---|---|
| 1-1 | 6497 | 153300000 | 171200000 | 2149994 | 2229316 |
| 24 | 92000000 | 107000000 | 94230981 | 94359293 | |
| 2-1 | 617 | 197100000 | 209100000 | 219232623 | 219236410 |
| 33 | 209100000 | 221300000 | 210760959 | 210798392 | |
| 3-1 | 5067 | 1 | 8700000 | 74394412 | 74653033 |
| 30 | 30800000 | 43600000 | 38139211 | 38153619 | |
| 4-1 | 11275 | 79200000 | 87100000 | 166348238 | 166463749 |
| 2243 | 124000000 | 139500000 | 155723730 | 155731347 |
Examples of position discrepancies between the cytogenetic annotation and the sequence map. cyto2seq: the sequence segment transformed from cytogenetic annotation. Seq: the sequence segment derived from RefSeq.database.
2.4 Using cyto2seq and seq segments in the consistent set of genes to determine the positional trend of each chromosome
Let cyto2seq_cen be the center of cyto2seq segment of a gene and let seq_cen be the center of seq segment of a gene. We call (cyto2seq_cen, seq_cen) a position point of a gene on the X–Y plane. The consistent and inconsistent genes show different distribution patterns of their position points. For example, in Figure 2, the center position points of all genes in chromosome 1 are depicted. The consistent genes tend to have a compact linear distribution except for some outliers (Fig. 2A); while the inconsistent genes are more loosely distributed (Fig. 2B). We use the consistent genes to define the positional trend of each chromosome for further analysis. The positional trend for consistent genes, in theory, should be linear with a slope of 1 because the cyto2seq and seq segments are based on the same sequence map. We use least squares method to find the linear regression. The outliers in Figure 2A would be removed beforehand because they may cause errors in regression analysis. They are genes with rough cytogenetic annotations, which usually span over several cytobands, or even the whole-chromosomal arms.
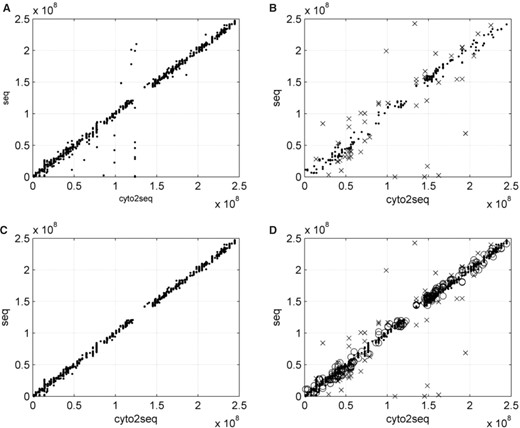
The position points of genes in chromosome 1 where x-axis is cyto2seq and y-axis is seq. All position points of consistent genes in chromosome 1 are shown in (A). (B) The inconsistent-tolerable (shown as ‘.’) and inconsistent-intolerable (shown as ‘x’) genes. (C) All position points of consistent-non-rough genes in chromosome 1. (D) All position points of consistent-non-rough (shown as ‘.’), inconsistent-tolerable (shown as ‘o’) and inconsistent-intolerable (shown as ‘x’) genes in chromosome 1. For genes in other chromosomes, please see Supplementary Material at http://centrallab.hosp.ncku.edu.tw/imz.
To further remove rough genes, we use the roughness of cytobands to set the cutoff criteria. For each chromosome, there are wider cytobands and narrower ones. The width (length) of cytobands can be calculated from the ideogram of NCBI Map Viewer. For each chromosome C, there are n cyto- bands in the ideogram on this chromosome. In addition to C, p-arm and q-arm, we sort all cytobands by their lengths and define the preceding 5% as rough bands. The number of rough cytobands is calculated by the equation: [floor(n×0.05)+3], where floor is a function which gets the next lowest integer value by rounding down (n×0.05) if necessary. A gene is considered to have a rough cytogenetic annotation when the length of its cyto2seq segment is greater than or equal to the minimum length of the rough cytobands on the same chromosome. Otherwise, the gene would be non-rough.Figure 2C shows all position points of consistent-non-rough genes (referred to as ‘non-rough’ in figures) in chromosome 1, which shows fewer noises with an obvious linear regression.

The slopes and intersects of all chromosomes
| Chromosome | Slope | Intersect | Chr | Slope | Intersect |
|---|---|---|---|---|---|
| 1 | 1.0038 | −288 399 | 13 | 1.0023 | −108 180 |
| 2 | 1.0021 | −369 914 | 14 | 0.999 | 457 936 |
| 3 | 1.0036 | −317 729 | 15 | 1.0042 | −253 520 |
| 4 | 1.0022 | 24 409 | 16 | 1.0035 | −415 309 |
| 5 | 1.0053 | −169 830 | 17 | 1.0138 | −644 569 |
| 6 | 1.0018 | −373 321 | 18 | 1.0109 | −276 035 |
| 7 | 1.0016 | −143 082 | 19 | 1.0091 | −208 275 |
| 8 | 1.0104 | −506 096 | 20 | 1.0184 | −597 812 |
| 9 | 1.0004 | −20 072 | 21 | 1.0067 | −692 491 |
| 10 | 1.0028 | −12 779 | 22 | 0.9577 | 1 328 787 |
| 11 | 1.0078 | −840 896 | X | 0.9999 | 289 892 |
| 12 | 0.9974 | 176 683 | Y | 1.0188 | 145 485 |
Linear regression of non-rough genes.
2.5 Defining the imprecision zone of each chromosome
The linear regression is used to define the imprecision zone. The distances of position points to the linear regression are calculated. The largest distance of consistent-non-rough genes will decide the outer limit of the imprecision zone. The smallest distance of inconsistent genes will determine the inner limit. The outer limit will divide the inconsistent genes into inconsistent-tolerable (IC-T) and inconsistent-intolerable (IC-IT). The inner limit will divide the consistent-non-rough into consistent-precise (C-P) and consistent-imprecise (C-IP). The width of the imprecision zone varies along the chromosomal length; therefore the imprecision-zone analysis should be performed in segments. We use the original landmark cytobands to divide the chromosome into regions for the analysis. These cytobands were chosen to be the landmarks to subdivide the p and q arms back in 1971 by a group of 50 human cytogenetic experts during the Fourth International Congress of Human Genetics held in Paris.
We use the region defined by the landmark cytobands as a default segment to find the imprecision zones. Every gene in a region has a distance from the regression line to its position.
Similarly, we can find the minimal distance (called MinD) of genes in the inconsistent group of each region. We use MinD to define the minimum boundary of an imprecision zone in each region. Consistent-non-rough genes whose distance are greater than or equal to MinD are called consistent-imprecise (C-IP) genes and whose distance are smaller than MinD are called consistent-precise (C-P).
Figure 3 shows the hierarchical structure of confidence groups of cytogenetic annotations. All genes in database have been classified into five groups: consistent-rough (C-R), C-P, C-IP, IC-T and IC-IT. The C-P group is most reliable; while the IC-IT group should contain a lot of erroneous data. The usability of C-IP and IC-T groups would be in-between C-P and IC-IT. The C-R group needs to be annotated more precisely in order to be useful.
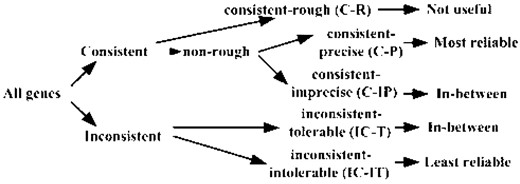
The hierarchical structure of confidence groups.
3 IMPLEMENTATION
The system flowchart is shown in Figure 4. Briefly, at data retrieval stage, the raw data of cytogenetic annotations and sequence map were downloaded from NCBI Entrez Gene (ftp://ftp.ncbi.nlm.nih.gov/gene/DATA/gene_info.gz), NCBI OMIM (ftp://ftp.ncbi.nlm.nih.gov/repository/OMIM/) and NCBI Map Viewer (ftp://ftp.ncbi.nlm.nih.gov/genomes/H_sapiens/mapview/seq_gene.md.gz). In the data preprocessing stage, cytogenetic annotations and sequence map information were integrated for each gene, ensuring that every gene in the target set will have both types of information. At the inconsistency finding stage, all genes with inconsistencies were separated from consistent genes.
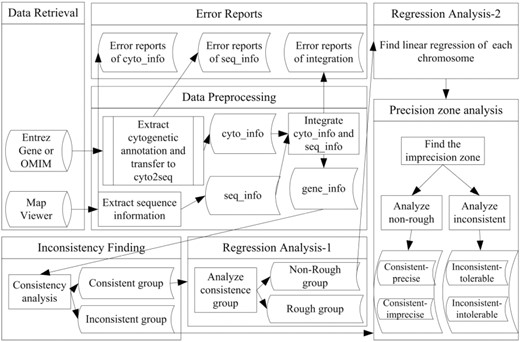
The system flowchart of finding imprecision zones of cytogenetic banding.
In the first step of regression analysis, the consistent genes were divided into C-R and non-rough groups by their cytogenetic annotations. In the second step of regression analysis, linear regression of each chromosome was calculated. The final stage is the precision zone analysis, in which the consistent-non-rough group was divided into C-IP and C-P; while the inconsistent group was divided into IC-IT and IC-T. The following paragraphs describe the data preprocessing stage in more detail.
The raw data file of cytogenetic annotation, gene_info, was downloaded from NCBI Entrez Gene dated August 5, 2008. This file, containing summary information for each gene, is tab-delimited with one line per GeneID of several kinds of species. The first field is tax_id, second field is GeneID, the seventhth field is chromosome, and the eighth field is map location. We extracted the lines whose tax_id equals ‘9606’ (H.sapiens) and saved the results as temporary_cyto_info. There were 39 898 lines of genes information in the file temporary_cyto_info, of which 246 of them had more than one cytogenetic annotation, 37 of them are mitochondrial genomes, 797 of them did not have cytogenetic annotation and in 41 of them the cytogenetic annotation was not defined. A total of 38 777 lines of genes' information had been retrieved and saved as cyto_info.
Another raw data file of cytogenetic annotation, ‘genemap’, was downloaded from NCBI OMIM dated August 5, 2008. Each line in this file is a list of fields, separated by the ‘|’ character. The fifth field is the map location and the 10th field is the MIM number which needs to be matched to gene id. The definition of each field is described in the file genemap.key which can be downloaded from NCBI OMIM. There were 11 124 records in the genemap, 25 pairs of which had duplicated MIM numbers and 12 of which did not have cytoband locations. In the end, 11 062 of NCBI OMIM records were retrieved.
The raw data file of sequence map, seq_gene.md, was downloaded from NCBI Map Viewer Build 36.3 which is a tab-delimited file that gives the position of sequence map. The field names are in the first line of the file. We extracted NCBI Map Viewer's genes information from this file in which the value of group_label field is ‘reference’. The fields of chromosome, chrStart and chrEnd, refer to the sequence positions on the chromosome. There were 33 202 records, 272 pairs of which had the same GeneID and 37 of which were mitochondrial genomes. In the end, 32 621 lines of sequence map information were retrieved and the resulting file was named seq_info.
In the NCBI Entrez Gene and NCBI Map Viewer 32 342 genes occurred simultaneously. In the NCBI OMIM and Map Viewer, 9718 genes occurred simultaneously. These two sets of genes formed the target sets for this study.
4 RESULTS
The result of imprecision-zone analysis of the common genes of NCBI Entrez Gene and NCBI Map Viewer is shown in Table 5. The result of the common genes of NCBI OMIM and NCBI Map Viewer is shown in Table 6. In these two tables, genes in the target database are classified into five groups: IC-IT, IC-T, C-IP, C-P and C-R.
The statistics of gene grouping in NCBI Entrez Gene and NCBI Map Viewer
| Chromosome | IC-IT | IC-T | C-IP | C-P | C-R | Sum |
|---|---|---|---|---|---|---|
| 1 | 51 | 252 | 2074 | 615 | 105 | 3097 |
| 2 | 51 | 195 | 1039 | 770 | 18 | 2073 |
| 3 | 10 | 115 | 1127 | 351 | 27 | 1630 |
| 4 | 13 | 96 | 681 | 499 | 7 | 1296 |
| 5 | 23 | 93 | 643 | 656 | 7 | 1422 |
| 6 | 11 | 169 | 628 | 851 | 37 | 1696 |
| 7 | 24 | 73 | 605 | 967 | 26 | 1695 |
| 8 | 14 | 62 | 667 | 387 | 25 | 1155 |
| 9 | 16 | 99 | 1001 | 259 | 16 | 1391 |
| 10 | 41 | 64 | 771 | 306 | 71 | 1253 |
| 11 | 19 | 172 | 828 | 944 | 17 | 1980 |
| 12 | 16 | 105 | 970 | 365 | 29 | 1485 |
| 13 | 15 | 28 | 210 | 335 | 21 | 609 |
| 14 | 24 | 62 | 880 | 407 | 24 | 1397 |
| 15 | 33 | 66 | 623 | 372 | 55 | 1149 |
| 16 | 6 | 64 | 865 | 292 | 9 | 1236 |
| 17 | 24 | 106 | 843 | 613 | 82 | 1668 |
| 18 | 2 | 26 | 53 | 383 | 7 | 471 |
| 19 | 15 | 159 | 788 | 870 | 12 | 1844 |
| 20 | 5 | 50 | 457 | 294 | 15 | 821 |
| 21 | 15 | 45 | 210 | 94 | 16 | 380 |
| 22 | 10 | 41 | 533 | 144 | 31 | 759 |
| X | 10 | 97 | 748 | 621 | 39 | 1515 |
| Y | 0 | 35 | 230 | 55 | 0 | 320 |
| Total | 448 | 2274 | 17474 | 11450 | 696 | 32342 |
The grouping results are shown by each chromosome in NCBI Entrez Gene and NCBI MapViewer. The field ‘Sum’ refers to the summation of these five groups.
The statistics of gene grouping in NCBI OMIM and NCBI Map Viewer
| Chromosome | IC-IT | IC-T | C-IP | C-P | C-R | Sum |
|---|---|---|---|---|---|---|
| 1 | 46 | 182 | 395 | 225 | 126 | 974 |
| 2 | 30 | 108 | 225 | 188 | 64 | 615 |
| 3 | 16 | 83 | 285 | 68 | 76 | 528 |
| 4 | 15 | 69 | 221 | 32 | 31 | 368 |
| 5 | 11 | 89 | 273 | 71 | 33 | 477 |
| 6 | 14 | 117 | 211 | 172 | 50 | 564 |
| 7 | 21 | 53 | 134 | 183 | 40 | 431 |
| 8 | 13 | 45 | 187 | 35 | 52 | 332 |
| 9 | 15 | 69 | 150 | 90 | 34 | 358 |
| 10 | 33 | 60 | 132 | 47 | 74 | 346 |
| 11 | 11 | 117 | 414 | 29 | 45 | 616 |
| 12 | 14 | 80 | 306 | 68 | 63 | 531 |
| 13 | 9 | 30 | 70 | 36 | 21 | 166 |
| 14 | 17 | 51 | 135 | 45 | 51 | 299 |
| 15 | 22 | 47 | 108 | 42 | 58 | 277 |
| 16 | 4 | 57 | 193 | 100 | 28 | 382 |
| 17 | 21 | 92 | 396 | 21 | 59 | 589 |
| 18 | 0 | 21 | 48 | 43 | 14 | 126 |
| 19 | 18 | 122 | 422 | 17 | 63 | 642 |
| 20 | 7 | 20 | 122 | 74 | 21 | 244 |
| 21 | 4 | 21 | 44 | 42 | 7 | 118 |
| 22 | 4 | 28 | 81 | 88 | 48 | 249 |
| X | 13 | 82 | 212 | 107 | 41 | 455 |
| Y | 1 | 0 | 0 | 21 | 9 | 31 |
| Total | 359 | 1643 | 4764 | 1844 | 1108 | 9718 |
The grouping results are shown by each chromosome in NCBI OMIM and NCBI MapViewer. The field ‘Sum’ refers to the summation of these five groups.
In Table 5, 448 (1.4%) genes are in the IC-IT group, 2274 (7.0%) in the IC-T group, 17 474 (54.0%) genes are in the C-IP group, 11 450 (35.4%) genes are in the C-P group and 696 (2.2%) of genes are in the C-R group. In Table 6, the corresponding statistics values of the five groups are 346 (3.6%), 1656 (17.0%), 4764 (49.0%), 1844 (19.0%) and 1108 (11.4%), respectively.
We further integrate the results of Tables 5 and 6 to construct a confidence table of genes position information (Table 7). Table 8 shows five genes extracted from chromosome 1 to exemplify the five categories in Tables 5–7. Genes in the IC-IT group tend to have longer distance between cyto2seq segment and seq segment, while their distances to the regression line(regression distance) are also long. For example, genes id 159 and 1031 in Table 8 are both inconsistent genes, but the regression distance of gene id 159 (IC-IT) is much longer than that of gene id 1031 (IC-T). Genes in the C-P group has more accurate cytogenetic information (shorter cyto2seq segment) than those in the C-IP group. The C-IP genes have longer regression distances. For example, genes id 864 and 93 183 are both consistent genes, but the regression distance of gene id 864 (C-IP) is much longer than gene id 93 183 (C-P). Genes in the C-R group has large cyto2seq segment-like gene id 6723 in Table 8. The distance information for all genes can be reviewed at http://centrallab.hosp.ncku.edu.tw/imz, where every number in Tables 5–7 can be clicked to bring out a gene list with detailed distance information.
The integration of gene grouping of NCBI Entrez Gene versus NCBI Map Viewer and NCBI OMIM versus NCBI Map Viewer.
| O_IC-IT | O_IC-T | O_C-IP | O_C-P | O_C-R | O_None | |
|---|---|---|---|---|---|---|
| G_IC-IT | 189 | 33 | 26 | 9 | 26 | 165 |
| G_IC-T | 21 | 1111 | 191 | 51 | 76 | 824 |
| G_C-IP | 79 | 298 | 3614 | 657 | 475 | 12351 |
| G_C-P | 52 | 162 | 828 | 1080 | 323 | 9005 |
| G_C-R | 10 | 13 | 27 | 14 | 188 | 444 |
| G_None | 8 | 26 | 78 | 33 | 20 | − |
The prefix ‘G’ refers to NCBI Entrez Gene versus NCBI Map Viewer and the prefix ‘O’ refers to NCBI OMIM versus NCBI Map Viewer. The postfix ‘None’ indicates that there is no such data.
Five examples of the genes and their chromosomal locations in the five groups in Table 7
| Gene id | Cytoband | Cyto2Seq segment | Seq segment | Regression distance | |
|---|---|---|---|---|---|
| IC-IT | 159 | 1cen-q12 | (124300000, 142400000) | (242638419, 242682036) | 76 977 923 |
| IC-T | 1031 | 1p32 | (51300000, 60900000) | (51206955, 51212897) | 3 413 425 |
| C-IP | 864 | 1p36 | (1, 27800000) | (25098589, 25164088) | 8 077 673 |
| C-P | 93183 | 1q23.2 | (157300000, 158800000) | (158264086, 158268407) | 82 985 |
| C-R | 6723 | 1p36-p22 | (1, 94500000) | (11037236, 11042678) | 25 494 214 |
Examples to show the characteristics of the five groups.
We further grouped the inconsistent genes according to the banding levels where inconsistency occurs, i.e. whether the cytogenetic and sequence positions are on different chromosomal arms, regions, bands or sub-band, etc. The results are summarized in Table 9. One may observe that the intolerable group has a tendency to be inconsistent at the arm, region or band levels. Table 10 shows four examples extracted from Table 9. Genes id 7049 and 5784 are two genes whose cytogenetic and sequence positions differ at the level of chromosomal regions (1p3 versus 1p2; and 1q3 versus 1q4), but the regression distance of gene id 7049 is much longer than that of gene id 5784. The regression distance of gene id 7049 is longer than MaxD (defined in Section 2.5) and is thus classified as IC-IT. The regression distance of gene id 5784 is smaller than MaxD and is thus classified as IC-T. Gene id 5567 and 553115 are two other examples whose cytogenetic and sequence positions are both on different bands. The complete result is in the Supplementary Material. Table 9 plus the (regression-distance)/MaxD ratios provide a practical guide to use inconsistent cytogenetic information. Genes inconsistent at the arm level, i.e. their cytogenetic and sequence positions are on different chromosomal arms are apparently problematic. Genes inconsistent at the region or band levels with large (regression-distance)/MaxD ratios are likely to be problematic. In this study, we chose a ratio of 1 to be the cutoff threshold. Inconsistent genes with a ratio ≤1 are considered tolerable. Since we provide the ratio values of all inconsistent genes, one may choose a different threshold ratio for one's particular purposes.
Further classify the inconsistent genes according to the banding levels where inconsistency occurs
| Arm | Region | Band | 1st | 2nd | 3rd | |
|---|---|---|---|---|---|---|
| Sub-band | Sub-band | Sub-band | ||||
| G_IC-IT | 85 | 83 | 188 | 83 | 9 | 0 |
| G_IC-T | 0 | 21 | 404 | 1080 | 648 | 121 |
| O_IC-IT | 61 | 80 | 151 | 60 | 7 | 0 |
| O_IC-T | 0 | 23 | 324 | 789 | 462 | 45 |
| Arm | Region | Band | 1st | 2nd | 3rd | |
|---|---|---|---|---|---|---|
| Sub-band | Sub-band | Sub-band | ||||
| G_IC-IT | 85 | 83 | 188 | 83 | 9 | 0 |
| G_IC-T | 0 | 21 | 404 | 1080 | 648 | 121 |
| O_IC-IT | 61 | 80 | 151 | 60 | 7 | 0 |
| O_IC-T | 0 | 23 | 324 | 789 | 462 | 45 |
The prefix ‘G’ refers to NCBI Entrez Gene versus NCBI Map Viewer and the prefix ‘O’ refers to NCBI OMIM versus NCBI Map Viewer.
Four examples of the genes and their chromosomal locations in Table 9
| Gene id | Symbol | Cytoband | seq2cyto | Regression distance | MaxD | Ratio | |
|---|---|---|---|---|---|---|---|
| IC-IT | 7049 | TGFBR3 | 1p33-p32 | 1p22.2-1p22.1 | 27 090 851 | 9 056 541 | 2.99 |
| IC-T | 5784 | PTPN14 | 1q32.2 | 1q41 | 3 368 679 | 9 056 541 | 0.37 |
| IC-IT | 5567 | PRKACB | 1p36.1 | 1p31.1 | 44 201 966 | 9 056 541 | 4.88 |
| IC-T | 553115 | PEF1 | 1p34 | 1p35.2 | 5 971 747 | 9 056 541 | 0.66 |
In this table the field ‘Ratio’ refers to ‘Regression distance’ ‘MaxD’.
5 DISCUSSIONS AND CONCLUSIONS
Considering the imprecise nature of cytogenetic banding, we classified the genes into five groups which may help the direction of future work. Genes in the IC-IT group are most likely erroneously annotated. Their cytogenetic information should be reviewed and corrected if necessary. The C-R group needs to be annotated more precisely in order to be useful. Experiments such as FISH may be performed. The C-P group is most believable. The C-IP and IC-T groups may be taken into consideration if one wants to include all possible genes associated with interested chromosomal regions, especially when the regions are determined by metaphase chromosomal techniques, such as G-banding, comparative genomic hybridization and spectral karyotyping. These techniques share the same imprecise nature of cytogenetic banding. We determine the imprecision zones based on two major cytogenetic databases. Since there are many mismatched cytogenetic annotations between NCBI Entrez Gene and NCBI OMIM. The integration of the two imprecision-zone analyses offers the opportunity for reciprocal corrections. For example, nine genes are IC-IT in Entrez Gene but are C-P in OMIM. Their cytogenetic annotations in Entrez Gene could be corrected by using the OMIM information. Indeed, the gene SKI was annotated to 1q22-q24 by Entrez Gene, probably according to an older literature (Chaganti et al., 1986). A newer literature (Colmenares et al., 2002) has remapped SKI to 1p36, which is likely the source of OMIM annotation. SKI also stands for a good example of how the regular database updates could contribute to the correction of inconsistencies. Only 189 genes are IC-IT in both databases. Their cytogenetic annotations need to be reviewed and perhaps corrected.
Cuticchia et al. (2006) described the phenomenon of inconsistencies between cytogenetic annotations and sequence positions but did not provide a systematic grouping method for the genes. In this study, we analyze the inconsistent genes with the consideration of tolerable human impreciseness. The effort results in more practical grouping of genes for genomic scientists to use genes' cytogenetic information.
The sizes of the cytogenetic annotations may play some roles in our analysis. The larger cytogenetic annotations (bigger cyto2seq) are more likely to have overlapping cyto2seq and seq segments and hence would be included in the consistent group. Genes' seq segments are much smaller than their cyto2seq, almost always confined in the smallest cytogenetic banding. Therefore, the size effects of seq segments are overshadowed by those of cyto2seq segments.
There are potentially five explanations for each observed inconsistency. One is that only the cytogenetic annotation is wrong, another is that only the sequence information is wrong and the third is that the cytogenetic annotation and the sequence information are both wrong. The sequence map is generally accepted as the ‘gold standard’ of gene positions, and the method described in this study should be useful in identifying incorrect cytogenetic annotations for data cleaning. However, we cannot exclude the possibility that some small regions of the sequence map are wrong but un-noticed. The fourth explanation is that the inconsistency is introduced by the ideogram. In this study, we assumed that the cytoband junctions defined in the ideogram of NCBI Map Viewer are correct. The assumption may or may not be true. In fact, there is no method to determine whether the ideogram is correct or not, since the cytobanding technology is in itself not very precise. This is the reason why imprecision-zone analysis is critical when utilizing cytogenetic annotations. The last but most intriguing explanation for the inconsistency is that both cytogenetic and sequence positions are correct, but the general belief about positional parallelism is wrong. This explanation would require some wild imagination such as periodically looping back during the chromosomal condensation process to produce the metaphase chromosome.
One may suggest using the sequence map to assign cytogenetic positions to all genes. By doing so, all inconsistencies in the database would be eliminated. There are several problems to this approach. First, it is based on the assumption that the sequence map is absolutely correct, which may or may not be true. Second, sequence-determined cytogenetic position is not based on metaphase chromosomes and may not correlate with existing information derived from techniques using metaphase chromosomal preparations. Third, it is not possible to map the junctions of cytobands on the metaphase chromosome to the sequence map without any arbitrariness. This would affect the assignment of cytogenetic positions for genes near the cytoband junctions. Instead of forcing everything to conform to the sequence map, one should take into consideration its imprecise nature when using the cytogenetic banding information.
ACKNOWLEDGEMENTS
The authors thank Mr Isaac Ho for his editorial help on this article.
Funding: Department of Health, Taiwan (DOH-TD-B-111-004 to C.-Y Chou); National Science Council, Taiwan (NSC94-2320-B-006-002 to C.-L.H.).
Conflict of Interest: none declared.
References
Author notes
Associate Editor: John Quackenbush

