


Abstract
Summary: CGHcall achieves high calling accuracy for array CGH data by effective use of breakpoint information from segmentation and by inclusion of several biological concepts that are ignored by existing algorithms. The algorithm is validated for simulated and verified real array CGH data. By incorporating more than three classes, CGHcall improves detection of single copy gains and amplifications. Moreover, it allows effective inclusion of chromosome arm information.
Availability: An R-package (GUI), a manual and an example data set are available at http://www.few.vu.nl/~mavdwiel/CGHcall.html.
Contact: [email protected]
Supplementary information: Supplementary data are available at Bioinformatics online.
1 INTRODUCTION
Array Comparative Genomic Hybridization (array CGH) is a widely used technique to search for chromosomal copy number changes with high spatial resolution. A DNA sample with putative aberrations is hybridized together with normal sample containing two copies of all autosomal chromosomes. The measurements are performed on thousands of (possibly synthetic) strands of DNA, here referred to as ‘clones’, each of which is identified by its base-pair position on a chromosome. Raw log-ratios resulting from feature extraction are usually converted back to an absolute measure: three or four underlying discrete states representing loss (<2 copies), normal (2 copies), gain (3–4 copies), and, possibly, amplification (>4 copies). This process is referred to as ‘calling’.
Segmentation algorithms (Willenbrock and Fridlyand, 2005) detect breakpoints and levels in single profiles. These do not make explicit calls, which is particularly troublesome for tumor profiles which show many breakpoints and levels. New algorithms (Willenbrock and Fridlyand, 2005) were developed to produce copy number calls based on confidence measures as P-values or False Discovery Rates (FDR). These principles are very powerful to make confidence statements about the null-hypothesis: a clone or a segment is in the normal state. Using this testing principle, the null-state, ‘normal’, has a different status than the ‘loss’ and ‘gain’ states: controlling the FDR or the P-value should avoid calling too many aberrations. However, we experienced that biologists prefer to use a more ‘state-neutral’ approach to obtain the most likely classification of the data into three states (namely loss, normal, gain) or four (when including amplification). Mixture model approaches enable such a classification. Among others, such an approach was used for CGHclassify (Engler et al., 2006).
Our algorithm, named CGHcall, combines strong concepts of previously developed methods. First, we used the segmentation results of DNAcopy (also known as CBS) (Olshen et al., 2004), which was shown to be one of the strongest segmentation algorithms (Willenbrock and Fridlyand, 2005). Secondly, one cannot expect loss, normal and gain levels to be uniform over all data, so we allow fluctuations by using random effects (Engler et al., 2006). Finally, as in (Picard et al., 2005), we combine the segmentation results with a mixture model to obtain the most likely classification per segment rather than per individual clone.
In addition, new concepts were introduced. In our model, the number of states is strongly biologically motivated. A mixture model with six states rather than the conventional three (Engler et al., 2006) states is used. The six states reflect double deletion, single deletion, normal, gain, double gain and amplification. We illustrate that when multi-copy gains cover rather large regions in some of the samples inclusion of the extra states improves detection of single copy gains. The states represent well-separated discrete levels, which allows for discriminating amplifications from gains. Estimation of the mixture proportions per chromosome arm is introduced as a promising alternative.
2 METHODS

The mixture proportions in model (1), pℓ, are crucial for the final calling per segment. In model (1) the mixture proportions are estimated from all data. A disadvantage of such an approach is that one ignores that some chromosomes or chromosome arms may a priori be likely to contain more aberrated segments than others. For example, chromosome 2 is non-aberrated in many oral squamous cell carcinomas (Snijders et al., 2005). Therefore, data from this chromosome will increase p3 (which corresponds to the normal state). This in turn down-weights aberration probabilities of segments on other chromosomes. For cases with relatively many samples (>20) an alternative model is proposed in which pℓ is replaced by pℓ ,a where a denotes the index for chromosome arm. We consider the mixing proportions at the resolution of chromosome arms, rather than segments or chromosomes, since (i) only a limited number of extra parameters has to be estimated, (ii) segments cannot be dealt with as one common entity, because their lengths differ between samples and (iii) many aberration events take place at the level of the chromosome arms. Estimation of mixture proportions pℓ,a is detailed in the Supplementary Information.
3 RESULTS
CGHcall was compared with previous methods using a simulation setting as in (Willenbrock and Fridlyand, 2005), with extra Gaussian noise on the segment levels. Results were very good and CGHcall outperformed the other methods for this setting (see Supplementary Information).
Subsequently we illustrate the use of our six-state model (1) instead of the more common three-state model by fitting these models to BAC array CGH data of cervical carcinomas (Wilting et al., 2006). Five samples were used simultaneously. Figure 1 shows the results for sample SCC27. The six state model calls a gain on the chromosome 3q arm, while there is no call on 3q using the three state model. FISH analysis confirmed a single copy gain in this sample for a gene located on the 3q arm, while multi-copy 3q gains were confirmed for some other samples (see Table 5 in (Wilting et al., 2006)). These data contain a considerable proportion of such multi-copy gains: most likely also for chromosome 20 in Figure 1. As a consequence, the mode of the gain state in the three-state model is too high to detect the single copy 3q gain, as opposed to the six-state model which fits a separate mode to the double gains and amplifications. So, the results of CGHcall using the six state model agrees with our expert visual inspection of the profiles, as well as with FISH.
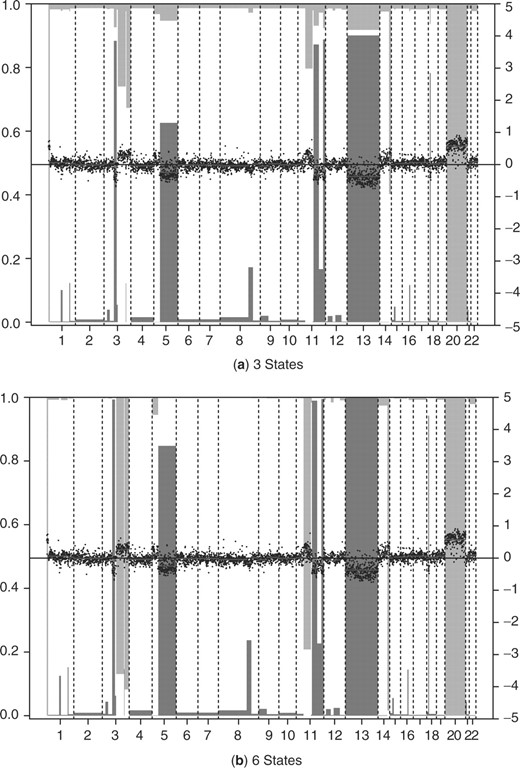
Results of CGHcall for sample SCC27 on BAC array (Wilting et al., 2006) with 3 (a) and 6 states (b). Normalized log2-ratios are plotted with the scale on the right axis. Segments are plotted as horizontal lines. Vertical bars indicate loss and gain probabilities. Probability scale is on the left axis; reversed (‘1−’) for the gains. Segments with a bar extending beyond the middle axis (probability >0.5) are called. Amplification locations are indicated by tick marks on the top axis when 4-level classification was desired.
We discuss the performance of CGHcall for a large BAC data set produced at UCSF: 89 oral squamous cell carcinomas (Snijders et al., 2005). Model (1), using a global mixture proportion pℓ, was fitted and so was the alternative model using the chromosome-arm mixture proportion pℓ,a. Figure 2 shows that the two models agree on most locations. We observe, however, that the possible loss on chromosome arm 9q is not called for this profile using model (1), while it is called using the alternative model. In fact, with model (1) the global loss proportion, which influences the displayed loss probability, is down-weighted by the (near) absence of losses in many other chromosomal regions (see also Supplementary Figure 4). The alternative model prevents this impact of other chromosomal regions, which may increase detection power for aberrations. Similar reasoning holds for the possible gain on chromosome 22.

Further validation of CGHcall for oligonucleotide data is provided in the Supplementary Information. The CGHcall R-package handles everything from filtering out clones with too many missing values, imputation, basic normalization, segmentation, calling and visualization. One may use already segmented data, when preferred. Computing times depend mostly on the number of segments and the number of EM-iterations (see Supplementary Information), so for 40K oligonucleotide data these are not necessarily much longer than for 3-6K BAC data.
4 DISCUSSION
Application of CGHcall to profiles simultaneously is preferred, because the ‘true’ amount of data in one array CGH profile is often smaller than it seems: due to the very high correlation, it basically reduces to the number of segments. The hierarchical mixture model allows for variability within gain or loss levels, thereby accounting for (unknown) effects that cause aberrations to result in non-constant log-ratio levels. If one expects large differences in mean aberration levels for groups of samples (e.g. because of different ploidies), we advise to run the algorithm per group. CGHcall includes the option to correct the raw data for different contaminations by normal cells, which may improve the simultaneous calling. In conclusion, CGHcall is an easy-to-use package achieving high calling accuracy.
ACKNOWLEDGEMENTS
We are grateful to David Engler (Harvard University) who provided us with the CGHclassify R-code, which was partly re-used for plotting functionality in CGHcall. This work was in part supported by the Center for Medical Systems Biology (CMSB), established by the Netherlands Genomics Initiative / Netherlands Organization for Scientific Research (NGI/NWO).
Conflict of Interest: none declared.
REFERENCES
Author notes
Associate Editor: Chris Stoeckert

