


Abstract
Motivation: For establishing prognostic predictors of various diseases using DNA microarray analysis technology, it is desired to find selectively significant genes for constructing the prognostic model and it is also necessary to eliminate non-specific genes or genes with error before constructing the model.
Results: We applied projective adaptive resonance theory (PART) to gene screening for DNA microarray data. Genes selected by PART were subjected to our FNN-SWEEP modeling method for the construction of a cancer class prediction model. The model performance was evaluated through comparison with a conventional screening signal-to-noise (S2N) method or nearest shrunken centroids (NSC) method. The FNN-SWEEP predictor with PART screening could discriminate classes of acute leukemia in blinded data with 97.1% accuracy and classes of lung cancer with 90.0% accuracy, while the predictor with S2N was only 85.3 and 70.0% or the predictor with NSC was 88.2 and 90.0%, respectively. The results have proven that PART was superior for gene screening.
Availability: The software is available upon request from the authors.
Contact: [email protected]
INTRODUCTION
Recent advances in DNA microarray technologies have made it possible to measure the expression levels of thousands of genes simultaneously. These gene expression data are useful in the diagnosis and prognosis of diseases. Most approaches to computational analysis of gene expression data are functionally significant classifications of genes in unsupervised learning methods, e.g. k-means (Somogyi, 1999), hierarchical clustering (Eisen et al., 1998), self-organized maps (SOMs) (Tamayo et al., 1999) and Fuzzy adaptive resonance theory (ART) (Tomida et al., 2002b). On the basis of the expression pattern of classified genes, disease diagnosis or prognosis is carried out. In contrast, supervised learning methods use training sets to specify the genes that should be clustered together (Brown et al., 2000).
An artificial neural network (ANN) is one of the supervised learning methods, and it has been utilized in medical research as a powerful tool for accurately detecting the causal relationship between variables (Tomida et al., 2002a; Gruvberger et al., 2001; Xu et al., 2002). Fuzzy neural network (FNN) is one of the advanced ANN models, and its most attractive feature is that causality between input and output variables can be described extremely accurately as explicit IF-THEN rules obtained from the constructed model (Noguchi et al., 2001). However, it takes a very long time to analyze thousands of gene expression data by FNN. In our previous work, for the purpose of dealing with thousands of genes, we developed the FNN combined with the SWEEP operator method (FNN-SWEEP method) (Ando et al., 2002). The FNN-SWEEP method has been used for microarray analysis and has proved to be a precise, simple tool for predicting patients' survival (Ando et al., 2002, 2003a,b). However, the expression data comprise a huge number of genes including experimental error as well as non-specific genes. In cases where artificial non-specific gene expression data with random noise were added to real gene expression data, the FNN-SWEEP method sometimes selected such artificial non-specific genes, and the FNN model constructed using such selected genes showed high prediction accuracy for estimation data (data not shown). This result shows that the FNN-SWEEP method is sensitive for non-specific genes and genes with error. Therefore, it is necessary to identify selectively significant genes and to eliminate non-specific genes and genes with error before modeling. Many researchers have tried to extract significant genes from microarray data without a priori knowledge, for example through clustering. However, successful results have not yet been obtained by the method to eliminate genes, proposed until now. In the present paper, we apply the projective adaptive resonance theory (PART) (Cao and Wu, 2002) to gene expression profiles in order to eliminate non-specific genes or genes with error. Genes selected by PART were subjected to the FNN-SWEEP modeling method to construct a cancer class prediction model (predictor). The results of the modeling were evaluated through comparison with those models that did not apply screening, using the conventional screening method, S2N or NSC.
MATERIALS AND METHODS
Data processing
In the present study, we used two kinds of gene expression profiles. The first is the gene expression profiles reported by Golub et al. (1999). These gene expression data consist of 72 bone marrow samples [47 acute lymphoblastic leukemia (ALL) and 25 acute myeloid leukemia (AML)], which were obtained from acute leukemia patients at the first time of diagnosis. RNAs prepared from bone marrow mononuclear cells were hybridized to high-density oligonucleotide microarrays (Affymetrix) containing probes for 7129 human genes. From this dataset, we selected 5401 genes with wide expression variation, which are of more than 50 SD. The selection was carried to eliminate genes that had little difference in gene expression among all patients. Furthermore, these data were separated into two groups; 38 samples (27 ALL and 11 AML) and 34 samples (20 ALL and 14 AML). The former group was used as a modeling dataset for constructing the class prediction model (predictor) and the latter was used as a blinded dataset for evaluating the constructed predictor.
The second is the gene expression profile reported by Bhattacharjee et al. (2001). The gene expression data consist of 203 lung tumor samples [139 adenocarcinoma, 21 squamous cell lung carcinomas, 20 pulmonary carcinoids, 6 small cell lung carcinomas (SCLC) and 17 normal lung samples]. RNAs were hybridized to high-density oligonucleotide microarrays (Affymetrix) containing probes for 12600 human genes. From these gene expression data, we selected 3312 genes by the same criterion mentioned above. These samples were separated into a modeling dataset consisting of 198 samples and a blinded dataset consisting of five samples (one sample from each class). An FNN model was constructed from 198 modeling data, and 5 blinded data were predicted. This procedure was repeated five times under the condition that the same sample was not to be selected as blinded data. Since the SCLC sample was only 6, more than 6 blinded data sets cannot be prepared. The accuracy of blinded data was calculated as the average of six times predictions (Table 2).
To apply these acute leukemia and lung cancer data to PART, the expression intensity of each gene was normalized so that the mean value was 0 and the SD 1.
Evaluation of extracted genes by PART
To evaluate genes extracted by PART, we constructed four kinds of FNN class predictors. First, we applied PART to the modeling dataset and extracted 253 genes from the 5401 genes of the acute leukemia data. Then, class predictor genes were selected by FNN-SWEEP from genes extracted by PART (predictor 1). Second, the predictor genes were selected directly from 5401 genes without screening (predictor 2). Third, the genes were selected from the 5401 genes by S2N instead of using PART, and class predictor genes were selected form these genes (predictors 3 and 4). Fourth, the genes were selected by nearest shrunken centroids (NSC) method instead of using PART, and class predictor genes were selected form these genes (predictor 5). These four kinds of predictors were compared with one another with respect to their prediction accuracy of blinded data. Similarly, in the case of lung cancer data, predictor 6 was constructed by FNN-SWEEP from 387 genes (in the case of one set among six datasets) selected by PART, predictor 7 from 3312 genes without screening, predictor 8 from the same number of genes with PART selected by MaxS2N and predictor 9 from the genes by NSC. The outline of the predictor construction is shown in Figure 1.
Projective adaptive resonance theory model
PART was proposed to find projected clusters for datasets in high-dimensional spaces. The architecture is based on the well-known ART developed by Carpenter and Grossberg (1987), and a major modification is provided in order to deal with the inherent sparsity in the full space of the data points (Fig. 2).
In the present paper, PART (Cao and Wu, 2002) was used as a screening method, which enables the elimination of non-specific dimensions for clustering from high-dimensional data, while conventional clustering methods cannot eliminate correctly. The learning procedure of PART is briefly described below.
PART includes comparison layers F1 and clustering layers F2, which are connected by the bottom-up weight zij and top-down weight zji (i = 1, …, m, dimension number of input; j = 1, …, n, category number). PART is controlled by a vigilance parameter ρ and a distance parameter σ (Cao and Wu, 2002). Input vector I has dimensions corresponding to the sampling genes. First of all, an input Ii itself is provided as a weight zji, and zij is set according to the following equations.
where m denotes dimension number of input, L is the constant parameter, which is higher than one.
As a first step, a winner category for each input vector I is determined as follows. The function Tj of category j is defined as Equation (2), which indicates the similarity between input vector I and weight vector zj.
where
where
The category j that has the maximal Tj is defined as the ‘winner’ category for input vector I.
As a next step, the category selected above is judged to follow ‘resonance’ procedure or ‘mismatch reset’ procedure by the function rj defined as the following equation.
‘Resonance’ procedure is carried out if the function rj of the winner category for input vector I is bigger than ρ; that is expressed as
The function rj indicates the size of dimensions of projected subspace and the vigilance parameter indicates its threshold. When the ‘resonance’ procedure should be done, learning of the weight vector of winner category is performed. Learning of the bottom-up weight zij and top-down weight zji is updated according to the following equations.
where α is the learning rate within the range from 0 to 1, was set to 0.1, which is the same value as reported by Cao and Wu (2002), because the change of this value did not affect the selected genes in this paper (data not shown). |X| denotes the number of elements in the set X = {i, hij = 1}.
Otherwise, if the function rj of the winner category for input vector I is lower than ρ, ‘resonance’ procedure is not done and ‘mismatch reset’ procedure is carried out. A new category that has the next maximal Tj is chosen by Equation (2) again. When any category cannot satisfy Equation (7), a new category is generated according to the following equations.
These steps mentioned above are continued until every input vector I is assigned to any category.
We modified the above algorithm as described below. All patterns and all categories have a teacher signal. When a new category is generated, its teacher signal is decided according to the input pattern's teacher signal at that time. The ‘resonance’ procedure is carried out only for the pattern having the same teacher signal as category.
Furthermore, we defined correctness ratio of clustering as the following equation.
where A is all pattern number and E is mismatch pattern number with respect to cluster signal and pattern signal.
Signal-to-noise statistic (S2N)
The signal-to-noise statistic has been proposed to calculate weight of genes for weighed voting algorithm as a binary class predictor by Golub et al. (1999). This statistic is defined as the following equation.
where μ is the average of log gene expressions for each class, and σ is the SD of log gene expressions for each class.
We calculate the S2N value of all class pairs for each gene in a multiclass prediction, and then the biggest S2N value of all pairs is defined as MaxS2N value for the gene.
where C is the set of classes.
Nearest shrunken centroids
NSC method has been proposed to identify minimal subsets of the genes by Tibshirani et al. (2002). In this method, the mean expression of each gene within each class is calculated. Then it shrinks these centroids toward the overall mean for that gene by a fixed quantity, threshold Δ. The NSC value is defined as the following equation.
where i is each gene, k is each class, + is positive part (if t > 0 then t+ = t else t+ = 0), and dik is defined as the following equation.
where
where nk is sample number in the class k and n is all sample number.
In this paper, the FNN-SWEEP method is then applied to the genes that survive the thresholding. The threshold Δ was optimized by cross-validation in the modeling dataset.
RESULTS AND DISCUSSIONS
Identification of optimal gene number of PART screening
PART is the architecture based on the well-known ART developed by Carpenter and Grossberg (1987). In our previous paper (Tomida et al., 2002b), Fuzzy ART based on the ART was constructed by us and applied to clustering of time course data of gene expression profiles. Cluster construction obtained by Fuzzy ART showed high reproducibility and the highest clustering robustness was obtained even when adding random noise corresponding to the 2-fold change. This means that ART can select genes with a similar expression pattern with high robustness. For this reason, we applied Fuzzy ART to time course data of gene expression profiles for constructing genetic networks in our previous paper (Takahashi et al., 2003). Although Fuzzy ART is very useful for time course data analysis of several dimensions, this method cannot be applied for high-dimensional data. PART was derived from ART to extract specific dimensions for correctness clustering of high-dimensional data. Therefore, all ARTs except PART can extract dimensions. Cao and Wu (2002) reported comparison of PART with Fuzzy ART. In their experiment, PART and Fuzzy ART were applied to artificial datasets that have 20-dimension or 100-dimension. For both datasets, the patterns clustered correctly in the case of PART, while the patterns were very disorderly in the case of Fuzzy ART and too many clusters were generated by more rigid parameters. In the present paper, the function to extract dimensions in the PART algorithm was applied to the selection of specific genes from gene expression data.
The number of genes selected by PART is controlled by a vigilance parameter ρ and a distance parameter σ. For the vigilance parameter, we selected the smallest ρ for which the highest correctness ratio was obtained for clustering, with a fixed distance parameter. For example, when the distance parameter was 2.7 in the analysis of acute leukemia, the vigilance parameter became 1 in the range of 1–5401 of integers so as to achieve the clustering correctness ratio of 100.0%, and then the number of selected genes was 253. In order to identify the optimal gene number in PART screening, the distance parameter should also be surveyed. For this purpose, an FNN-SWEEP method was carried out for gene selection and model construction, and 10 independent FNN class predictors were constructed. As shown in our previous papers (Ando et al., 2002, 2003a,b), FNN modeling was carried out by the parameter increasing method. Therefore, the number of input units was optimized during this procedure. In the case of acute leukemia, 10 FNN models with one input were constructed. In the case of lung cancer, 10 FNN models with four inputs were constructed. We calculated the average of the model accuracy.
The results are shown in Table 1 and Figure 3 for acute leukemia, and Figure 4 for lung cancer. Excess elimination decreased the accuracy of the model, which may be caused by the elimination of important genes. In the case of acute leukemia, the model constructed by selecting 244 genes showed 92.1% modeling data accuracy, and selecting 253 genes increased its accuracy to 93.1%. In the case of lung cancer, the model constructed by selecting 352 genes showed 92.4% modeling data accuracy, and selecting 387 genes increased its accuracy to 94.7%. Based on these results, we selected 253 genes and 387 genes as the lowest gene number, respectively.
Comparison of the performance of FNN-SWEEP class predictor with PART and other screening method
Performance of the class predictor constructed with PART screening was investigated. For comparison, class predictors were constructed using the S2N ranking method, which has been frequently used by many researchers, or the NSC method. We also constructed a predictor without screening. Class predictors, which can correctly classify not only modeling data but also new data, should be constructed. Therefore, the performance of the predictors was compared for accuracy using blinded data that were never used for modeling. The average accuracy for blinded data using 10 independent FNN models was calculated. In the case of acute leukemia, the top 50 genes were selected by means of S2N, because 50 genes had been used for analysis by weighted voting method in the original paper, and those were used for FNN-SWEEP analysis. In addition, the top 253 genes were also selected by S2N so as to select the same number of genes as those resulting from PART screening, and those were used for FNN-SWEEP analysis. In the case of multiple class data of lung cancer, the top 387 genes were selected by S2N to evaluate the discrimination accuracy of the predictor constructed by the FNN-SWEEP method. The top 387 genes were defined by MaxS2N. Furthermore, the case using NSC was also compared.
As shown in Table 2, the predictor with PART screening showed significantly high performance. All predictors for acute leukemia showed high-modeling ability for modeling data (∼93% accuracy). However, for blinded data, predictor 1 with PART screening showed 97.1% accuracy, while predictor 2 without screening was only 76.5% accurate. In addition, predictors resulting from the S2N method (predictors 3 and 4) and NSC method (predictor 5) showed only 85.3 and 88.2% of accuracy for blinded data, respectively. In the case of acute leukemia, we prepared 34 samples of blinded data. Therefore, 5 samples out of 34 were predicted incorrectly using the S2N method, while only 1 was incorrect for PART. It should be noted that the accuracy never increased with predictor 7 using 253 candidate genes from S2N. These data mean that PART screening can select genes with the similar expression pattern with high robustness.
In the case of acute leukemia, it should be noted that only 10 significant genes were used for class prediction, since FNN models with one input were constructed, while 50 genes were necessary for the same analysis in the conventional method using weighted voting method (Golub et al., 1999). This is a superior feature from the viewpoint of a biological experiment. If the number of genes of interest is small, the researcher could easily investigate the gene expression level by RT–PCR or histological staining of expressed protein on the specimen in order to know the relationship between gene expression and cancer classification.
For multiple class data of lung cancer, four kinds of FNN class prediction models such as the model with PART screening without screening and with S2N screening were constructed. As shown in Table 2, predictor 6 with PART screening showed 93.7% accuracy for modeling data and 90.0% for blinded data and predictor 9 with NSC screening showed 94.0% accuracy for modeling data and 90.0% for blinded data. On the other hand, predictor 7 without screening was 93.4 and 80.0% accurate, respectively. Predictor 8 with MaxS2N screening was also only 90.4% accurate for modeling data and 70.0% for blinded data, respectively. The reason why blinded data accuracy of MaxS2N was low is that the gene number selected by MaxS2N was matched to one by PART, and this shows that it is possible that PART can condense more significant genes than MaxS2N. In all cases, 10 FNN models were constructed for prediction and for predictor 6, only 17 independent significant genes were used for class prediction, since FNN models with four inputs were constructed.
Comparison of genes used in a predictor with PART, with other screening
The genes selected by the FNN-SWEEP predictor with PART screening were compared with those used in the predictor with NSC, S2N or without screening. The deviation of gene expression level of the genes selected by these four methods was investigated. In this examination, all patients are divided into two classes, such as AML or ALL. Average expression levels of genes used in the predictor with PART screening were calculated for each patient class. The SD of gene expression was calculated against 10 genes in each class. Averages of SDs are also shown in Figure 5. The average SD of the expression level of genes used in the predictor with PART screening in the lower class was significantly smaller than that of the higher class. The value of the SD for the predictor with PART screening was 1/2.3, 1/2.5 or 1/3.6 times less than that with NSC, S2N or without screening. Although in the case of higher class a higher SD was obtained in the predictor with PART, the difference is not so big and 1.2, 1.2 or 1.3 times higher SD were obtained compared with that with NSC, S2N or without screening. Low SD values mean that signals of those genes have less noise and the genes show similar expression level in a class. If genes with a high SD were used in a predictor, the model constructed will show low accuracy for blinded data, although high accuracy may be obtained for modeling data. Actually, as shown in Table 1, discrimination accuracy of all models for the modeling dataset was ∼93%. However, the accuracy of predictor 1 with PART screening was 97.1% for blinded data, while the accuracy of the other models was significantly lower than this. The high accuracy is the result of low SD values in the lower class.
Genes that were part of the FNN class predictor for acute leukemia are shown in Table 3. A total of 10 genes in the FNN model with PART screening included five genes from the top 50 genes selected by the S2N method as reported in the original paper (Golub et al., 1999). The zyxin (X95735) gene was also selected in other predictors derived from either the S2N method or without screening, and the gene was commonly used in the first FNN model in other methods. This result means that the zyxin gene was very important for discriminating acute leukemia and PART did not eliminate this important gene. Furthermore, CD36 antigen gene expression was selected only in the predictor with PART screening. CD36 antigen has been reported by Valet et al. (2003) as a high-risk AML marker gene. This may be due to the fact that the SD in the lower class of the predictor with PART was the smallest among the four predictors as shown in Figure 5.
For clustering of lung cancer, we investigated the presence of previously reported marker genes among the genes selected in the constructed FNN predictors. As shown in Table 4, 17 genes were selected in the predictor with PART screening. Among those, five genes were marker genes reported by Bhattacharjee et al. (2001): tumor protein 63 kDa with strong homology to p53 and keratin 5 for squamous cell lung carcinoma (SQ), adv. glycosylation end product-sp. receptor for normal lung (NL), and ISL1 transcription factor and insulinoma-associated 1 for neuroendocrine tumor (NE). In addition to these genes, two genes among the remaining 12 genes, chromogranin A and chromogranin C, were reported to be marker genes for NE by Lamberts et al. (2001). One gene, ceruloplasmin, was also reported to be a marker gene for AD and SQ by (Wang et al., 2002). These findings suggest that the genes selected in the predictor with PART screening may identify new marker genes and also suggest that the conventional method may miss the selection of important genes for class prediction.
CONCLUSION
In this paper, we applied PART to gene expression data to eliminate non-specific genes and genes with error. Furthermore, the genes selected by PART were subjected to the FNN-SWEEP method for the construction of robust cancer class prediction models. The results showed that the FNN-SWEEP class predictor with PART screening was superior to the predictor without screening, with S2N or NSC. The predictor constructed with PART screening showed 97.1 and 90.0% accuracy for blinded data of acute leukemia and lung cancer respectively, while 76.5 and 80.0% accuracy were obtained using the predictor without screening. This result suggests that PART has the potential to function as a new method of gene screening for class prediction.
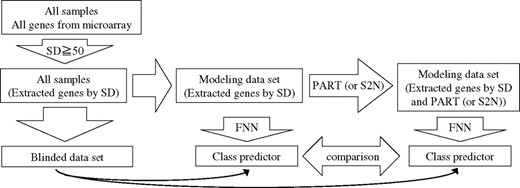
Outline of this paper.
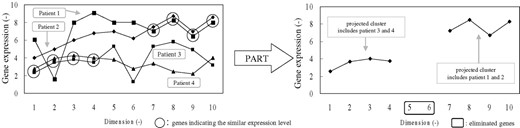
Function of PART clustering.
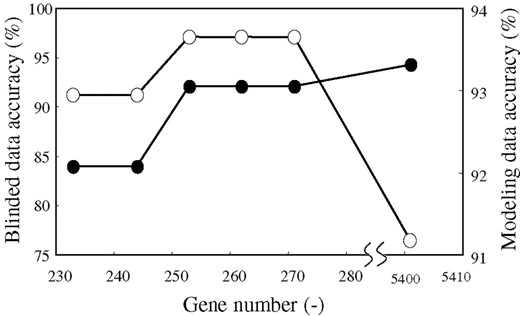
Accuracy on various gene numbers for acute leukemia. Solid line with open circles indicates accuracy for blinded data. Solid line with closed circles indicates accuracy for modeling data.
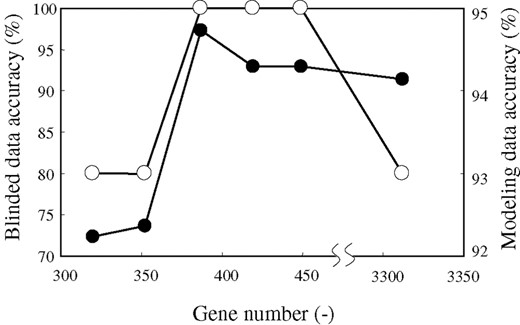
Accuracy on various gene numbers for one set of six lung cancer modeling datasets. Solid line with open circles indicates accuracy for blinded data. Solid line with closed circles indicates accuracy for modeling data.
Comparison of average accuracy and optimal gene numbers
| For acute leukemia | ||||||
| Distance parameter (−) | 2.5 | 2.6 | 2.7 | 2.8 | 2.9 | 100.0 |
| Vigilance parameter (−) | 1 | 1 | 1 | 1 | 1 | 1 |
| Selected gene number (−) | 233 | 244 | 253 | 262 | 271 | 5401 |
| For lung cancera | ||||||
| Distance parameter (−) | 0.9 | 1.0 | 1.1 | 1.2 | 1.3 | 100.0 |
| Vigilance parameter (−) | 30 | 26 | 47 | 49 | 47 | 1 |
| Selected gene number (−) | 320 | 352 | 387 | 419 | 449 | 3312 |
aParameters for one set of six lung cancer datasets.
Accuracy of class prediction for acute leukemia and lung cancer
| Model | Gene screening | Discrimination accuracya (%) | |
|---|---|---|---|
| Modeling datasetb | Blinded dataset | ||
| For acute leukemia | |||
| Predictor 1 | PART | 93.1 | 97.1 |
| Predictor 2 | Nothing | 93.3 | 76.5 |
| Predictor 3 | Top 50 by S2N | 92.9 | 85.3 |
| Predictor 4 | Top 253 by S2N | 93.1 | 85.3 |
| Predictor 5 | NSC | 93.7 | 88.2 |
| For lung cancer | |||
| Predictor 6 | PART | 93.7 ± 0.8 | 90.0 ± 9.3 |
| Predictor 7 | Nothing | 93.4 ± 0.4 | 80.0 ± 0.0 |
| Predictor 8 | MaxS2N | 90.4 ± 1.9 | 70.0 ± 9.3 |
| Predictor 9 | NSC | 94.0 ± 0.4 | 90.0 ± 9.3 |
aOne blinded dataset was prepared for acute leukemia and six blinded datasets were prepared for lung cancer. For lung cancer, the average accuracy from six models corresponding to six blinded datasets was listed.
bThe value was obtained from 3-fold cross-validation for acute leukemia and 5-fold cross-validation for lung cancer.
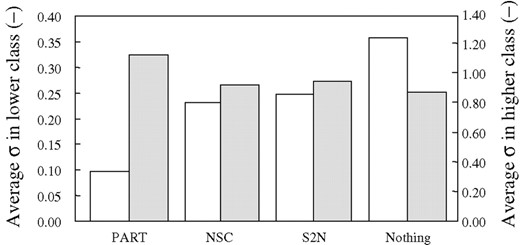
Comparison of average of each parameter for 10 genes of predictors. Average of the SD is indicated by σ. Average and SD of gene expression data of all patients were normalized to become 0 and 1, respectively. White bars and grey bars mean average σ in lower class and higher class, respectively.
The genes used in FNN class predictor for acute leukemia
| Description | Sequence | Marka |
|---|---|---|
| ACADM acyl-coenzyme A dehydrogenase, C-4 to C-12 straight chain | M91432 | ° |
| Azurocidin gene | M96326 | ° |
| CD36 antigen (collagen type I receptor, thrombospondin receptor) | M98399 | |
| CST3 Cystatin C (amyloid angiopathy and cerebral hemorrhage) | M27891 | ° |
| Cystatin A | D88422 | |
| DF D component of complement (adipsin) | M84526 | ° |
| ELA2 Elastatse 2, neutrophil | M27783 | |
| Nucleolysin TIA-1 | M77142 | |
| PTX3 Pentaxin-related gene, rapidly induced by IL-1 beta | M31166 | |
| Zyxin | X95735 | ° |
aMarks mean genes included in top 50 by S2N.
The genes used in FNN class predictor for one set of six lung cancer modeling datasets
| Description | Sequence | Marka | Marker genes |
|---|---|---|---|
| Adv. glycosylation end product-sp. receptor | M91211 | ° | |
| Cathepsin Z | AF032906 | ||
| Ceruloplasmin | M13699 | °b | |
| Chromogranin A | U03749 | °c | |
| Chromogranin C | M25756 | °c | |
| Human amyloid precursor-like protein 1 mRNA | U48437 | ||
| Hypothetical protein 384D8_6 | U62317 | ||
| Insulinoma-associated 1 | M93119 | ° | |
| ISL1 transcription factor | U07559 | ° | |
| Keratin 5 | M21389 | ° | |
| KIAA0736 protein | AB018279 | ||
| KIAA1087 protein | AB029010 | ||
| Protein tyrosine phosphatase, receptor type, N | L18983 | ||
| Secretagogin | Y16752 | ||
| Secretory granule, neuroendocrine protein 1 | Y00757 | ||
| Synaptosomal-associated protein, 25 kDa | D21267 | ||
| Tumor protein 63 kDa with strong homology to p53 | Y16961 |
aMarks mean genes selected by Bhattacharjee et al. (2001).
bThe marker gene reported by Wang et al. (2002).
cThe marker genes reported by Lamberts et al. (2001).
We wish to thank Dr Wu Jianhong for discussions on PART algorithm. This research was supported in part by Grant-in-Aid for the Project for Development of a Technological Infrastructure for Industrial Bioprocesses on R&D of New Industrial Science and Technology Frontiers by the Ministry of Economy, Trade and Industry (METI), which was entrusted by New Energy and Industrial Technology Development Organization (NEDO).
REFERENCES
Ando, T., Suguro, M., Hanai, T., Kobayashi, T., Honda, H., Seto, M.
Ando, T., Suguro, M., Kobayashi, T., Seto, M., Honda, H.
Ando, T., Suguro, M., Kobayashi, T., Seto, M., Honda, H.
Bhattacharjee, A., Richards, W.G., Staunton, J., Li, C., Monti, S., Vasa, P., Ladd, C., Beheshti, J., Bueno, R., Gillette, M., et al.
Brown, M.P., Grundy, W.N., Lin, D., Cristianini, N., Sugnet, C.W., Furey, T.S., Ares, M., Jr, Haussler, D.
Cao, Y. and Wu, J.
Carpenter, G.A. and Grossberg, S.
Eisen, M.B., Spellman, P.T., Brown, P.O., Botstein, D.
Golub, T.R., Slonim, D.K., Tamayo, P., Huard, C., Gaasenbeek, M., Mesirov, J.P., Coller, H., Loh, M.L., Downing, J.R., Caligiuri, M.A., Bloomfield, C.D., Lander, E.S.
Gruvberger, S., Ringner, M., Chen, Y., Panavally, S., Saal, L.H., Borg, A., Ferno, M., Peterson, C., Meltzer, P.S.
Lamberts, S.W., Hofland, L.J., Nobels, F.R.
Noguchi, H., Hanai, T., Honda, H., Harrison, L.C., Kobayashi, T.
Takahashi, H., Tomida, S., Kobayashi, T., Honda, H.
Tamayo, P., Slonim, D., Mesirov, J., Zhu, Q., Kitareewan, S., Dmitrovsky, E., Lander, E.S, Golub, T.R.
Tibshirani, R., Hastie, T., Narasimhan, B., Chu, G.
Tomida, S., Hanai, T., Koma, N., Suzuki, Y., Kobayashi, T., Honda, H.
Tomida, S., Hanai, T., Honda, H., Kobayashi, T.
Valet, G., Repp, R., Link, H., Ehninger, A., Gramatzki, M.M.
Wang, K.K., Liu, N., Radulovich, N., Wigle, D.A., Johnston, M.R., Shepherd, F.A., Minden, M.D., Tsao, M.S.

