


Abstract
Studies have shown that the mechanism of action of many drugs is related to miRNA. In-depth research on the relationship between miRNA and drugs can provide theoretical foundations and practical approaches for various areas, such as drug target discovery, drug repositioning and biomarker research. Traditional biological experiments to test miRNA-drug susceptibility are costly and time-consuming. Thus, sequence- or topology-based deep learning methods are recognized in this field for their efficiency and accuracy. However, these methods have limitations in dealing with sparse topologies and higher-order information of miRNA (drug) feature. In this work, we propose GCFMCL, a model for multi-view contrastive learning based on graph collaborative filtering. To the best of our knowledge, this is the first attempt that incorporates contrastive learning strategy into the graph collaborative filtering framework to predict the sensitivity relationships between miRNA and drug. The proposed multi-view contrastive learning method is divided into topological contrastive objective and feature contrastive objective: (1) For the homogeneous neighbors of the topological graph, we propose a novel topological contrastive learning method via constructing the contrastive target through the topological neighborhood information of nodes. (2) The proposed model obtains feature contrastive targets from high-order feature information according to the correlation of node features, and mines potential neighborhood relationships in the feature space. The proposed multi-view comparative learning effectively alleviates the impact of heterogeneous node noise and graph data sparsity in graph collaborative filtering, and significantly enhances the performance of the model. Our study employs a dataset derived from the NoncoRNA and ncDR databases, encompassing 2049 experimentally validated miRNA-drug sensitivity associations. Five-fold cross-validation shows that the Area Under the Curve (AUC), Area Under the Precision-Recall Curve (AUPR) and F1-score (F1) of GCFMCL reach 95.28%, 95.66% and 89.77%, which outperforms the state-of-the-art (SOTA) method by the margin of 2.73%, 3.42% and 4.96%, respectively. Our code and data can be accessed at https://github.com/kkkayle/GCFMCL.
INTRODUCTION
Only about 2% of the genes in the human genome are encoded into proteins, and the rest of the genes are translated into non-coding RNA (ncRNA) [1]. miRNA is a small ncRNA with a length of about 19–25nt [2]. miRNA mainly regulates gene expression by inhibiting or degrading mRNA [3], including developmental timing and host–pathogen interactions as well as cell differentiation, proliferation, apoptosis and tumorigenesis [4]. Furthermore, miRNAs control gene expression at different levels in physiology and development [5], thus they are closely related to many human diseases. For example, miRNAs can act as oncogenic drivers or tumor suppressors [6], schizophrenia is also associated with dysregulation of the brain transcriptome and protein production, and miRNAs have been shown to play a role in this process [7]. In addition, microRNAs (miRNAs) play a crucial role in biological development and vital activities. During hematopoiesis, hematopoietic stem cells (HSCs) undergo proliferation, commitment, maturation and apoptosis through transcriptional and growth factor networks. Research has demonstrated that three miRNAs, namely miR-223, miR-181 and miR-142, are preferentially expressed in hematopoietic tissues during these processes [8, 9]. In a more specialized role during the later stages of vertebrate development, certain microRNAs (miRNAs) have been identified to exhibit distinct functions. For instance, miR-1 modulates the balance between differentiation and proliferation of cardiomyocytes in the course of murine cardiac development [10], while miR-143 is involved in the regulation of human adipocyte differentiation. MiR-143 is strongly expressed in adipose (fat) tissue and becomes upregulated during the differentiation process of human pre-adipocytes into adipocytes [11]. From an evolutionary standpoint, the regulation of gene expression by miRNAs may represent a simple yet flexible innovation, which is crucial for cellular differentiation [12]. Therefore, the studies of miRNA and the development of drugs targeting miRNA have become one research topic of biomedical research [13].
More and more studies have shown that miRNAs can be used as drug targets, where drugs can treat diseases by regulating the expression of miRNAs [14]. For example, some studies have found that inhibiting the expression of miRNA-221 can relieve airway inflammation in patients with asthma [15], and increasing the expression of miR-30d can hinder the growth and metastasis of pancreatic cancer cells [16]. Therefore, investigating the association between miRNA expression levels and disease holds great potential for clinical applications and therapeutic significance. Moreover, miRNAs can be indirectly or directly involved in the process of drug metabolism and drug transport, and individual differences in patients’ sensitivity and resistance to drugs may be affected by differences in miRNA expression [3, 17]. It is of great significance to explore the correlation mechanism between miRNA expression and drug action for the treatment of diseases [18]. However, resistance and susceptibility associated with most drugs and different miRNAs are still under explored due to diverse factors influencing drug response, such as decreased drug accumulation, altered intracellular drug distribution, dysregulation of the cell cycle, damaged DNA Increased repair and decreased apoptotic response [19]. Therefore, it is crucial to develope an accurate and efficient miRNA-drug prediction model to study the relationship between miRNA mechanism and the development of targeted drugs.
Currently, many deep learning and machine learning based methods have been proposed in the field of biology and chemistry [20–25]. Among them, graph neural network (GNN) [26] based model has received much attention from the researchers. Compared with other models, GNN can make full use of the topological information of a graph to aggregate node feature information, which is especially effective to explore the relationship between drugs and miRNA. For example, GCMDR [27] uses graph convolution neural network [28] to predict the association between miRNAs and drug resistance by considering the information on drug substructure and miRNA expression profiles. NASMDR [29] integrates sequence and structure information and leverages the efficient neural structure search to predict miRNA drug resistance. However, the majority of current research has primarily focused on the computational models of miRNA-drug resistance. This direction investigates how miRNAs contribute to the development of drug resistance through the regulation of drug metabolism, transportation and cellular apoptosis. The ultimate goal is to overcome drug resistance [27, 29, 30]. In contrast, this paper explores the miRNA-drug sensitivity, which primarily explores the impact of miRNAs on cellular drug sensitivity to enhance therapeutic efficacy and reduce side effects. The objective of such research is to identify miRNAs that can augment drug sensitivity, thereby providing a basis for individualized treatment [2]. To our knowledge, computational models related to miRNA-drug sensitivity are still in the developmental stage, particularly with respect to the predictive capabilities for positive samples, which exhibit considerable room for improvement. This limits the computational models’ guidance for wet-lab experiments. Consequently, the development of a comprehensive miRNA-drug sensitivity computational model with excellent overall performance and positive sample prediction capabilities can effectively guide related experiments, increasing the hit rate, reducing experimental costs and enhancing experimental efficiency.
Collaborative filtering [31] is a technique for recommendation systems that aim to recommend the items for users by analyzing the similarity between two users. Collaborative filtering finds the similar users by analyzing a large amount of user rating data, and then recommends items to the current user based on the comments of these similar users on items. The advantage of collaborative filtering is that it can capture complex correlations between users and make recommendations through a large amount of user data. NGCF [32] leverages graph convolution to collaborative filtering for the first time, which demonstrates the potential of graph collaborative filtering model in biochemical information computing. For example, LGCMDS [33] leverages the LightGCN [34] to predict miRNA-drug sensitivity. However, the aforementioned prediction models based on graph collaborative filtering are easily affected by the noise of heterogeneous node information. In the process of aggregating information, the model mainly relies on the miRNA-drug interaction information in a graph to learn the nodes. However, the high-order feature information of the miRNA (drug) node is ignored, which limits the further performance enhancement for the existing methods.
To handle the issue of the sparsity of the miRNA-drug topological graph and the low utilization rate of high-order feature information of miRNA (drug) nodes, we propose GCFMCL, which is a fusion of graph collaborative filtering and multi-view contrastive Learned predictive model. The proposed model considers the miRNA-drug topology as a bipartite graph and leverages a graph collaborative filtering to extract homogeneous neighborhood feature representations from the even layers of the GNN. These representations are combined with the initial features to form positive pairs for contrastive learning. Furthermore, by extracting feature information from nodes and employing clustering algorithms in the feature space, we capture feature similarity and utilize central nodes of the same cluster for comparative feature learning. We then form positive pairs between the central features and each similar node, with the goal of maximizing their similarity. Topology-based contrastive learning and feature-based contrastive learning can make full use of the high-order feature information of nodes and alleviate the impact of the sparse topological graph. Our contributions can be summarized as follows:
(i) We propose a miRNA-drug sensitivity prediction model, named GCFMCL, which is designed based on graph collaborative filtering.
(ii) The proposed method combines topological contrastive learning and feature contrastive learning to alleviate the noise caused by heterogeneous nodes and the sparsity of interactions, which can enhance the reliability of the model.
(iii) The extensive contrastive experiments on the benchmark datasets demonstrate the efficacy of contrastive learning and verify the model performance, which has the potential to the development of targeted drugs and the exploration of drug mechanisms.
MATERIALS AND METHODS
Dataset
In order to validate our proposed GCFMCL, we employed the miRNA-drug sensitivity dataset provided by the work of DGNNMDA [2], which was obtained from the NoncoRNA [35] and ncDR [36] databases. The NoncoRNA database contains associations among 134 types of cancer, 5568 ncRNAs and 154 drugs, while the ncDR database includes associations between 140 drugs and 1039 ncRNAs. The dataset filtering criteria involved the researchers selecting only experimentally verified miRNA associations, thus excluding drug resistance associations, associations obtained through prediction without experimental validation, and all non-miRNA ncRNA sensitivity associations.
By applying the aforementioned filtering criteria, the researchers ultimately obtained 2049 miRNA-drug sensitivity associations between 431 miRNAs and 140 drugs. The sparsity of this dataset is 0.96, which adequately reflects the performance improvement brought about by contrastive learning in the model. For more information on the dataset’s attributes and the sources of the databases, please refer to Supplementary materials.
Problem formulation
Given a dataset of miRNA-drug sensitivity, our goal is to use the GCFMCL model to identify potential miRNA-drug sensitivities. This model takes in miRNA-drug sensitivity data and feature matrix, and starts by creating a bipartite graph to model the sensitivity data. It then utilizes graph collaborative filtering based on the topological structure to aggregate topological neighborhood information. Subsequently, we extract even-layer neighborhood information to form neighborhood contrastive targets and capture high-dimensional central features of similar nodes based on the original features by treating them as feature contrastive targets. The proposed model then employs multiple iterations to acquire node final feature representations. Finally, a deep learning framework is employed to non-linearly transform feature values and adjust feature dimensions, culminating in the prediction of miRNA-drug sensitivity.
Graph collaborative filtering
Graph collaborative filtering technology can capture the relationship between miRNA-drugs based on graph topology and sensitivity relationship, so that potential interactions can be predicted more accurately. We set the miRNA set |$\mathcal{R}=\{r\}$| and drug set |$\mathcal{D}=\{d\}$|, miRNA-Drug Sensitivity Matrix |$\mathbf{S} \in \{0,1\}^{|\mathcal{R}| \times |\mathcal{D}|}$| represents the observed sensitive relationship,where |$S_{r, d}=1$| if and only if there is sensitivity between miRNA |$r$| and drug |$d$|, otherwise |$S_{r, d}=0$|. The graph collaborative filtering method based on graph neural network (GNN) organizes the sensitive data |$R$| into an interactive graph |$\mathcal{G}=\{\mathcal{V}, \mathcal{E}\}$|, where |$\mathcal{V}=\{\mathcal{R} \cup \mathcal{D}\}$| represents the node set, |$\mathcal{E}=\left \{(r, d) \mid r \in \mathcal{R}, d \in \mathcal{D}, S_{r, d}=1\right \}$| represents the edge set. Graph collaborative filtering aggregates feature representations of miRNAs and drugs based on the following steps:
where |$\mathcal{N}_{r}$| represents a neighbor set of miRNA |$r$| in the interaction graph |$G$|, and |$K$| represents the number of layers of GNN. |$F_{r}^{(0)}$| is initial eigenvector. For miRNA |$r$|, we aggregate the feature representations of its neighbors in the previous layer through the aggregation function |$f_{\text{aggr }}$| to generate the feature representation |$F_{r}^{(k)}$| of the K-th layer. After |$K$| iterations of aggregation, the information of K-hop neighbors is encoded as |$F_{r}^{(k)}$|. The output function |$f_{\text{output }}$| summarizes all representations |$\left [F_{r}^{(0)}, F_{r}^{(1)}, \ldots , F_{r}^{(K)}\right ]$| to obtain the final feature representation of miRNA |$r$| and perform sensitivity prediction. The characteristic representation of the drug can be obtained by the same method.
For the graph collaborative filtering, NGCF [32] uses the graph convolutional network to model the neighbor relationship between users and items, but LightGCN [34] has been verified by ablation experiments, the feature transformation and nonlinear activation during aggregation don’t positively affect collaborative filtering performance. Instead, they negatively impact model fitting, leading to reduced prediction effectiveness. Therefore, in GCFMCL, we abandon the use of these two parameters. The feature aggregation process is shown in Figure 1, and the formula can be expressed for:
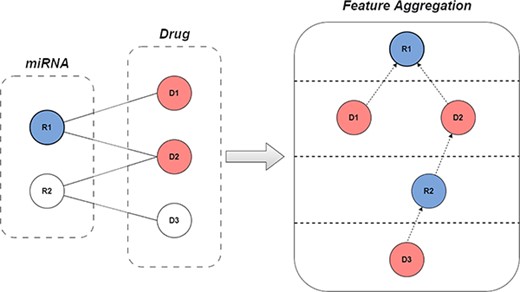
A simple procedure for graph collaborative filtering using bipartite graphs.
where |$\mathcal{N}_{r}$| and |$\mathcal{N}_{d}$| represent the set of neighbors of miRNA |$r$| and Drug |$d$|. |$k$| and |$k+1$| denote the current layer and the next layer of GNN respectively.Drug can also be represented by the same formula.
After feature propagation in the K-layer, we combine each layer of feature representation and perform the mean operation:
where |$K$| represents the total number of layers in the graph collaborative filtering network. The final feature representation of an miRNA is obtained by calculating the average of aggregated features across layers. Similarly, the final feature representation of a drug is also obtained in this manner.
By using the above method, we obtain the final feature representations |$F_{r}$| and |$F_{d}$| for any miRNA |$r$| and drug |$d$|. We predict the sensitivity relationships of positive and negative samples using the dot product of the final feature representations. Subsequently, we optimize the model parameters using the Bayesian Personalized Ranking (BPR) loss [37]. BPR is a Bayesian method for matrix factorization, with the goal of estimating the latent sensitivity relationships based on the observed relationships. Specifically, the objective of BPR in this model is to make the sensitivity prediction score of positive samples higher than that of negative samples, with the loss function as follows:
where |$\sigma $| represents the sigmoid activation function, and |$\hat{y}_{r, d}$| and |$\hat{y}_{r, n}$| denote the prediction results of positive and negative sample pairs, respectively.
Topological contrastive learning
Existing graph collaborative filtering models derive feature representations of nodes in the graph by integrating multiple layers of feature information. However, most models do not take into account the differences in node types during propagation, ignore the heterogeneity in the interaction graph, and do not fully utilize the information of homogeneous neighbors in the interaction graph. The miRNA-drug sensitivity relationship is constructed as a bipartite graph, and the direct nearest neighbors of each miRNA (drug) are heterogeneous nodes.To make full use of the similar nodes information, we extract the aggregation information of the even-numbered GNN layers of each node to get the representation of homogeneous neighbors. Through these feature representations, we can capture the relationship between miRNA(drug) and its homogeneous neighbors more effectively, and we call these information expressed in the miRNA-drug interaction graph as topological information. Then, the initial feature information of miRNA (drug) and the output of the even-numbered GNN layer are used as positive contrastive pairs, and the initial features of other nodes are compared with the output of the even-numbered layer aggregation as negative contrastive pairs, this process can effectively alleviate the feature aggregation problem of sparse nodes, supplement and improve the graph collaborative filtering algorithm, maximize the utilization of homogeneous node information and reduce the negative effects caused by node heterogeneity (as Figure 2 shows).
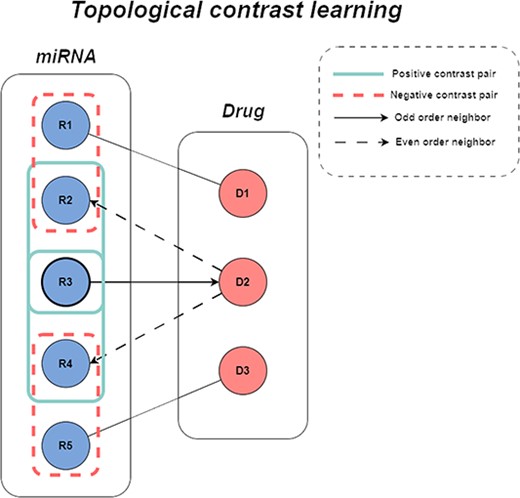
The figure of topological contrastive learning.
Subsequently, we used InfoNCE [38] to maximize the similarity of positive-contrastive pairs with the following equation:
where |$e$| is an even number and |$F$| is the normalized output of the GNN even layer.|$\tau $| is the temperature hyper-parameter of softmax.|$\mathcal{L}_{T}^{R}$| represents the topologically contrasting target loss functions of mirna. |$\alpha $| is a settable parameter. |$\mathcal{L}_{T}^{D}$| can also be calculated with the same formula.
Feature contrastive learning
We noticed the heterogeneity in the interaction graph in topological contrastive learning and tried to improve it using homogeneous neighborhood information, but the loss function is difficult to make a specific treatment of the heterogeneity of the nodes when calculating the loss values, which will inevitably introduce loss errors. Therefore, this model tries to use feature contrastive learning to reduce the impact of this error.
We observed that some nodes had similar feature information but no corresponding connection information on the interaction graph, and the information between these nodes was difficult to be utilized by methods such as graph collaborative filtering. Accordingly, we proposed to use feature information clustering to divide miRNAs (drugs) with similar features into the same set, where the similarity of features was based on the final feature representation of miRNA (drug). Clustering into the same group indicated a higher similarity. Then, we used the center vector of the miRNA (drug) set as the feature representation of the set of similar nodes, so that the contrast information hidden in the node features was obtained. Subsequently, we used a miRNA (drug) node with its corresponding miRNA (drug) set centroid vector as a positive contrastive pair and with other miRNA (drug) set centroid vectors as a negative contrastive pair. Figure 3 represents the abbreviated process.
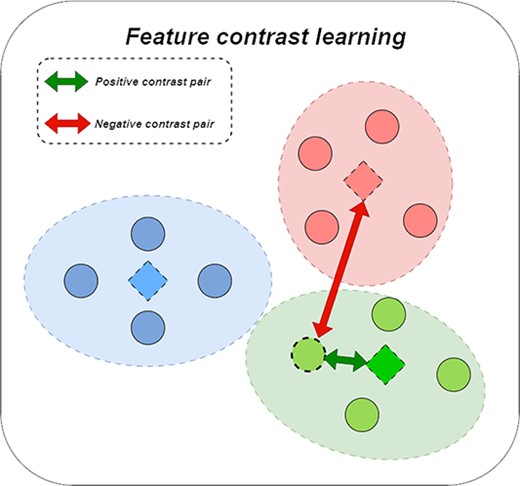
The figure of feature contrastive learning.
Since this process cannot be optimized end-to-end, we use the EM algorithm to update the parameters. The process can be divided into an expectation step and a maximization step. In the expectation step, the expected value of the hidden variable is calculated by using the estimated value of the current parameter; in the maximization In step, by using the expected value of the hidden variable, the estimated value of the parameter is updated so that the GNN model maximizes the following function:
where |$S$| is the sensitivity matrix, |$E$| is the feature information of miRNA,|$\rho $| is the model parameter, |$\mathbf{c}_{i}$| is the feature contrastive target of miRNA |$r$| and the optimization function of the drug can be obtained in the same way.
Then the model uses InfoNCE [38] to minimize the error of positive alignment, the specific formula is as follows:
where |$\mathbf{c}_{j}$| is the feature contrastive target of miRNA |$r$|, and |$\mathbf{c}_{j}$| is the feature contrastive target of drug |$d$|. The final loss value is the weighted sum of the miRNA contrast loss value and the drug contrast loss value.
Model structure
The model structure is shown in Figure 4. First, the miRNA-drug bipartite graph is constructed to obtain the topological relationship between the miRNA and the drug, and then the corresponding feature vectors are assigned to the nodes through the feature matrix.
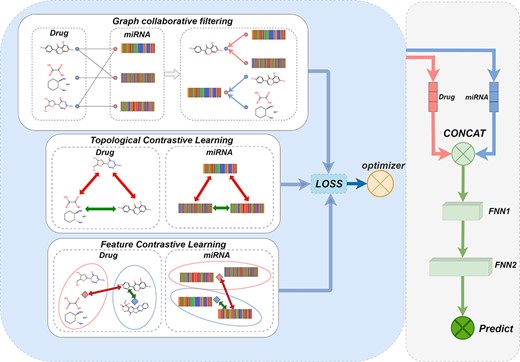
This figure shows the structure of the GCFMCL model. In the topology contrastive learning module, the bottom depictions of drugs and miRNA represent positive contrastive pairs, while the rest represent negative contrast pairs. FNN1 and FNN2 were fully connected layers to be trained, with FNN1 receiving the connected pre-trained drug and miRNA feature representations as input. FNN2, on the other hand, outputted a probability value between 0 and 1, representing the likelihood of a sensitivity association between the drug and miRNA. Subsequently, the loss value between this probability value and the target label was calculated using the binary cross-entropy (BCE) loss function, and the parameters in FNN1 and FNN2 were updated through the backpropagation algorithm.
We use the graph collaborative filtering algorithm to aggregate the neighborhood information multiple times, and save each feature aggregation result of the layer. And then, we use the k-means algorithm to perform similarity clustering on the miRNA (drug) nodes, and form a positive contrastive between the nodes and the central features of the same cluster, and form a negative contrastive with the central features of other clusters. Then perform contrastive learning and use InfoNCE as the loss function for this step. In addition, we also use topological contrastive learning. We form a positive contrastive between a node and its even-order neighbors after collaborative filtering, and a negative contrastive between the even-order neighbors and other nodes, which is used to calculate the loss value using InfoNCE.
After random negative sampling, we derived the BRP loss function by referring to formulas 2–4. Then we adopted a multi-task learning strategy, with the BRP loss value as the core, and the loss values of topology contrastive learning and feature contrastive learning as auxiliary. The specific learning strategies are as follows:
where |$\lambda _{1}$| and |$\lambda _{2}$| are the weights of topology contrastive learning and feature contrastive learning, |$\lambda _{3}$| is the parameter of the regularization item, and |$\rho $| represents the weight parameter of GNN.
After multiple rounds of training, we can obtain the final feature representation of each miRNA (drug) through the graph collaborative filtering model. Then, we randomly sample the negative samples of the miRNA-drug action pairs equal to the positive samples, perform concatenation operation on the miRNA and drug feature values of the positive and negative samples respectively. Through the two-layer FNN network layer of nonlinear processing, the feature transformation is carried out to obtain the prediction result. In this experiment, the dimension of the initial vector is 64 dimensions. Through verification and comparison, we observe that the best result in this experiment is to use two layers of FNN network layers, in which the dimension of the first layer is 256, and the dimension of the second layer is 64.
RESULT
Performance measures
In the experimental comparison, we selected six indicators of accuracy, precision, recall, F1, AUC and AUPR to evaluate the performance of the model. We draw the ROC curve, and then calculate the area under the curve AUC to evaluate the overall classification ability of the classifier. AUPR uses precision and recall as the horizontal and vertical coordinates to draw the average value of the area of the precision-recall curve. This indicator can be effectively evaluated. The accuracy of the classifier. The calculation methods of the first four indicators are defined as follows:
where TP and TN denote the number of positive and negative samples correctly predicted by the model; FP and FN denote the number of positive and negative samples incorrectly predicted by the model, respectively.
Comparison model description
To evalute the performance of GCFMCL, we compare the proposed method with eight representative models including DGNNMD, LAGCN, GANLDA and LGCMDS utilized graph neural networks or graph collaborative filtering, among other graph deep learning methods, ABHMDA combined multiple machine learning methods, SDLDA, DMFCDA, KATZMDA used mathematical methods and deep learning. Here are some brief introductions:
(i) DGNNMDA [2] constructs a miRNA-drug heterogeneous network using the miRNA-drug sensitivity association and the similarity network between miRNA and drug, and uses a dual-channel network to aggregate information on homogeneous and heterogeneous nodes and predict miRNA-drug sensitivity associations.
(ii) LAGCN [41] utilizes attention mechanism and graph convolution to predict drug–disease associations on heterogeneous networks.
(iii) GANLDA [39] processes node features using principal component analysis and predicts lncRNA–disease associations using graph attention networks.
(iv) SDLDA [42] uses singular value decomposition and deep learning to extract features and predict lncRNA–disease associations.
(v) DMFCDA [44] uses matrix decomposition and deep learning to extract explicit and implicit features for circRNA–disease association prediction.
(vi) ABHMDA [43] jointly uses decision trees and k-means clustering to build a strong classifier model to predict human microbe–disease associations.
(vii) LGCMDS [33] uses feature transformation and lightGCN to extract node features for drug–disease sensitivity prediction.
(viii) KATZMDA [40] processes miRNA–disease association by computing the similarity between diseases and miRNAs, and predicts miRNA-disease associations on a heterogeneous graph network.
Model performance comparison
We compared GCFMCL with the other eight methods. The 5-fold cross-validation experiment results show that GCFMCL has achieved promising results in all indicators. Figure 5 shows the ROC–AUC curve of GCFMCL in five rounds of cross-validation. Figure 6 shows the AUPR curve, and the comparison with the indicators of eight advanced methods is shown in Table 1.
Performance comparison of GCFMCL with eight advanced methods
| Method | AUC | AUPR | Accuracy | Precision | Recall | F1 |
|---|---|---|---|---|---|---|
| KATZMDA [40] | 77.66% | 82.26% | 73.81% | 78.09% | 66.19% | 71.63% |
| LGCMDS [33] | 88.72% | 90.26% | 82.40% | 83.70% | 80.49% | 82.04% |
| ABHMDA [43] | 85.08% | 83.84% | 76.86% | 74.56% | 81.73% | 77.94% |
| DMFCDA [44] | 84.15% | 72.26% | 81.80% | 81.58% | 82.40% | 81.83% |
| SDLDA [42] | 85.04% | 89.32% | 81.68% | 86.97% | 74.61% | 80.26% |
| GANLDA [39] | 89.85% | 89.99% | 81.94% | 87.61% | 74.40% | 80.47% |
| LAGCN [41] | 88.49% | 90.70% | 82.18% | 86.25% | 76.56% | 81.12% |
| DGNNMDA [2] | 92.55% | 92.24% | 85.23% | 87.26% | 82.61% | 84.81% |
| GCFMCL | 95.28% | 95.66% | 89.85% | 90.40% | 89.17% | 89.77% |
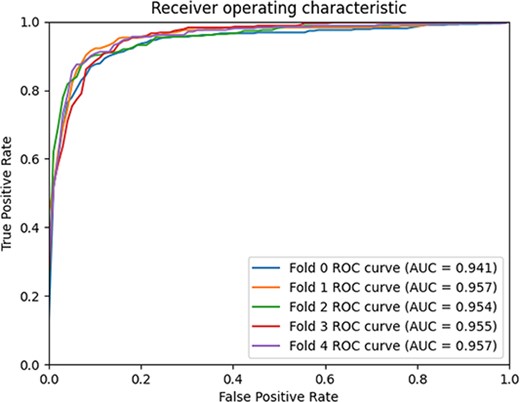
5-fold cross-validation ROC–AUC curve.
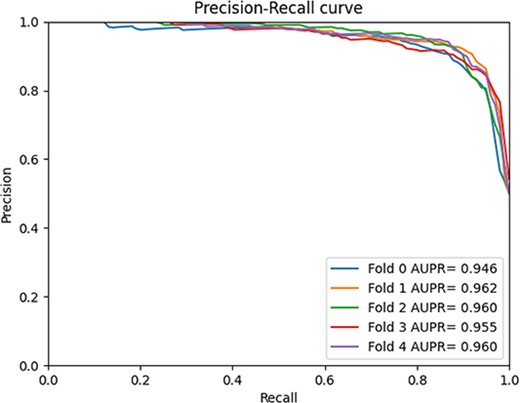
5-fold cross-validation AUPR curve.
From the Table 1, we observe that GMCLMDS outperforms the previous eight state-of-the-art (SOTA) models in all the metrics, achieving a comprehensive AUC, AUPR and F1 score of 95.28%, 95.66% and 89.77%, respectively. This indicates a significant improvement in the model’s generalization ability. Additionally, the recall and precision of GMCLMDS have increased by 6.56% and 3.14%, respectively, which suggests a significant enhancement in the model’s ability to identify sensitive associations while maintaining precision. This indicates that the improvement of GMCLMDS is comprehensive and meaningful. GMCLMDS has great practical significance for predicting miRNA-drug sensitivity.
Through the observation and analysis of other comparative models, we found that the main advantage of GCFMCL lies in the anti-noise ability brought by multi-view contrastive learning. In particular, feature contrastive learning can mine neighborhood information that does not exist in the topology structure, which corrects some errors caused by node heterogeneity in the graph collaborative filtering process, so that the feature information of miRNA (drug) is accurately expressed.
Performance of GCFMCL 5-fold cross-validation
| Fold | AUC | AUPR | Accuracy | Precision | Recall | F1 |
|---|---|---|---|---|---|---|
| 0 | 94.12% | 94.56% | 88.29% | 88.86% | 87.56% | 88.21% |
| 1 | 95.74% | 96.18% | 91.22% | 90.43% | 92.19% | 91.30% |
| 2 | 95.37% | 96.00% | 90.36% | 91.06% | 89.51% | 90.28% |
| 3 | 95.54% | 95.47% | 88.78% | 90.56% | 86.58% | 88.52% |
| 4 | 95.65% | 95.98% | 90.58% | 91.08% | 89.97% | 90.52% |
| Average | 95.28% | 95.66% | 89.85% | 90.40% | 89.17% | 89.77% |
DGNNMDA uses a two-channel heterogeneous network for feature aggregation by constructing a drug similarity matrix, which takes into account the propagation error caused by node heterogeneity, and its accuracy rate improves more compared with other models, but the accuracy rate does not change much, which indicates that the improvement of its ability to discriminate positive samples is not significant. It may be because of the use of one-hot encoding as the initial feature, resulting in similar features between heterogeneous nodes after dimensionality reduction processing. In contrast, we additionally use contrastive learning to distinguish different contrastive targets, which makes the model The ability to distinguish features is greatly improved.
GANLDA homogenizes heterogeneous nodes and subsequently uses graph attention network for feature aggregation of nodes, which ranks second in accuracy in comparison experiments, indicating that its ability to screen positive samples is better, which may be due to the effect brought by the attention mechanism. But GANLDA lacks consideration of feature similarity of homogeneous nodes and cannot perform feature aggregation of nodes without linking relationships, and also its performance on sparse graphs will be correspondingly poor, in contrast we compensate for the shortcomings of graph networks overly relying on linking relationships by topological contrastive learning and feature contrastive learning, which can also further reduce errors.
LGCMDS employs the LightGCN graph collaborative filtering algorithm to aggregate homogeneous and heterogeneous node information, while also considering the errors introduced by node heterogeneity. Although LGCMDS’s performance is also among the top models, it does not achieve the optimal performance, which may be due to the noise introduced during the aggregation process,incorporating a certain correction and compensation mechanism is expected to achieve better result.In contrast, we use multi-task to obtain multi-view loss information, constantly modify the model, and obtain better results.
Ablation experiment
To verify the role of contrastive learning in GCFMCL, we conduct ablation experiments. We discarded the contrastive learning part and retained the graph collaborative filtering and MLP part, the experimental results are shown in the Table 3.
Performance of 5-fold cross-validation for ablation experiments
| Fold | AUC | AUPR | Accuracy | Precision | Recall | F1 |
|---|---|---|---|---|---|---|
| 0 | 92.27% | 92.64% | 85.85% | 86.20% | 85.36% | 85.78% |
| 1 | 94.07% | 94.17% | 87.92% | 87.11% | 89.02% | 88.05% |
| 2 | 93.10% | 93.72% | 86.09% | 85.40% | 87.07% | 86.23% |
| 3 | 93.35% | 93.38% | 86.70% | 89.50% | 83.17% | 86.21% |
| 4 | 93.66% | 94.32% | 86.43% | 89.01% | 83.12% | 85.97% |
| Average | 93.29% | 93.64% | 86.60% | 87.44% | 85.54% | 86.45% |
Subsequently, we kept the topological contrastive learning and feature contrastive learning respectively, and re-performed the five-fold cross-validation experiment. The experimental results are shown in Tables 4 and 5, demonstrating the effectiveness of these two contrastive learning. In the ablation experiments, the improvement effect of topological contrastive learning is slightly larger than that of feature contrastive learning. This may be because feature contrastive learning is too dependent on the initial features of miRNAs (drugs), while topological contrastive learning can be combined with graph collaborative filtering to set contrastive targets. But the effect of the combination of the two is far greater than the effect of single contrastive learning.
Performance of ablation experiments with topological contrastive learning retained
| Fold | AUC | AUPR | Accuracy | Precision | Recall | F1 |
|---|---|---|---|---|---|---|
| 0 | 92.53% | 92.94% | 86.71% | 87.53% | 85.61% | 86.56% |
| 1 | 94.62% | 94.67% | 88.29% | 88.29% | 88.29% | 88.29% |
| 2 | 93.15% | 93.90% | 85.61% | 84.93% | 86.58% | 85.75% |
| 3 | 93.58% | 93.64% | 85.98% | 89.76% | 81.22% | 85.28% |
| 4 | 93.92% | 94.63% | 87.29% | 89.41% | 84.60% | 86.94% |
| Average | 93.56% | 93.96% | 86.78% | 89.79% | 85.26% | 86.56% |
Performance of ablation experiments with feature contrastive learning retained
| Fold | AUC | AUPR | Accuracy | Precision | Recall | F1 |
|---|---|---|---|---|---|---|
| 0 | 92.71% | 93.06% | 84.63% | 84.63% | 84.63% | 84.63% |
| 1 | 94.25% | 94.20% | 88.29% | 88.10% | 88.53% | 88.31% |
| 2 | 93.11% | 93.67% | 86.82% | 86.47% | 87.31% | 86.88% |
| 3 | 93.44% | 93.29% | 86.21% | 89.81% | 81.70% | 85.56% |
| 4 | 93.82% | 94.46% | 88.26% | 90.02% | 86.06% | 88.00% |
| Average | 93.46% | 93.74% | 86.84% | 87.81% | 85.65% | 86.68% |
Experimental results show that multi-view contrastive learning can bring considerable performance improvements to GCFMCL. The F1 index in the ablation experiment dropped greatly, indicating that the ability of the model to predict positive samples dropped significantly. Since contrastive learning can perform additional learning on the positive and negative contrast targets, the model can maximize the difference between positive and negative contrasts, so the discriminative ability of the model will be improved accordingly.
Case studies
To verify the reliability of GCFMCL, we selected Oxaliplatin, a diaminocyclohexane-containing platinum that has been widely used in the treatment of various human tumors, as the benchmark drug for the case study [45]. We first deleted the relevant data of Oxaliplatin-miRNA from the training data of the experiment, then verified the sensitivity scores of Oxaliplatin and the 413 miRNAs in the original data through GCFMCL, and finally sorted according to the scores, and selected the top 20 miRNAs with the highest scores for evaluation. Retrieval verification, as shown in Table 6, 15 of them exist in the original data set, which have been proven to regulate Oxaliplatin sensitivity.
Oxaliplatin case study
| Rank | MicroRNA | Definited or not | Rank | MicroRNA | Definited or not |
|---|---|---|---|---|---|
| 1 | miR-302c | Definited | 11 | miR-4763 | Definited |
| 2 | miR-662 | Undefinited | 12 | miR-377 | Definited |
| 3 | miR-509-3p | Definited | 13 | miR-636 | Definited |
| 4 | miR-010a | Undefinited | 14 | miR-365 | Definited |
| 5 | miR-125b | Definited | 15 | miR-3653 | Undefinited |
| 6 | miR-522 | Definited | 16 | miR-22 | Definited |
| 7 | miR-143 | Definited | 17 | miR-489 | Definited |
| 8 | miR-99a | Undefinited | 18 | miR-493* | Definited |
| 9 | miR-126* | Definited | 19 | miR-659 | Definited |
| 10 | miR-199b-5p | Undefinited | 20 | miR-520f | Definited |
Similarly, we selected miR-302c as the reference miRNA, as previous studies have shown that modulation of miR-302c expression can regulate the properties of various tumor cells [46, 47]. We predicted the sensitivity of miR-302c and 154 other drugs, and selected the top 10 drugs with the highest scores for validation, as shown in Table 7, with 8 of them propose in the original dataset. The experimental results demonstrate that GMCLMDS has a high degree of reliability. If the topology and feature information of the relevant miRNA (drug) are more abundant, the predictive performance can be further improved.
mir-302c case study
| Rank | Drug | Definited or not | Rank | Drug | Definited or not |
|---|---|---|---|---|---|
| 1 | Interferon | Definited | 6 | Vorinostat | Definited |
| 2 | Epirubicinhydrochloride | Definited | 7 | Sorafenib | Definited |
| 3 | Daunorubicin | Undefinited | 8 | Taxol | Definited |
| 4 | Oxaliplatin | Definited | 9 | Lapatinib | Undefinited |
| 5 | Melphalan | Definited | 10 | Chemotherapy | Definited |
DISCUSSION AND CONCLUSION
In recent years, researchers extensively investigated the role of miRNA in drug development from an academic perspective and in the past tense. They discovered that miRNA could function as drug targets or enhance drug action, and could influence various aspects of drug sensitivity, such as absorption, distribution, metabolism and excretion. Specifically, miRNA could regulate the expression of drug transport proteins, thereby affecting drug pharmacokinetics. Moreover, miRNA could also influence drug target expression, leading to changes in drug efficacy. Although numerous siRNA drugs have been approved for marketing [48, 49], the development of miRNA drugs faced significant challenges, with many miRNA drugs exhibiting severe side effects during clinical trials [50]. This indicates that we need to further understand miRNA-related information to accelerate drug research and development. Information on miRNA-drug sensitivity associations is particularly scarce, and we need further research and experimentation to determine the impact of miRNA on drug sensitivity. Utilizing accurate and reliable deep learning methods to assist in the biological study of miRNA drug sensitivity can effectively improve research efficiency, reduce research time and financial costs, promote the discovery of miRNA-drug sensitivity, and facilitate the development of targeted drugs.
We proposed GMCLMDS, a graph-collaborative filtering-based multi-view contrastive learning model. By aggregating neighborhood information through graph-collaborative filtering and employing topological contrastive learning and feature contrastive learning, the model mitigates the effects of noise and interaction sparsity caused by heterogeneous nodes. To our knowledge, GMCLMDS is the first model in the relevant field to use a graph-collaborative filtering-based multi-view contrastive learning approach. After extensive comparative experiments, we found that GMCLMDS surpassed previous state-of-the-art methods. In particular, the improvements in precision and accuracy demonstrate the model’s significantly enhanced ability to predict positive samples. This is because we considered the impact of data sparsity and heterogeneous nodes in bipartite graphs when designing the network structure, and improved the model’s discriminative ability for positive samples through contrastive learning, which previous methods did not address. To further evaluate the effectiveness of contrastive learning, we conducted multiple ablation experiments, the results of which indicated that the multi-view contrastive learning method substantially improved the model’s performance. Additionally, we carried out a bi-directional case study, providing strong evidence for the high reliability of the proposed GMCLMDS model. The model’s discriminative ability for positive samples has excellent targeted guidance for biochemical experiments, such as better revealing potential drug targets in drug development and offering new insights for drug research and development. Furthermore, the model can be used for drug screening, selecting drugs with good therapeutic effects for specific miRNA expression profiles. Therefore, GMCLMDS can promote progress in related fields and make more significant contributions.
However, the model has certain limitations. When the dataset contains a large number of isolated nodes, effective contrastive learning information cannot be obtained based on topological relationships. Due to the setting of contrastive learning objectives in topological contrastive learning, this leads to an increased false-negative probability. Moreover, we observed that during the 5-fold cross-validation process, the performance of certain rounds may be somewhat inferior to that of other rounds. We believe that during data partitioning, the link relationships of some sparse nodes may be further deprived, and related nodes may only have extremely sparse link relationships, or even no even-order neighbors, making it difficult for topological contrastive learning to function effectively. Consequently, an excessive number of isolated nodes and extremely sparse nodes may cause an imbalance in the model’s performance, resulting in adverse effects. In future research, we should pay particular attention to this aspect and attempt to address these issues through special treatment in the loss function or other areas, thereby minimizing the impact of missing topological relationships on predictive performance. We hope that GMCLMDS can not only be used for predicting miRNA drug sensitivity, but also that its contrastive learning methods can be universally applied in related sparse data, serving as a reference in the field of bioinformatics. Moreover, the prediction of miRNA-drug sensitivity has clear research potential and applications in the field of drug development. In the drug target discovery phase, miRNA-drug sensitivity can help investigate the regulatory role of miRNA in disease occurrence and progression, identify key genes and signaling pathways related to diseases, and reveal potential drug targets. In the drug screening phase, miRNA-drug sensitivity prediction techniques can be employed to select drugs with favorable therapeutic effects for specific miRNA expression profiles, thereby improving drug screening efficiency and accuracy. In the pharmacology and pharmacokinetics research phases, considering the impact of miRNA on drug sensitivity can facilitate a better understanding of drug action mechanisms and the scope of indications. We believe that GMCLMDS can play its due role in the aforementioned directions.
The GCFMCL model based on graph collaborative filtering can accurately predict miRNA-drug association, while simplifying operations in node aggregation and extending the generalization ability of the model.
The topological neighborhood contrastive learning strategy can mine topological information and alleviate the problem of insufficient neighborhood information.
The feature neighborhood contrastive learning strategy can reduce the noise impact brought by node topology contrastive learning, and alleviate the problem of sparse topological neighborhood.
DATA AVAILABILITY
All the data related to this research work have been made publicly available on GitHub.
Author Biographies
Jinhang Wei Affiliated with the College of Data Science and Artificial Intelligence, Wenzhou University of Technology.
Linlin Zhuo An Associate Professor at Wenzhou University of Technology and also affiliated with Neher’s Biophysics Laboratory for Innovative Drug Discovery, Macau University of Science and Technology.
Zhecheng Zhou Affiliated with the College of Data Science and Artificial Intelligence, Wenzhou University of Technology.
Xinze Lian A Professor at the College of Data Science and Artificial Intelligence, Wenzhou University of Technology.
Xiangzheng Fu Affiliated with Neher’s Biophysics Laboratory for Innovative Drug Discovery, Macau University of Science and Technology.
Xiaojun Yao Affiliated with Neher’s Biophysics Laboratory for Innovative Drug Discovery, Macau University of Science and Technology.
REFERENCES
Author notes
Jinhang Wei and Linlin Zhuo contributed equally to this work.
