


Abstract
MicroRNAs (miRNAs) are human post-transcriptional regulators in humans, which are involved in regulating various physiological processes by regulating the gene expression. The subcellular localization of miRNAs plays a crucial role in the discovery of their biological functions. Although several computational methods based on miRNA functional similarity networks have been presented to identify the subcellular localization of miRNAs, it remains difficult for these approaches to effectively extract well-referenced miRNA functional representations due to insufficient miRNA–disease association representation and disease semantic representation. Currently, there has been a significant amount of research on miRNA–disease associations, making it possible to address the issue of insufficient miRNA functional representation. In this work, a novel model is established, named DAmiRLocGNet, based on graph convolutional network (GCN) and autoencoder (AE) for identifying the subcellular localizations of miRNA. The DAmiRLocGNet constructs the features based on miRNA sequence information, miRNA–disease association information and disease semantic information. GCN is utilized to gather the information of neighboring nodes and capture the implicit information of network structures from miRNA–disease association information and disease semantic information. AE is employed to capture sequence semantics from sequence similarity networks. The evaluation demonstrates that the performance of DAmiRLocGNet is superior to other competing computational approaches, benefiting from implicit features captured by using GCNs. The DAmiRLocGNet has the potential to be applied to the identification of subcellular localization of other non-coding RNAs. Moreover, it can facilitate further investigation into the functional mechanisms underlying miRNA localization. The source code and datasets are accessed at http://bliulab.net/DAmiRLocGNet.
INTRODUCTION
MicroRNAs (miRNAs) are a kind of short and small non-coding RNAs [1–4]. In humans, miRNAs act as post-transcriptional regulators [1, 5–9], with many mature miRNAs regulating gene expression to impact various physiological activities [10–12]. The regulation of miRNAs is critical in processes like stress response, disease physiology and normal metabolism. Meanwhile, it is increasing evidence of a correlation between miRNA abnormalities and many diseases [1, 13–15], including cancer [16], Alzheimer’s disease [15] and cardiovascular diseases [14]. Moreover, subcellular location of miRNAs plays a critical role in their functionality, as it indicates that different subcellular locations may occur in different gene expressions [7, 11, 15]. Although there is evidence to suggest that miRNA plays a specific physiological function role with different cellular sites [10, 17], the functional expressions mechanism underlying subcellular localization [4] remains unclear [18–20]. In recent years, several computational methods have been established to identify the subcellular localizations of miRNAs. However, due to the length of miRNAs sequence (∼22 nucleotides), the subcellular localization of miRNA is hard to model and analyze [18, 21]. In addition, recent research suggests that RNA may coexist in multiple subcellular locations simultaneously [4, 22], which poses further challenges in predicting and understanding the functional mechanism of subcellular localization. The computational difficulty in predicting miRNA subcellular localization is to capture well-referenced features with richer representations of miRNA functionality.
In recent years, several machine-learning-based methodologies have been proposed to identify subcellular localizations of miRNA. Most of these methodologies are based on sequence information of miRNAs, utilizing different sequence feature representation schemes to predict subcellular localization of miRNA [23–26]. MiRLocator [22] is a machine-learning predictor that identifies miRNA subcellular localization using a deep encoder-decoder model based on miRNA sequence (MS) information. Prabina et al. [17] presented a computational methodology called miRNALoc, which uses structural properties, pseudo dinucleotide compositions and principal component scores of thermodynamics as features based on MS to classify subcellular localization. Muhammad et al. [18] proposed MirLocPredictor, a methodology base on convolutional neural network (CNN) and recurrent neural network, which uses KmerPR2vec, a novel representation scheme of MS information. Muhammad et al. [19] proposed a predictor of miRNA subcellular localization, named L2S-MirLoc, which uses a feature encoding scheme for extracting optimal vectorial representation of sequences using a lightweight-physicochemical-property approach. Zhang et al. [10] established iLoc-miRNA, a multi-head self-attention-based deep bidirectional long short-term memory network, which represents whole MSs by using one-hot encoding with post padding for differentiating extracellular miRNAs from intracellular miRNAs. In addition to sequence-based prediction methods, other methods use functional-similarity networks to distinguish the subcellular localizations including MirGOFS [27] based on GO semantic similarity network and MiRLoc [21] based on miRNA–disease association (MDA) similarity network. These methodologies take advantage of the functional similarities and associations between miRNA and different subcellular locations, which can provide valuable information for predicting miRNA subcellular localization.
Although these computational approaches have shown promising results, both the sequence-based [10, 17–19] and functional-similarity-network-based [21, 27] predictors have limitations due to the lack of a valid and comprehensive representation of MSs and functional features, which can lead to potential biases. However, current predictors rely solely on either sequence-based or functional-similarity-networks-based representations [10, 21]. To improve prediction accuracy, an efficient approach is to combine features derived from both sequence-based and functional-similarity-networks-based representations for identifying subcellular localizations of miRNAs. In order to capture well-referenced functional representations, it is crucial to extract discriminative MDA information and disease semantic (DS) representation to comprehensively represent the function feature of miRNA [13, 16, 28–35]. There is growing evidence that graph-convolutional networks (GCNs) [2, 12, 13, 36–38] can capture complex nonlinear associations in bioinformatics [36, 38, 39]. The functional representations of miRNA can be extracted from MDA and DS information using GCN.
Herein, we established a new prediction methodology called DAmiRLocGNet by using GCN [36, 40] and autoencoder (AE)-based methodology [16] for identifying miRNAs subcellular localizations. The DAmiRLocGNet considers both sequence information and functional representation information, enabling simultaneous learning for improved predictive performance. We utilized GCN to gather information from neighboring nodes and extract implicit network structure information from MDA and DS representation. The GCN-extracted node representations can comprehensively potential functional similarity network of miRNA from MDA information and DS information. In addition, we utilized AE to extract sequence information from MS similarity network. The experimental results illustrated that DAmiRLocGNet outperformed other competing methods, and the ablation study results further showed the advantages of DAmiRLocGNet. The datasets and source code are freely available at http://bliulab.net/DAmiRLocGNet.
METHODS
Overview
In this study, a miRNA subcellular localization predictor called DAmiRLocGNet is proposed, which is based on AE and GCN. The DAmiRLocGNet is carried out in five steps: (i) Data set, which involves collecting data on miRNA subcellular localization information, MDAs information, DS information and MS information. (ii) Data preprocessing, which involves the similarity measures used to preprocess similarity network representations from DS, MDA and MS information. (iii) GCN- and AE-based feature learning, which uses DS similarity network, MDA network and MS similarity network to design two feature representation learning methodologies for predicting miRNA subcellular localization. (iv) Prediction, which combines the GCN- and AE-based feature representation learning representations to obtain comprehensive potential miRNA functional representations and sequence features for prediction. (v) Result, which involves evaluating and displaying miRNA subcellular localizations using criteria. The architecture of DAmiRLocGNet is illustrated in Figure 1.
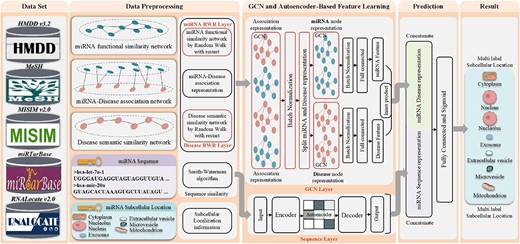
The overview of DAmiRLocGNet framework.
Data set
Differing from previous work [10, 18, 19, 21, 27], we used MS information, DS information and MDA information to construct the implicit functional representation of miRNA. We obtained miRNA subcellular localization dataset from literature [21], and seven subcellular localizations of miRNA were selected including exosome, nucleolus, microvesicle, nucleus, cytoplasm, mitochondrion and extracellular vesicle, which was collected by Xu et al. from the latest RNALocate2.0 database (http://www.rna-society.org/rnalocate) [41]. This database contains >210 000 RNA-associated subcellular localization entries with experimental evidence. The miRNA subcellular localization datasets, in which miRNA is associated with one or more compartments simultaneously within each compartment, are described in detail in Table 1. For the statistical information, see Supplementary Figure S1. In addition, we downloaded the sequence from miRBase (https://www.mirbase.org/), which provides comprehensive documentation of miRNA annotations.
The miRNA subcellular localization datasets
| Component | 1 | 2 | 3 | 4 | 5 | 6 | 7 | Overall |
|---|---|---|---|---|---|---|---|---|
| Cytoplasm | 0 | 8 | 16 | 94 | 88 | 61 | 41 | 308 |
| Exosome | 25 | 331 | 191 | 130 | 91 | 61 | 41 | 870 |
| Nucleolus | 0 | 0 | 0 | 2 | 3 | 21 | 41 | 67 |
| Nucleus | 18 | 18 | 144 | 127 | 90 | 61 | 41 | 499 |
| Extracellular vesicle | 0 | 0 | 5 | 6 | 9 | 41 | 41 | 102 |
| Microvesicle | 2 | 321 | 179 | 130 | 91 | 61 | 41 | 825 |
| Mitochondrion | 1 | 2 | 41 | 31 | 83 | 60 | 41 | 259 |
| Overall locative samples | 47 | 682 | 579 | 524 | 460 | 372 | 294 | 2930 |
| Overall actual samples | 1041 | |||||||
To obtain information on the network representations of miRNA function similarity, we collected MDA data from human miRNA disease database (HMDD) v3.2 [42], which documents association terms between miRNAs and human diseases that are experimentally supported and can be accessed at http://www.cuilab.cn/hmdd. From HMDD v3.2, we collected experimentally supported associated entities and diseases that were matched with miRNAs [8, 43], resulting in 15 547 experimentally confirmed MDAs involving 640 diseases. These associations were represented in Supplementary Figure S2, from which we can see that miRNAs may be associated with one or more diseases. The information about subcellular localization and disease association is depicted in Table 2.
Overview of the data used in this work
| miRNA | HMDD v3.2 terms positive | Disease | Localization |
|---|---|---|---|
| 1041 | 15 547 | 640 | 7 |
| miRNA | HMDD v3.2 terms positive | Disease | Localization |
|---|---|---|---|
| 1041 | 15 547 | 640 | 7 |
Overview of the data used in this work
| miRNA | HMDD v3.2 terms positive | Disease | Localization |
|---|---|---|---|
| 1041 | 15 547 | 640 | 7 |
| miRNA | HMDD v3.2 terms positive | Disease | Localization |
|---|---|---|---|
| 1041 | 15 547 | 640 | 7 |
Data preprocessing
DS similarity
The medical subject heading (MeSH) is used for analysis of biomedical and health-related information, which descriptors can be downloaded at https://www.nlm.nih.gov/mesh/meshhhome.html. In the MeSH, the disease information can be represented as an abstract data structure that is used to generate directed acyclic graph (DAGs) [44]. In DAGs, the diseases represent vertex and the edges are encoded with directed links from parent disease nodes to child disease nodes. In this study, the MeSH was employed to accurately describe the semantic similarity information of disease, which was available for computing the association between different diseases [45]. Definition of disease |${A}^{{\prime}}$|s contribution to disease |${t}^{{\prime}}$|s semantic value as follows:
where |$\varDelta$| is the decaying parameter set as 0.5 [45]. The disease |$A$| semantic value can be represented as |$DS(A)={\Sigma}_{t\epsilon{P}_A}{D}_A(t)$|, where |${P}_A$| is the ancestors of disease |$t$| set. Hence, the definition of semantic similarity between two diseases as follows:
where |${P}_A$| and |${P}_B$| represent the set of diseases |$A$| ancestors and |$B$| ancestors, respectively.
MiRNA functional similarity
When two miRNAs are similar in sequence or function, they may exhibit similar patterns of function expression [2, 29]. This functional similarity is significant because it can be used to identify similarities between related diseases. In the study, Wang’s methods [45] were used to obtain the functional similarity of miRNAs. These methods hypothesize that the functional similarities between miRNAs are likely to have an impact on similar diseases [1]. Specifically, the definition of similarity between a set of diseases |$DG$| and disease |${d}_i$| is calculated as |$DS{G}_{d_i}(DG)={\mathit{\max}}_{B\in DG}\left( DS\left({d}_i,B\right)\right)$|. Assumed that |${\mathcal{D}}_i$| represents the set of disease related with miRNA |${m}_i$|, the functional similarity between miRNA |${m}_1$| and miRNA |${m}_2$| is then represented as
The similarity of Gaussian interaction profile (GIP) kernel
In this study, two similar miRNAs may exhibit similar patterns of function expression, and therefore miRNAs may be associated with one or more diseases. The GIP kernel similarity [46] was used, based on the hypothesis that similar miRNAs in interaction networks show similar patterns of action in diseases, meaning that similar miRNAs exhibit similar interaction behavior. Assumed MDA matrix is |$MD$|, the GIP kernel similarity between miRNA |${m}_1$| and miRNA |${m}_2$| is defined as follows:
where |$IP\left({m}_i\right)$| and |$IP\left({m}_j\right)$| represent the |$i{th}$| and |$j{th}$| rows of the |$MD$|, respectively. The parameter |${\lambda}_m$| is calculated by |$\frac{n_m}{\sum_{i=1}^{n_m}\parallel IP\left({m}_i\right){\parallel}^2}$|, where |${n}_m$| represent the number of miRNAs.
Similarly, the GIP kernel similarity between diseases |${d}_i$| and diseases |${d}_j$|is defined as follows:
where |$IP\left({d}_i\right)$| and |$IP\left({d}_j\right)$| represent the |$i\mathrm{th}$| and |$j\mathrm{th}$| columns of the |$MD$|, respectively. The parameter |${\lambda}_d$| is calculated by |$\frac{n_d}{\sum_{i=1}^{n_d}\parallel IP\left({d}_i\right){\parallel}^2}$|, where |${n}_d$| represent the number of diseases.
MS similarity
The sequence characteristics reflect their biological activities and can be used to understand biological activities. Due to miRNAs play an important role in regulating gene expression and are involved in various biological processes, MS similarity has been utilized for predicting MDA [2, 16, 30, 47], and various approaches have been developed to measure sequence similarity [48] that captures the sequence characteristics. The Smith–Waterman algorithm [36, 49], which is widely used for calculating similarities between pairs of MS, was utilized in measuring sequence similarity. It can be calculated as follows:
where |${SW}\left({m}_i,{m}_j\right)$| represents the similarity between miRNA |${m}_i$| and miRNA |${m}_j$|. |${sp}\left({m}_i,{m}_j\right)$| represents local alignment score between miRNA |${m}_i$| and miRNA |${m}_j$| based on the Smith–Waterman algorithm.
Similarity matrix completion and feature fusion
The similarity measurement methods described above, such as MS similarity, miRNA functional similarity and DS similarity, often produce sparse matrices. In addition, the precursor sequences of some miRNAs cannot be found in the miRBase database. In this study, we employed the GIP kernel similarity to supplement the missing entries including the DS similarity |$DS\left({d}_i,{d}_j\right)$|, the functional similarity of miRNA |$MS\left({m}_i,{m}_j\right)$| and MS similarity information |$SW\left({m}_i,{m}_j\right)$|. Therefore, the similarity completion metrics are calculated as follows:
Random walk restart representation
In order to capture overall structure information of the similarity matrix network, in this study, the random walk restart (RWR) [50] was applied to the DS similarity network and the functional similarity network of miRNA. This involved starting with an initial probability for each miRNA and transitioning from the current node to its neighbors, based on the weight of the edges in the similarity network. The similarity information network can be effectively preserved by using random walk sequences [36], which convert the original similarity network data into a linear structure in the form of a sequence of nodes [36]. Therefore, the RWR was implemented as following iteration equation:
where |${P}_{{i},{j}}^{{k}}\left({i}\right)$| describes the random walking probability from miRNA or disease node |${p}_{i}$| to node |${p}_{j}$| after k steps. |${e}_{i}$| describes the initial vector of miRNA or disease |${p}_{i}$|, which is the row vector of an identity matrix.
GCN-based and AE-based feature learning
GCN-based feature learning
GCN has been widely used in various fields [13, 36, 40, 43], owing to its remarkable ability to capture complex structural information and implicit interaction patterns. In this study, GCN was employed to extract representation. A key step in our approach was to extract MDA network information through GCN. GCN can acquire information from neighboring nodes and capture the implicit information of network structure, enabling it to effectively extract the distinguishing features of nodes.
According to literature [36, 40], let |${H}^{{l}}\in{\mathrm{R}}^{{d}}$| represents vertex representation of |${l}$|th GCN layer, the vertex representation |${H}^{{l}+\mathrm{1}}\in{\mathrm{R}}^{{d}}$| can be calculated by |$\left({l}+\mathrm{1}\right)$|-th GCN layer as follows:
where |$S$| represents the adjacency matrix of network node associations, |$I$| represents identity matrix, |$\overset{\sim }{D}$| represents the degree matrix of |$\overset{\sim }{S}$|, |${W}^{{l}}$| represents the model trainable parameter matrix and |${\sigma} \left(\bullet \right)$| represents nonlinear activation function.
As shown in Figure 1, two GCN modules were employed to extract feature representations of miRNA and disease nodes. The association representation GCN was designed to capture node embedding representations from MDA networks, which are represented as |${{G}}_{{asso}}=\left\{{{V}}_{{p}},{{V}}_{{d}},{{E}}_{{p}-{d}}\right\},$|where |${{V}}_{{p}}$| and |${{V}}_{{d}}$| represent miRNA and disease node representations, respectively, and |${{E}}_{{p}-{d}}$| represents the association between miRNA and disease nodes.
In this study, miRNA and disease node representation were generated from heterogeneous similarity networks using GCN to capture miRNA functional similarity and DS features. Specifically, the MDA representation GCN module learned miRNA and disease node representations by combining neighbor heterogeneous node from the miRNA–disease interaction network. The miRNA and disease representation GCN modules further extracted node features by aggregating homology node information. Ultimately, the outputs of these two modules were inner-producted to redefine the miRNA functional feature representation.
AE-based feature learning
The sequence is essential for analyzing cellular processes and has been applied in diverse bioinformatics fields, such as therapeutic peptide recognition [51, 52], identification of intrinsically disordered proteins/regions [53, 54], RNA binding protein [55–57], RNA and disease association [48, 58–60], subcellular localization prediction [61–65], etc. To extract sequence information from MS similarity, AE was employed to extract sequence features. By AE, implicit similarity can be preserved within the low-dimensional representation of the similarity network of MS.
AE consists of an encoder and a decoder. Assumed the input space |${X}\in{\mathcal{X}}$| and feature space |${h}\in{\mathcal{F}}$|. AE solves the mapping between |${f}$| and |${g}$|, and minimizes the reconstruction error.
As illustrated in Figure 1, the MS similarities were utilized as inputs and translated into low-dimensional vector representations to capture the discriminative features of the MSs within the input data. This was done to ensure that these discriminative features were preserved.
Model training and test
In this study, we trained the DAmiRLocGNet model using GCN and AE, which considered both MS representations and MDA similarity network representations to predict subcellular localizations. The final prediction model, denoted by M, is a concatenation of the output of GCN and AE, which can be calculated as
where |${{M}}_{{seq}}$| is the MS similarity network, |${{M}}_{{mdas}}$| represents the implicit functional features generated from the MDA, DS similarity network and similarity network of miRNA function.
The proposed method used GCN and AE to predict subcellular localization of miRNA. The training loss function considers both sequence loss information and miRNA–disease similarity network loss information. To process the training loss of the target label and predicted label of subcellular localization, binary cross-entropy (BCE) was introduced. The mean squared error (MSE) was used to measure the training loss between the input and output of MS. The loss function of sample |${Loss}$| can be calculated as below:
where |$p,y$| denote the probability value and ground truth value, respectively. N represents the number of samples in each batch, and M represents the index of subcellular locations.
We trained the prediction model and evaluated its performance using 10-fold cross-validation. The deep learning model was implemented using PyTorch 1.9.1, Scikit-learn and PyTorch Geometric. The model training and test were performed using GPU Nvidia TITAN RTX v100. For the hyperparameter optimal, such as the number of layers, the restart probability of RWR algorithm |$\alpha$| and learning rare |$lr$|. In order to find the optimum hyperparameters, the grid optimization method was used (Supplementary Table S1).
Performance evaluation
To evaluate the model prediction performance [21], we utilized measurement metrics including precision, sensitivity (Sn) and specificity (Sp) to evaluate the presented method and other competing methods [66, 67]. We also plotted receiver operating characteristic (ROC) [68] curve and precision-recall (PR) curve to visualize model performance. The area under the PR curve (AUPR) and the area under the ROC curve (AUC) were also implemented to assess model the performance [69]. The criteria of evaluation are calculated as follows:
where TN, TP, FN and FP represent the number of true negatives, true positives, false negatives and false positives, respectively.
RESULTS AND DISCUSSION
Performance comparison with different prediction methods
To assess the performance of DAmiRLocGNet in miRNA subcellular localization prediction, we compared DAmiRLocGNet with existing predictors by using 10-fold cross-validation. However, existing methods rely solely on sequence information or miRNA functional similarity information (Supplementary Table S2), DAmiRLocGNet considers both sequence information and miRNA functional similarity information. The other methods cannot be directly compared with our methods because the corresponding source code cannot be used [10]. It should be noted that there are some miRNAs in the dataset for which the corresponding sequences cannot be found, the results of MirLocPredictor are measured from a subset of the MiRLoc dataset after removing data where the sequence cannot be found. In other words, DAmiRLocGNet can predict the subcellular localization of miRNAs without sequences.
The comparison of performance is shown in Tables 3 and 4, the following conclusions can be drawn: (i) The DAmiRLocGNet outperforms the MiRLoc, indicating that integrating the DS information into miRNA functional feature representation is a more efficient way for predicting subcellular localization of miRNA. (ii) The performance of DAmiRLocGNet and MiRLoc is superior to the sequence-based methods. The reason is that the predictor embedding feature incorporates miRNA functional feature representation. In particular, DAmiRLocGNet outperforms these methods in all subcellular localization in terms of AUC. The subcellular performance of cytoplasm, exosome, nucleolus, nucleus, extracellular vesicle, microvesicle and mitochondrion in terms of AUC are 0.8606, 0.7051, 0.9289, 0.7960, 0.8350, 0.6757 and 0.8332, respectively. Overall, the AUPR obtained by DAmiRLocGNet achieves promising results. DAmiRLocGNet outperforms the competing methods in subcellular of nucleolus, extracellular vesicle and mitochondrion are 0.5739, 0.4619 and 0.6882, respectively. DAmiRLocGNet achieved similar performance compared with the competing methods for predicting the rest of subcellular positions in terms of AUPR. These results demonstrate that the predictor can effectively improve the predictive performance. In addition, the performance comparison with sequence features extracted from iLearnPlus and trained seven different basic predictors can be seen in Supplementary Tables S3–S24, from which we can know that the proposed method DAmiRLocGNet outperforms the traditional methods.
Performance comparison in terms of AUC
| Compartment | Methods | |||
|---|---|---|---|---|
| MiRLoca | MirLocPredictorb | TextRNNc | OUR | |
| Cytoplasm | 0.8218 | 0.5741 | 0.5487 | 0.8606 |
| Exosome | 0.5751 | 0.5842 | 0.5414 | 0.7051 |
| Nucleolus | 0.8371 | 0.5286 | 0.5050 | 0.9289 |
| Nucleus | 0.7756 | 0.6752 | 0.6301 | 0.7960 |
| Extracellular vesicle | 0.8003 | 0.6335 | 0.6282 | 0.835 |
| Microvesicle | 0.5099 | 0.5973 | 0.5798 | 0.6757 |
| Mitochondrion | 0.7694 | 0.6758 | 0.6324 | 0.8332 |
| AVG | 0.7270 ± 0.12003 | 0.6098 ± 0.05053 | 0.5808 ± 0.04731 | 0.8049 ± 0.08755 |
Note: The bold value is the maximum value of the row.
The results from MiRLoc RWR algorithm with MS information.
The results from MirLocPredictor with sequence information, and dataset is subset of a.
The results from TextRNN with sequence information, and dataset is subset of a.
Performance comparison in terms of AUPR
| Compartment | Methods | |||
|---|---|---|---|---|
| MiRLoca | MirLocPredictorb | TextRNNc | OUR | |
| Cytoplasm | 0.662 | 0.8391 | 0.8267 | 0.7636 |
| Exosome | 0.974 | 0.8248 | 0.8072 | 0.9248 |
| Nucleolus | 0.2185 | 0.4925 | 0.4838 | 0.5739 |
| Nucleus | 0.8021 | 0.4349 | 0.3773 | 0.7961 |
| Extracellular vesicle | 0.2916 | 0.3434 | 0.3322 | 0.4619 |
| Microvesicle | 0.9203 | 0.2469 | 0.2258 | 0.8883 |
| Mitochondrion | 0.5277 | 0.3113 | 0.2567 | 0.6882 |
| AVG | 0.6280 ± 0.27452 | 0.4990 ± 0.22328 | 0.4728 ± 0.23108 | 0.7281 ± 0.16564 |
Note: The bold value is the maximum value of the row.
The results from MiRLoc RWR algorithm with MS information.
The results from MirLocPredictor with sequence information, and dataset is subset of a.
The results from TextRNN with sequence information, and dataset is subset of a.
Performance in each subcellular location
We used the PR curve and the ROC curve to evaluate the performance of each subcellular location prediction. The performance of DAmiRLocGNet on different subcellular locations is shown in Figure 2. The results indicate that the AUC for cytoplasm, exosome, nucleolus, nucleus, extracellular vesicle, microvesicle and mitochondrion are 0.8581, 0.6988, 0.9156, 0.7934, 0.8390, 0.6700 and 0.8287, respectively. The AUPR for cytoplasm, exosome, nucleolus, nucleus, extracellular vesicle, microvesicle and mitochondrion are 0.7187, 0.8950, 0.4477, 0.7668, 0.3531, 0.8545 and 0.6588, respectively. Moreover, to estimate the effect of random seeds of the deep learning model on the stability of model performance and SD, the performance is shown in Supplementary Figure S3. The performance of RWR algorithm and 10-fold cross-validation can be seen in Supplementary Figures S4–S7.
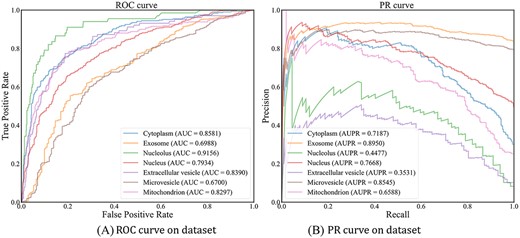
Performance on PR and ROC curve.
Identifying DAmiRLocGNet’s essential component
To further assess the impact of each component of DAmiRLocGNet on its prediction performance, we carried out an ablation study. We retrained the model by individually removing each component, which include Sequence layer, GCN layer, Disease RWR and MiRNA RWR. (i) Sequence layer that extracts sequence information from MS similarity through AE. (ii) GCN layer that extracts miRNA function representation from miRNA function similarity network, DS similarity network and MDA network. (iii) Disease RWR layer that provides deep structural information re-representation of DS similarity network through restart random walk representation. (iv) MiRNA RWR layer that provides deep structural information re-representation of miRNA functional similarity network through restart random walk representation.
According to the results, the AUC/AUPR results from Tables 5 and 6 suggest that the most important component of DAmiRLocGNet is GCN layer, as it significantly improves the model performance. Furthermore, the overall predictive capability of the model is improved by incorporating the DS similarity network suggesting that miRNA and disease association networks play a crucial role. While RWR layers of miRNA and disease are important, the results indicate that it is not as crucial as the GCN layer and the DS similarity layer. In conclusion, although each component of DAmiRLocGNet can improve the model performance, the layer associated with the DS similarity layer is the crucial and essential ingredient. The average performance of different feature components of DAmiRLocGNet at six subcellular locations can be seen in Supplementary Figure S8, from which we can see that the feature importance rank as follows: miRNA functional representation features extracted from MDAs, miRNA Functional similarity and MS features.
The performance of DAmiRLocGNet on AUC
| Ablation settings | Cytop | Exos | Nucleo | Nucle | EV | Microv | Mitochon | |||
|---|---|---|---|---|---|---|---|---|---|---|
| a | b | c | d | |||||||
| ✓ | 0.5789 | 0.5611 | 0.4012 | 0.4654 | 0.469 | 0.4011 | 0.5108 | |||
| ✓ | ✓ | 0.8517 | 0.5995 | 0.9206 | 0.7874 | 0.8338 | 0.5948 | 0.8236 | ||
| ✓ | ✓ | ✓ | 0.8632 | 0.6619 | 0.9357 | 0.7939 | 0.8467 | 0.6487 | 0.8384 | |
| ✓ | ✓ | ✓ | 0.8492 | 0.5923 | 0.9292 | 0.7817 | 0.8414 | 0.5609 | 0.8303 | |
| ✓ | ✓ | ✓ | ✓ | 0.8641 | 0.6828 | 0.9329 | 0.7978 | 0.8384 | 0.6614 | 0.8336 |
a: Sequence layer; b: GCN layer; c: miRNA RWR layer; d: disease RWR layer. Cytop: cytoplasm, Exos: exosome, Nucleo: nucleolus, Nucle: nucleus, EV: extracellular vesicle, Microv: microvesicle and Mitochon: mitochondrion.
The performance of DAmiRLocGNet on AUPR
| Ablation settings | Cytop | Exos | Nucleo | Nucle | EV | Microv | Mitochon | |||
|---|---|---|---|---|---|---|---|---|---|---|
| a | b | c | d | |||||||
| ✓ | 0.4863 | 0.8884 | 0.1581 | 0.5848 | 0.1502 | 0.8224 | 0.3812 | |||
| ✓ | ✓ | 0.7441 | 0.8882 | 0.5082 | 0.7860 | 0.4490 | 0.8553 | 0.6737 | ||
| ✓ | ✓ | ✓ | 0.7681 | 0.9092 | 0.6005 | 0.7936 | 0.5013 | 0.8784 | 0.6968 | |
| ✓ | ✓ | ✓ | 0.7381 | 0.8913 | 0.5359 | 0.7813 | 0.4381 | 0.8480 | 0.6774 | |
| ✓ | ✓ | ✓ | ✓ | 0.7687 | 0.9141 | 0.5784 | 0.7946 | 0.4613 | 0.8797 | 0.6963 |
a: Sequence layer; b: GCN layer; c: miRNA RWR layer; d: disease RWR layer. Cytop: cytoplasm, Exos: exosome, Nucleo: nucleolus, Nucle: nucleus, EV: extracellular vesicle, Microv: microvesicle and Mitochon: mitochondrion.
The effectiveness of GCN layers
The proposed method utilizes GCN layers to aggregate information from MDA neighbor nodes, and obtain a comprehensive miRNA function vector representation for miRNA subcellular localization prediction. However, the number of GCN layers can affect the prediction performance. We further evaluated the effectiveness of various GCN layer numbers on AUC and AUPR, and the result is illustrated in Tables 7 and 8.
The effectiveness of the GCN layers of DAmiRLocGNet in terms of AUC
| GCN layer number | Cytoplasm | Exosome | Nucleolus | Nucleus | Extracellular vesicle | Microvesicle | Mitochondrion |
|---|---|---|---|---|---|---|---|
| 0 | 0.5294 | 0.5153 | 0.5406 | 0.4975 | 0.5468 | 0.4905 | 0.5046 |
| 1 | 0.8606 | 0.7051 | 0.9289 | 0.7960 | 0.8350 | 0.6757 | 0.8332 |
| 2 | 0.8407 | 0.5563 | 0.9040 | 0.7726 | 0.8279 | 0.5331 | 0.8207 |
| 3 | 0.5404 | 0.4527 | 0.4592 | 0.4983 | 0.4584 | 0.4781 | 0.4876 |
The effectiveness of the GCN layers of DAmiRLocGNet in terms of AUPR
| GCN layer number | Cytoplasm | Exosome | Nucleolus | Nucleus | Extracellular vesicle | Microvesicle | Mitochondrion |
|---|---|---|---|---|---|---|---|
| 0 | 0.3725 | 0.8676 | 0.1075 | 0.5228 | 0.1692 | 0.8210 | 0.2973 |
| 1 | 0.7636 | 0.9248 | 0.5739 | 0.7961 | 0.4619 | 0.8883 | 0.6882 |
| 2 | 0.7434 | 0.8778 | 0.4567 | 0.7645 | 0.4091 | 0.8327 | 0.6572 |
| 3 | 0.3871 | 0.8637 | 0.1770 | 0.5702 | 0.3805 | 0.8244 | 0.3501 |
As shown in Tables 7 and 8, these results indicate that: (i) DAmiRLocGNet becomes a poor predictor without the GCN module, while it performs better when the disease association network extracted by the GCN module is added; (ii) The optimal performance of DAmiRLocGNet is achieved when a single GCN layer is added, and performance decreases when more than one layer is added. The possible reason for this is that in a network of miRNA and gene interactions, information related to a specific miRNA and gene is dispersed within a limited neighborhood of nodes. This neighborhood reflects a unique set of interactions, including proximate and remote ones. The proximate nodes represent directly related nodes, while the remote nodes outside this neighborhood may contain irrelevant and potentially misleading information. Therefore, DAmiRLocGNet with more GCN layers tends to utilize more remote nodes, ultimately compromising the predictive ability of the model.
CONCLUSION
In this study, we proposed DAmiRLocGNet, a GCN- and AE-based deep learning method for identifying subcellular localizations of miRNAs. The results indicate that DAmiRLocGNet outperforms other competing approaches. The superior performance is attributed to three main factors: (i) the use of MDA and DS information, which allows us to construct a comprehensive miRNA functional representation that covers more discriminative interactions informative; (ii) the efficient extraction of miRNA functional structure information and sequence association correlation using GCN- and AE-based method; and (iii) the use of fully connected networks to extract the MDA, DS and MS features, which enables us to effectively capture meaningful and discriminative vectorial representations for prediction. The datasets and source code of DAmiRLocGNet are accessed online at http://bliulab.net/DAmiRLocGNet.
While DAmiRLocGNet has shown promising results in miRNA subcellular localization prediction, some limitations should be considered. (i) The performance of DAmiRLocGNet is dependent on the quality of functional-similarity-networks-based representations. Improvements in the accuracy of these functional-similarity-networks-based representations could lead to better prediction results. (ii) Incorporating additional sequence-based features, such as evolutionary conservation, physiochemical properties and amino acid composition, may help to improve the accuracy of subcellular localization prediction. We intend to address these limitations in future research and improvements.
In this study, we proposed DAmiRLocGNet, a GCN and AE-based method to identify the subcellular localizations of miRNA.
DamiRLocGNet incorporates sequence information, DS information and MDA information into the GCN for comprehensive miRNA potential functional representation.
Experimental results show that DAmiRLocGNet is superior to other competing computational approaches. The datasets and source code of DAmiRLocGNet are accessed online at http://bliulab.net/DAmiRLocGNet.
FUNDING
National Natural Science Foundation of China (Nos. U22A2039, 62271049 and 62250028).
CODE AND DATA AVAILABILITY
The datasets and source code of DAmiRLocGNet are accessed online at http://bliulab.net/DAmiRLocGNet.
Author Biographies
Tao Bai is a doctoral candidate at the School of Computer Science and Technology, Beijing Institute of Technology, Beijing, 100081, China. He is also a lecturer at the School of Mathematics & Computer Science, Yan’an University, Shaanxi, 716000, China. His research interests include bioinformatics, natural language processing and machine learning.
Ke Yan is currently an assistant professor at the School of Computer Science and Technology, Beijing Institute of Technology University, Beijing, China. His research interests include bioinformatics, pattern recognition and machine learning.
Bin Liu, PhD, is a professor at the School of Computer Science and Technology, Beijing Institute of Technology, Beijing, China. His expertise is in bioinformatics, natural language processing and machine learning.
