


Abstract
Loss of solubility usually leads to the detrimental elimination of protein function. In some cases, the protein aggregation is also required for beneficial functions. Given the duality of this phenomenon, it remains a fundamental question how natural selection controls the aggregation. The exponential growth of genomic sequence data and recent progress with in silico predictors of the aggregation allows approaching this problem by a large-scale bioinformatics analysis. Most of the aggregation-prone regions are hidden within the 3D structure, rendering them inaccessible for the intermolecular interactions responsible for aggregation. Thus, the most realistic census of the aggregation-prone regions requires crossing aggregation prediction with information about the location of the natively unfolded regions. This allows us to detect so-called ‘exposed aggregation-prone regions’ (EARs). Here, we analyzed the occurrence and distribution of the EARs in 76 reference proteomes from the three kingdoms of life. For this purpose, we used a bioinformatics pipeline, which provides a consensual result based on several predictors of aggregation. Our analysis revealed a number of new statistically significant correlations about the presence of EARs in different organisms, their dependence on protein length, cellular localizations, co-occurrence with short linear motifs and the level of protein expression. We also obtained a list of proteins with the conserved aggregation-prone sequences for further experimental tests. Insights gained from this work led to a deeper understanding of the relationship between protein evolution and aggregation.
INTRODUCTION
Proteins are usually soluble molecules interacting transiently with each other or the other biomolecules. After performing their functions, they are degraded by proteases. Thanks to the dynamic balance between protein synthesis and degradation, living organisms can efficiently regulate many different processes. However, occasionally, some proteins, often for not entirely clear reasons, form aggregates having either fibrillar or amorphous structures [1]. Many of the fibrillar aggregates have the characteristic structure of amyloid fibrils. The amyloid protofibrils are typically straight, around 10 nm in diameter, thermostable, protease resistant and rich in β-structure [1]. In vivo, the protofibrils accumulate in amyloid plaques, which range in diameter from 10 μm to several hundred micrometers. The plaques are insoluble and frequently are linked to a variety of age-related diseases including Alzheimer’s disease and Parkinson’s disease [2]. In some cases, the amyloid fibrils (named prions) can be ‘infectious agents’. The prion fibrils, which are found themselves in another organism or a cell, can trigger the formation of similar fibrils and cause transmissible neurodegenerative diseases [3]. The amyloid deposits can not only be composed of copies of the same protein but also represent co-aggregates of two or more proteins and by doing so simultaneously impair several biological processes [4]. At the same time, not all amyloid fibrils are linked to diseases. An increasing number of studies describe so-called ‘functional’ amyloids, which fulfill beneficial roles in the organism [5, 6]. For example, curli proteins from some gram-negative bacteria form amyloid fibrils on the bacterial surface. They are involved in biofilm formations, which is a successful strategy allowing microorganisms to resist the threats of the environment (UV radiation, oxygen, desiccation, etc.) [7]. Other examples from mammals are RIP1 and RIP3 proteins whose co-aggregation into amyloid fibrils mediates a key interaction of necroptosis signaling [8, 9].
Despite great interest in protein aggregation, especially regarding amyloids, scientists have focused on a few of the most devastating amyloidoses or known cases of functional amyloids. However, the overall prevalence of the protein aggregation in organisms is not yet well studied. This analysis requires computational methods for in silico prediction of the aggregation. The propensity to form aggregates is coded by the amino acid sequence; therefore, several computational programs have been developed [10–18]. Availability of the computational tools for prediction of aggregation-prone regions made it possible to obtain a more general view of this phenomenon by using in silico analysis of the whole-proteome data. Previous in silico studies revealed a number of interesting observations [14, 19–28]. For example, a study of six proteomes (Paramecium tetraurelia, Saccharomyces cerevisiae, Caenorhabditis elegans, Drosophila melanogaster, Mus musculus and Homo sapiens) using a specially developed algorithm demonstrated that the average aggregation propensity of a proteome correlates inversely with the complexity and longevity of the studied organisms [29]. In another analysis of the proteomes of D. melanogaster, S. cerevisiae and C. elegans using TANGO predictor [13], it was shown that proteins, which are essential to organism fitness (knockdown of these genes leads to lethality), have a lower aggregation score than non-essential proteins [23]. Analysis of the human proteome by the Zyggregator method [30, 31] suggested that proteins involved in the secretion pathway are more prone to aggregation compared to non-membrane proteins in general [27]. Application of the 3D profile method to Escherichia coli, S. cerevisiae and H. sapiens proteomes showed that the predicted high propensity for amyloid formation does not reflect well the limited number of proteins involved in disease-related or functional amyloid deposits [26]. The same analysis of proteins from PDB suggested that most of the predicted aggregation-prone regions are hidden within the 3D protein structure and, therefore, inaccessible for intermolecular interactions such as aggregation [32]. The analysis of cytosolic bacterial (E. coli) and eukaryotic (H. sapiens) proteomes indicated that the aggregation propensity of proteins inversely correlates with their abundance [19–21]. Most of these data are in agreement with the conclusion that the evolutionary pressure acts on the proteins to minimize their aggregation propensity.
Several publications have reported that proteomes contain a very high percentage of proteins with amyloidogenic or aggregation-prone regions (ARs), which is in obvious conflict with a small number of the known proteins involved in amyloidoses [28]. It was explained by the fact that most of the predicted ARs are hidden within the 3D structure preventing aggregation [33]. Conversely, in most known cases of amyloidosis, the native conformation of the polypeptide chains that form amyloid deposits in vivo is unfolded (or intrinsically disordered). Thus, to get a more realistic census of the aggregation-prone regions in proteomes, it is necessary to cross aggregation prediction with information about the location of the intrinsically disordered regions (IDRs). IDRs are always exposed for the intermolecular interactions critical for aggregation. Although the idea of linking the prediction of aggregation regions and IDRs was formulated some time ago [31], nowadays it is rapidly gaining ground [10, 17, 33, 34]. For example, recently, the prevalence of ARs in the DisProt dataset of IDRs, which are manually curated from literature [35], was explored by the Waltz algorithm [36] using less stringent threshold [34]. The detected ARs are called cryptic amyloidogenic regions. In the other work, ARs, which are exposed on the surfaces of the structured domains, were discussed [17]. However, in this case, the constrained conformations of the ARs normally do not allow them to adopt the required amyloid-forming conformation, in contrast to the cases where ARs are located within relatively long IDRs. Finally, a computational pipeline, TAPASS [33], was developed to detect ARs located within IDRs predicted either by IUpred or AlphaFold program (Figure 1). The identified regions are called ‘exposed amyloidogenic regions’ or, otherwise, ‘exposed aggregation-prone regions’ (EARs).
![A general scheme showing mapping of ARs and EARs on a structural model of human TAR DNA-binding protein 43. This protein forms amyloid fibrils by the C-terminal Low Complexity Domain (LCD, 274–414) [37]. TAPASS predicts several ARs, which are located within the 3D structures (orange) and two EARs (magenta) located at the C-terminal IDR. Thus, the EAR prediction, but not AR one, is in agreement with the experimental data. TAPASS can be used on web server (https://bioinfo.crbm.cnrs.fr/index.php?route=tools&tool=32).](https://oup.silverchair-cdn.com/oup/backfile/Content_public/Journal/bib/24/4/10.1093_bib_bbad183/1/m_bbad183f1.jpeg?Expires=1749486523&Signature=WZ~77wCIodMQPafDnptoi5Lv8Mq70JxJXAqn3l4FhlRjl7CWmKB8H4UVjb7qbytkyLgzEHzSm6WvvaTGAoTLBLUryn9FfiBvEY6upeM4oQ-uIx~lSE-1aZ5SVnAETrd6VZxYwU7jj8MqdQdq3FsUA~uVe5x6FohhyxtIu6wcUZaKkYOlfGf~Z6-Q~TfBjjDNvvomEuue-qRJClwKyLYjawXXGj3c-MO3WG2vVzmIHYd51lxbkDLIkZ0fbw~F1bXkvXDCZD5brwHasVNK2~Huw7hT~pCvtc26E3-FcyGawILaj6HmVzAFGe8CBC9pmSSlXM59GPZd2-SakOHHZDQrIQ__&Key-Pair-Id=APKAIE5G5CRDK6RD3PGA)
A general scheme showing mapping of ARs and EARs on a structural model of human TAR DNA-binding protein 43. This protein forms amyloid fibrils by the C-terminal Low Complexity Domain (LCD, 274–414) [37]. TAPASS predicts several ARs, which are located within the 3D structures (orange) and two EARs (magenta) located at the C-terminal IDR. Thus, the EAR prediction, but not AR one, is in agreement with the experimental data. TAPASS can be used on web server (https://bioinfo.crbm.cnrs.fr/index.php?route=tools&tool=32).
In this work, we used TAPASS pipeline to detect EARs. To obtain the most consensual results on the occurrence and distribution of the EARs in proteomes, we selected three predictors of aggregation (TANGO, Pasta 2.0 and ArchCandy 2.0) [10, 13, 16, 33]. They were selected based on the diversity of their basic principles, their popularity and ability to be downloaded for analysis of a large number of sequences. TAPASS also provides information about the cellular localization, post-translational modifications and functions of aggregation-prone proteins.
In addition to the advances with the predictors of aggregation, the past few years were marked by a significant increase in the number and quality of proteome sequencing data. Thus, the advances with methods predicting aggregation potential, development of the TAPASS pipeline as well as an increasing number of high-quality whole-proteome sequencing data made a new census of aggregation-prone regions in proteins in a timely manner. In this paper, we present the results of such a detailed analysis of 76 full reference proteomes from the UniProt databank.
MATERIALS AND METHODS
TAPASS pipeline
The input file of TAPASS requires protein sequences in Fasta format and can contain additional information from UniProt [38] (gene id, GO term, version, modification date, etc.). The pipeline uses IUPred [39] and our in-house predictor (IDRs), CATH associated with HMMER 3.3 (structural domains) [40, 41], TMHMM (transmembrane regions) [42], SignalP (signal peptide) [43], SLiMs (short linear motifs) [44, 45], Pfam (structural and functional domains) [46], Pasta 2.0 [16], TANGO [13] and an updated version of ArchCandy 2.0 (aggregation-prone regions) [10, 33]. The following programs were used with the default threshold values: ArchCandy 0.56; Pasta −5.5; Tango 5.0; TMHMM default; SignalP default (minimal length = 10); IUPred 0.5; CATH P-value <0.001; PFAM P-value <0.001. Performance of TAPASS pipeline was tested against a non-redundant dataset of 40 proteins, which are known to form disease-related and functional amyloids (Supplementary Data 1). The dataset contains proteins with sequence identity lower than 50%. TAPASS correctly predicted ARs in 77.5% of the proteins, and among them, 42.5% were identified as EAR-containing ones. In particular, the predicted EAR-containing proteins include Aβ-peptide and Tau proteins (Alzheimer’s disease), α-synuclein (Parkinson’s disease) and Poly-Q sequences (Huntington’s disease and other ataxins) (Supplementary Data 1). Thus, the benchmark results show the high prediction potency of the developed pipeline. In this work, the results of the three predictors of aggregation, ArchCandy 2.0, Pasta 2.0 and TANGO, were treated separately. Each predictor gives the start and end positions of ARs in protein sequences. An AR is considered as EAR if at least 80% of an individual hit of AR predictor overlap with an IDR. Thus, our analysis led to three independent censuses of the aggregation-prone regions. If all three censuses yielded similar regularities, then these findings were considered as more reliable and treated with special attention.
Selection of proteomes for large-scale analysis
Seventy-six reference proteomes with 1 123 749 proteins in total were selected from the UniProt databank (Supplementary Data 2) [38]. The proteome proteins were curated either manually (SwissProt) or automatically (TrEMBL). Altogether, they represent non-redundant sets without multiple occurrences of identical sequences. The datasets contain isoforms of a given protein with both identical and different regions in the sequence, reflecting the real variety of the proteomes [47]. The proteomes belong to the three kingdoms of life: eukaryote, bacteria and archaea. The selection of species was made to have well-annotated and complete reference proteomes covering the diversity of living organisms. Viral proteomes were not considered in this analysis due to small size of their proteomes yielding very different results depending on the strains. Their analysis will be the subject of our future study.
RESULTS AND DISCUSSION
Occurrence of ARs and EARs in the proteomes
Previous studies detected a very high percentage of AR-containing proteins in proteomes with almost each protein having at least one predicted AR [22, 26, 27]. The results of our analysis of 76 reference proteomes support this conclusion predicting 68.6%, 79.3% and 90.0% of AR-containing proteins by ArchCandy 2.0, Pasta 2.0 and TANGO, respectively. The coverage of ARs, obtained by dividing the number of amino acid residues involved in ARs by the number of all residues in proteins, is equal to 12.6%, 6.2% and 11.3% for ArchCandy 2.0, Pasta 2.0 and TANGO, respectively. A very high percentage of AR-containing proteins is in contradiction with a small number of proteins known to be involved in different amyloidoses or functional amyloids. However, if we consider EARs, the number of potential aggregation-prone proteins is drastically reduced. EAR-containing proteins represent 9.0%, 6.8% and 19.5% of all proteins with coverage of 0.8%, 0.2% and 0.4% of residues according to ArchCandy 2.0, Pasta 2.0 and TANGO, respectively. The low percentage of proteins with EARs, in contrast to a very high percentage of ARs, agrees better with the small number of the known proteins involved in aggregation in vivo.
Aggregation-prone regions in prokaryotic and eukaryotic organisms
Analyzing the 76 selected proteomes, we observed a relatively uniform distribution of AR-containing proteins among the organisms (Figure 2). Curiously, H. sapiens has the least number of AR-containing proteins. At the same time, we saw a large variation in the proportion of EAR-containing proteins. Among the organisms with the least number of EAR-containing proteins are thermophilic prokaryotes (six archaea and five bacteria: Chloroflexus aurantiacus, Thermodesulfovibrio yellowstonii, Dictyoglomus turgidum, Nanoarchaeum equitans, Sulfolobus solfataricus, Thermotoga maritima, Archaeoglobus fulgidus, Thermococcus kodakaraensis, Methanocaldococcus jannaschii, Candidatus korarchaeum, Aquifex aeolicus).
![Proportion of (A) AR- and (B) EAR-containing proteins per organism predicted by using three predictors of aggregation, ArchCandy 2.0 (red), Pasta 2.0 (blue) and TANGO (green). Archaea, bacteria, eukaryotes and mammalian eukaryotes are outlined by yellow, orange, blue and violet, respectively (made by using free options in iTOL, https://itol.embl.de/ [48]).](https://oup.silverchair-cdn.com/oup/backfile/Content_public/Journal/bib/24/4/10.1093_bib_bbad183/1/m_bbad183f2.jpeg?Expires=1749486523&Signature=YGzKHQ1~vCLc5bxcxA2J2PshnrndtUOtFBLPjT3uYEUak3PbIQJWHquE6wjc62qyxkAS7VpnPXv0vCldx7ZeZjC0NcDadMEazHk5HZVgaXnVl7FwmwGqUJhOVrnaENpqfR-Lsqetkz8mvZPcobvDy2S54mnGdA78xt1WpvA7~Ndbff10SKf5srfokJ6-8VFRHfEKlia1o99p52TZ8bOcsYJJ03fjnIe29lyUgirCquchxwCILEzMYpMnOxx1p~5R4-tzb6zFVH2xV5uWo0GA6Ha7d4hNN~xxfgQG2UtXQVman0FCRFP~XqQi590nC8w~nzEZwT-lL1ZvNimtPaGvrw__&Key-Pair-Id=APKAIE5G5CRDK6RD3PGA)
Proportion of (A) AR- and (B) EAR-containing proteins per organism predicted by using three predictors of aggregation, ArchCandy 2.0 (red), Pasta 2.0 (blue) and TANGO (green). Archaea, bacteria, eukaryotes and mammalian eukaryotes are outlined by yellow, orange, blue and violet, respectively (made by using free options in iTOL, https://itol.embl.de/ [48]).
The eukaryotes with the simplest level of organization, mostly unicellular (or partially unicellular) protists such as Plasmodium falciparum, Leishmania major, Thalassiosira pseudonana, Trypanosoma cruzi, Toxoplasma gondii and Dictyostelium discoideum, have the greatest numbers of EAR-containing proteins (Figure 2). High levels of EAR-containing proteins are also found in two fungi (Ustilago maydis, Neurospora crassa), fruit flies (D. melanogaster), mosquitoes (Anopheles gambiae) and chickens (Gallus gallus). Most of them are known to have the greatest number of low-complexity repetitive sequences [49]. This is particularly the case of T. cruzi and D. discoideum, which have an abnormally high level of Asn/Gln-rich regions, two types of amino acids frequently found in amyloids. Among analyzed mammalians, H. sapiens has the least number of EAR-containing proteins (Figure 2).
Having a global view of the dispersion of aggregation potential of the proteomes, it was interesting to analyze the tendencies associated with groups of the organisms. First, we compared prokaryotes and eukaryotes. All three predictors detect more AR-containing proteins and higher AR coverage in prokaryotes in comparison to eukaryotes (Figure 3A and B). The tendency is reversed when we compare the occurrence of EARs (Figure 3C). The percentage of EAR-containing proteins and coverage of EARs are noticeably higher in eukaryotic than in prokaryotic organisms (Figure 3C and D). This can be explained by a higher number of IDRs in eukaryotes, which require the IDRs to mediate a more complex network of protein–protein interactions in comparison to prokaryotes [50, 51]. At the same time, the coverage of EARs in IDRs is lower in eukaryotes compared to prokaryotes (Figure 3E). Thus, the eukaryotic IDRs are less aggregation prone on average than the prokaryotic ones, suggesting a higher selective pressure on their IDRs to avoid aggregation.
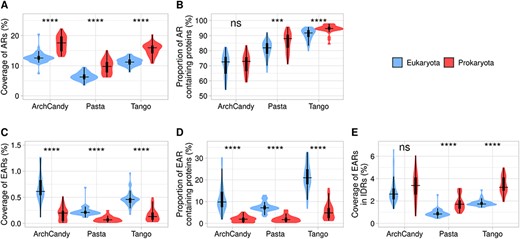
Level of aggregation potential according to three amyloid predictors in prokaryotes and eukaryotes. The figure displays coverage of ARs (A), proportion of AR-containing proteins (B), coverage of EARs (C), proportion of EAR-containing proteins (D) and coverage of EARs in IDRs (E). For statistical analysis between eukaryotic and prokaryotic organisms, we performed a t-test for the predictors individually (ns: non-significant; *P <0.05; **P <0.01; ***P <0.001; ****P <0.0001).
The more thermophilic, the less aggregation prone
A unique feature of prokaryotes is the wide range of their optimal growth temperatures (OGTs), some of them reaching temperatures above 105 °C [52]. We estimated the aggregation potential of the prokaryotic proteomes depending on the OGTs. For this purpose, we subdivided the selected reference proteomes into two groups: 20 mesophilic organisms with an OGT below 41 °C and 11 thermophilic organisms with an OGT above 41 °C. The comparison of proportion and coverage of ARs from these groups does not reach the same conclusion as ArchCandy 2.0 predicts a decrease in ARs in the thermophilic organisms, while PASTA 2.0 and TANGO show the opposite tendency (Supplementary Figure 1). However, evaluation of EARs by all the predictors clearly demonstrated that they decrease with the increase of OGT (Supplementary Figure 2). Moreover, for the analyzed 31 prokaryotes (Supplementary Data 3), we performed a correlation analysis between proportions of EAR-containing proteins or EAR coverages and OGT and observed clear negative correlations by all the predictors (Figure 4). It has also been shown that the frequency of glutamine residue, which has a high amyloidogenic potential, decreases, while the total frequency of charged residues, which can block amyloid formation, increases in thermophilic proteins [53]. At the same time, the temperature increase may favor aggregation. For example, it has been shown that the amyloidogenesis rate constant of Aβ-peptide increases and the lag time decreases with increasing temperature [54]. Considering all this, we can conclude that the decrease in the EARs with OGT can be a result of an evolutionary pressure on the thermophilic proteins to avoid the aggregation.
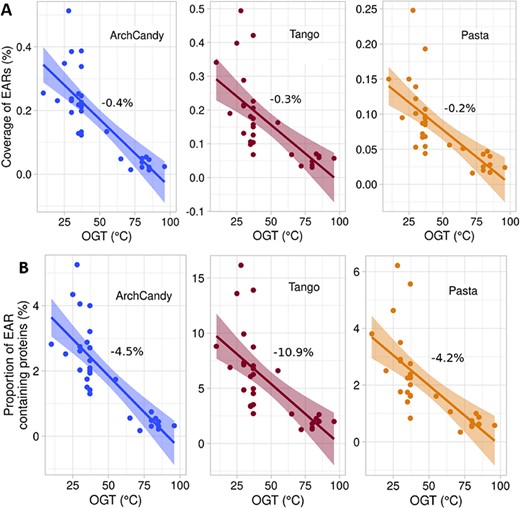
Correlation between EAR coverage and OGT (A) and proportion of EAR-containing proteins and OGT (B) of 31 prokaryotes (Supplementary Data 3) for each predictor separately. Data were fitted by linear regression with a slope expressed as a percent per °C. F-Tests for slopes being either different or non-zero all gave P-values ≤10−4. Data analysis was done using R.
Occurrence of EARs in proteins depending on their length
In general, the longer the protein chain, the higher the probability for it to have both ARs and EARs. One would expect that if the ARs or EARs are uniformly distributed in protein sequences, their occurrence would correlate linearly with protein length. To see the tendency better, one can normalize the occurrence of ARs/EARs by dividing it by protein length. Previously, similar analyses have been done for the ARs using bacterial proteins [25] and the human proteome [27]. Both studies showed that the aggregation potential of a protein normalized by its length goes down with the increase of protein size. To compare this conclusion with our results from the 76 selected proteomes, we analyzed the normalized proportion of AR-containing proteins and normalized AR coverage depending on length (Figure 5A and C). In agreement with the previous studies, we observed a decrease in the normalized proportion of AR-containing proteins and AR coverage with length. The steady decrease starts after 500 residues. The graph of AR coverage has a sharp peak at around 350-residue length. Clustering proteins by MMseqs2 [55] at 30% of sequence identity, we found that this peak contains a significant excess of G protein-coupled receptors having high AR coverage, explaining this anomaly. The 200–500-residue region with the highest AR coverage and proportion coincides with the length ranges where proteins are predicted to be the most structured (Figure 5E), and in general, it negatively correlates with the IDR coverage by protein length. Thus, the AR proportion and coverage curves can be explained by the fact that structured regions have a higher probability of containing ARs, and proteins of less than 500 residues are mostly structured.
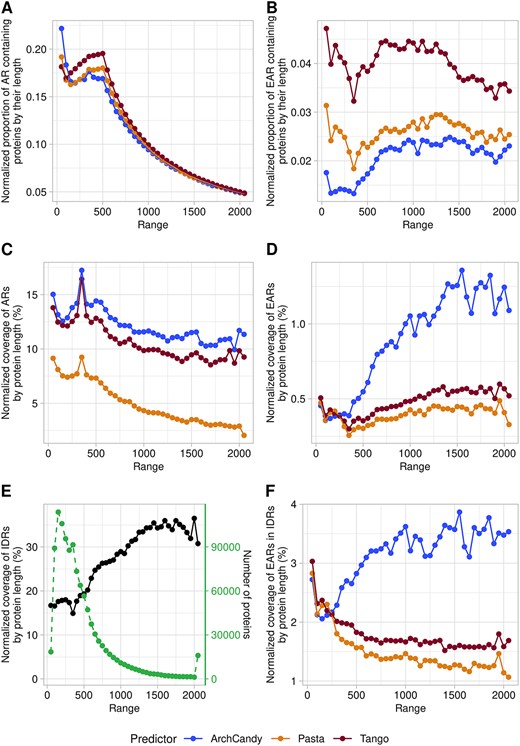
Plots of the proportion of AR (A) and EAR (B) containing proteins depending on the protein length. Plots of coverage of AR (C) and EAR (D) in proteins according to their length. Plots of coverage of IDR (E) and EAR in IDR (F). Proteins are grouped by subsets of 50 residues (e.g. 1–50, 51–100, etc.). Proteins longer than 2000 were grouped into one subset. The predictors used have systematic biases at the terminal regions of proteins, and this affects results on the short sequence lengths. To take this bias into account, we also run the predictors against a set of randomized sequences. This set contains proteins from our database with each sequence computationally shuffled, respecting the average amino acid composition of our database and having the same distribution of protein lengths. This allowed us to determine a correction coefficient which was used to adjust the values of EAR, AR and IDR.
The dependence of EARs on protein length demonstrates that it differs from ARs (Figure 5B and D). The predictors show a plateau with the lowest EAR coverage for the shortest proteins (less than 350 residues), which steadily goes up for longer proteins. A similar trend is observed when we plot the dependence of the proportion of EAR-containing proteins by length.
The dependence of the coverage of IDRs against protein length (Figure 5E) is similar to the one of EARs, explaining the low aggregation potential of the short sequences by their tendency to be structured. Indeed, the region of 200–400 residues, which corresponds to the stable structural domains of proteins, has the lowest coverage of IDRs and EARs.
To see the tendency linked only to the characteristics inherent in the IDR sequences, we analyzed the dependence between the EAR coverage in IDRs and the length of proteins. The analysis shows that for TANGO and PASTA 2.0, shorter sequences have higher EAR coverage in IDRs. In contrast, ArchCandy 2.0 predicted an increase of EAR coverage in IDRs with protein length (Figure 5F). One explanation of this discrepancy between the predictors may be the fact that ArchCandy predicts Asn/Gln-rich regions, which are frequently found in long proteins, as aggregation prone, while TANGO and PASTA do not.
Thus, we do not observe a decrease in aggregation potential with an increase of protein size when we consider EARs. The longer a protein chain, the higher its propensity to aggregate. Therefore, the question arises as to the mechanism preventing fibril formation of long proteins. One possible explanation can be that long proteins, having multiple IDRs, represent ‘steric brushes’ preventing their intermolecular interactions and aggregation due to the high entropic barrier [56].
Occurrence of EAR-containing proteins in different cellular compartments
Proteins having different cellular localizations may differ in their aggregation potential. Therefore, we analyzed the occurrence of AR- and EAR-containing proteins in four major subcellular localizations: secreted proteins identified by SignalP [43], transmembrane proteins by using TMHMM [42], nuclear proteins with NLS (nuclear localization signals) found by SLiMs [44] and the remaining proteins that were considered mostly cytosolic (Figure 6). We observed similar levels of AR-containing proteins in all compartments except the transmembrane proteins, which have significantly higher levels (Supplementary Figure 3). The high level of AR-containing proteins among the transmembrane proteins was expected because their hydrophobic TM helices are detected as ARs by all predictors. The most striking observation was the high level of EAR-containing proteins in nucleus of eukaryotes, which is at least twice higher than in the other cellular localizations (Figure 6A). In line with this result, it has been shown previously that under stress conditions, proteins in the nucleus tend to form aggregates [57].
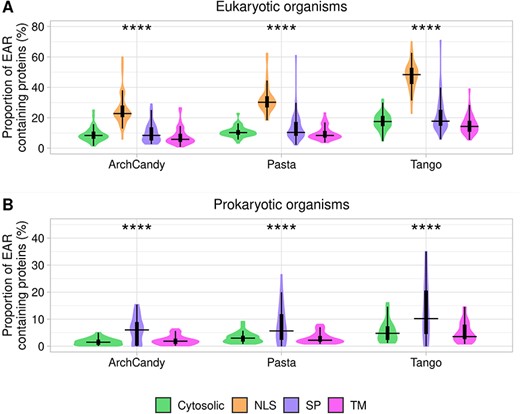
Plots of proportion of EAR-containing proteins according to the protein localization in eukaryotic (A) and prokaryotic (B) organisms. Proteins are split into four groups: extracellular proteins with signal peptides (SP), transmembrane proteins (TM), nuclear proteins having nuclear localization signals (NLS) and other proteins that have been classified as cytosolic. The proportions of the analyzed proteins are as follows: in eukaryotes, 58.5% are cytosolic, 6.2% have SPs, 21.4% are transmembrane proteins and 13.9% have NLS. In prokaryotes, 71.9% are cytosolic, 4.3% have SPs and 23.7% are transmembrane proteins. For statistical analysis between the different cell compartments, we performed an ANOVA test for the predictors individually (ns: non-significant; *P <0.05; **P <0.01; ***P <0.001; ****P <0.0001).
In prokaryotes, we observed more EAR-containing proteins among those involved in the secretory pathway in comparison to those present in the transmembrane and cytosol (Figure 6B). This tendency suggests that the secreted proteins being outside of the cell are under a reduced evolutionary pressure to avoid aggregation. Formation of aggregates out of the cell may be less deleterious for unicellular prokaryotic organisms in comparison with most of the eukaryotes, which can accumulate unwanted deposits within the extracellular space of their tissues. Moreover, it is known that many prokaryotes use secreted proteins to form functional amyloids [5].
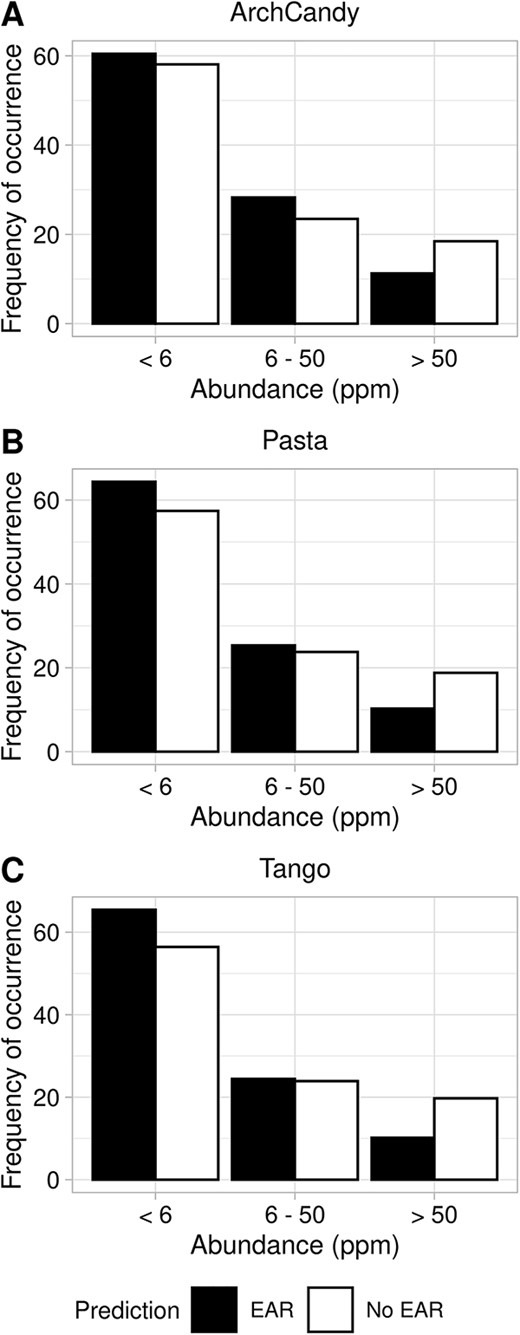
Frequency of occurrence of EAR-containing proteins depending on their abundance. Proteins are grouped based on their abundance in three groups: less than 6 ppm, 6–50 ppm and more than 50 ppm. The histograms show ArchCandy 2.0 (A), Pasta 2.0 (B) and TANGO (C) predictions, respectively.
Relationship between cellular abundance of proteins and AR/EAR frequencies
The amount of genome-wide data on gene expression has drastically increased in the past few years [58]. The data comes from various technologies, organisms and tissues (normal or disease related), making it difficult to compare them in a large-scale analysis. In this case, we find that the data from the Protein Abundance Database (PaxDb) [59] are the most suitable for our purposes. PaxDb represents protein abundance by ‘protein per million’ (ppm) and, by doing so, overcomes the problem of variability in cell size or dilutions in the samples used, making comparisons between them possible. The PaxDb has the protein expression level in different tissues and organs of organisms. In addition, it provides the average abundance of a protein in the whole organism. We used this average abundance value to analyze the expression level of AR-/EAR-containing proteins, which are available both in PaxDb and in our dataset. Expression levels range from almost zero up to more than 100 000 ppm. The majority of proteins have values of less than 2 ppm. The number of proteins with abundance more than 50 ppm drops significantly (Figure 7); therefore, we grouped these proteins together in our analysis. Our analysis revealed that the frequency of occurrence of EAR-containing proteins decreases with the ppm growth and is becoming lower than non-EAR-containing proteins. From the observed dependence of the difference between EAR- and non-EAR-containing proteins, we can conclude that highly expressed proteins are less prone to aggregate, with this finding being consistent in the three predictors used. We observed a similar tendency with the frequency of occurrence of AR-containing proteins depending on the abundance (Supplementary Figure 4). It suggests that highly expressed proteins are under a greater selective pressure to avoid aggregation. This conclusion is in agreement with a previous study of human proteins also suggesting that aggregation-prone proteins and gene level expression are inversely correlated [20].
EAR levels in essential proteins
As demonstrated previously, essential genes are subject to a greater selection pressure than non-essential genes [60, 61]. It has also been shown that essential proteins are less prone to aggregation [20, 23]. In order to find essential proteins in our database, we used the DEG database of essential proteins [61] and run BLAST program with E-value <0.001 [62]. By this approach, we identified 705 692 essential proteins (~62.6%) in our database. Analysis of these proteins by the three predictors showed a lower EAR coverage and, to a lesser extent, proportion of essential and non-essential EAR-containing proteins in eukaryotes (Figure 8A and C). Our results are in agreement with previous conclusions that essential proteins have a lower aggregation score than non-essential proteins [23]. In prokaryotes, we observe the opposite tendency (Figure 8B and D). Previous analyses of ARs (not EARs) made on a smaller scale in bacteria [25] have shown that essential proteins have less ARs. Our results of the AR analysis in prokaryotes (Supplementary Figure 5) are in agreement with this conclusion.
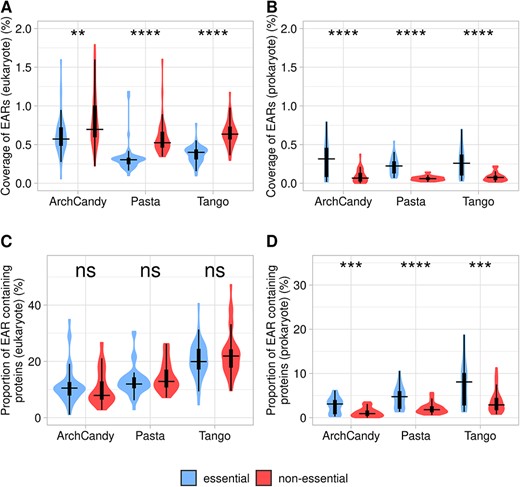
Coverage of EARs in essential and non-essential proteins in eukaryote (A) and prokaryote (B) organisms. Proportion of EAR-containing proteins known as essential or non-essential in eukaryote (C) and prokaryote (D) organisms. For statistical analysis between essential and non-essential proteins, we performed a t-test for amyloidogenic predictors individually (ns: non-significant; *P <0.05; **P <0.01; ***P <0.001; ****P <0.0001).
Short linear motifs in EARs
A significant portion of protein interactions are mediated by short linear motifs (SLiMs) preferentially found in IDRs [44]. As EARs are also located within the IDRs, it was interesting to analyze the co-occurrence of SLiMs and EARs in proteins. Although both prokaryotes and eukaryotes have functional SLiMs, the eukaryotic linear motifs are more common, as well as better classified and documented. Most of the eukaryotic SLiMs can be found in the ELM resource [44] alongside their descriptions, experimental evidence from the literature and regular expressions (RegEx) of the recurrent patterns. Therefore, we focused our analysis on the SLiMs from eukaryotes. For this purpose, we applied the RegEx from the ELM database [44] to the IDRs and EARs determined by our pipeline [33]. The SLiMs are subdivided into six major classes: (LIG) ligand binding motifs and (DOC) docking sites both involved in protein–protein interactions of the functional complexes, (MOD) modification sites covering several post-translational modifications of proteins (e.g. phosphorylation, palmitoylation, glucosylation), (DEG) sites of proteins that are important in regulation of protein degradation rates, (TRG) targeting sites responsible for protein sorting in cellular compartments and (CLV) specific cleavage sites.
The results of all three aggregation predictors showed that EAR-containing proteins are enriched in SLiMs in comparison to IDR-containing proteins without EARs (Figure 9). By using the exact Fisher test, we were able to select SLiMs, which are significantly enriched in EAR-containing proteins compared to IDR-containing proteins (Supplementary Data 4). Interestingly, 20 of the 25 degradation motifs (proteasome pathway) from DEG class occur more frequently in EAR-containing proteins than in non-EAR-containing proteins (Figure 9). Moreover, 17 of the 22 TRGs are also more frequently present in EAR-containing proteins than in IDR-containing proteins. Among them, three SLiMs were found to be endosome-lysosome-basolateral sorting signals. These results suggest that EAR-containing proteins may be more susceptible to degradation by the proteasomal and lysosomal pathways compared to just IDR-containing proteins. This might be a strategy used by organisms to prevent protein aggregation by increasing degradation of potential aggregation-prone proteins. Cleavage sites (CLV) are less prevalent in EARs, which may prevent the release of smaller amyloidogenic peptides such as the well-known Aβ-peptide [63].
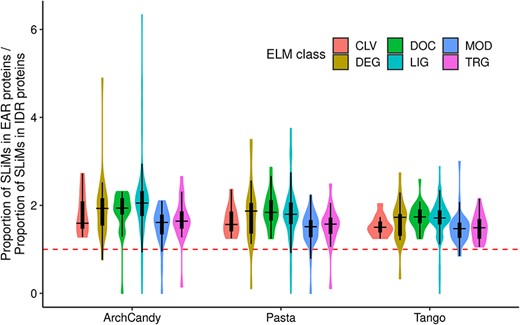
Ratio of proportions of SLiMs in IDR-containing proteins with and without EARs, predicted by three predictors. SLiMs are grouped in 6 classes denoted by different colors. The majority of the SLiMs have their ratios greater than 1.0 (red dotted line), meaning that they are enriched in IDR-containing proteins with EARs.
Number of EARs at each step of the protocol for the evaluation of EAR sequence conservation
| Predictor | Number of non-redundant EARs | EARs found one time in MSA | EARs found 2 to 5 times in MSA | EARs found more than 5 times in MSA | Number of clusters with the most conserved EARs |
|---|---|---|---|---|---|
| ArchCandy 2.0 | 93 229 | 72 153 (77.4%) | 16 124 (17.3%) | 4952 (5.3%) | 2218 |
| Pasta 2.0 | 42 997 | 35 412 (82.4%) | 5683 (13.2%) | 1902 (4.4%) | 869 |
| TANGO | 13 816 | 12 342 (89.3%) | 1219 (8.8%) | 255 (1.8%) | 178 |
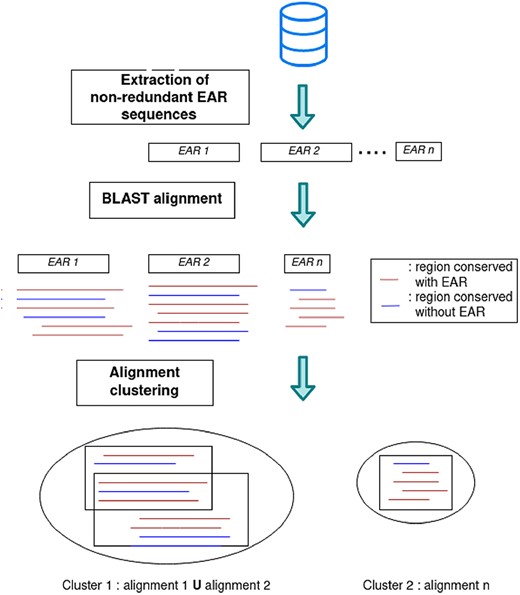
Protocol for the evaluation of EAR sequence conservation.
Functional domains enriched in EAR-containing proteins
With a method similar to the SLiMs enrichment, we tried to identify functional Pfam domains enriched in EAR-containing proteins. Of the 15 116 known Pfam domains, only 1410 are significantly more prevalent in EAR-containing proteins predicted by ArchCandy 2.0 (P-value <0.001 calculated by exact Fisher test and also FDR-corrected P-values <0.001). In addition, 484 of them belong to 154 clans according to the classification of Pfam. The functional domains and clans that came on top are nucleoporin FG repeat region (CL0647), RNA recognition motif domains (CL0221) and zinc-finger domains (CL0511, CL0390) (Supplementary Data 5). We searched the experimental evidence of aggregation by these domains in the literature and found that the nucleoporin proteins are known to form amyloids [64]. EAR-containing proteins predicted by both ArchCandy 2.0 and TANGO are positively enriched in nucleoporin FG repeat region (CL0647). From the known functional amyloids described in the literature, we also found back RIPK1 and RIPK3 [8, 9] and PMEL17 [65], which were conserved in six distinct proteins from mammalians with the prediction of ArchCandy 2.0 but not Pasta 2.0 or TANGO.
Previous studies of Pfam domains and gene ontology term enrichment in amyloidogenic proteins [24, 28] pointed out the over-representation of membrane transport activity, pH and ion regulation and even cytoskeleton organization. However, they considered ARs, not EARs. Therefore, we did not find most of the aforementioned functions in our analysis.
Conservation of EAR sequences
Another approach to find new functional amyloids is to search for EARs that are conserved among different species. For this purpose, we reduced EARs predicted by either ArchCandy 2.0, TANGO or Pasta 2.0 with CD-HIT [66] at 70% sequence identity and 90% of coverage, to obtain a non-redundant set of the EARs (Table 1). Then, we ran BLAST [59] for each EAR sequence against all proteins from our redundant database to select only conserved EAR sequences (Figure 10). Since the average length of the EARs was relatively small (ArchCandy 14.95; Pasta 11.55 and Tango 7.74 residues), the default parameters of CD-HIT and BLAST program were modified (CD-HIT options: -c 0.7 -aL 0.9 -T 8; BLASTP options: -gapopen 6 -gapextend 2 -evalue 0.001).
For each EAR, this gave us a multiple sequence alignment (MSA) of similar sequences found in other proteins. Some sequences of the MSA were EARs and the others were not according to the predictors. We selected the MSAs with EARs in more than five other proteins and further reduced the MSA number by merging those that shared at least 80% of the same conserved EAR. This clustering results found 2218, 869 and 178 of the most conserved EAR sequences for ArchCandy 2.0, Pasta 2.0 and TANGO, respectively (Table 1). We observed that only a small number of EAR sequences are conserved out of more than 1 million proteins. Among them, we found already known functional amyloids, such as RIPK3 and RIPK1 [8] and PMEL17 [65]. This suggests that the list of conserved EARs found by this protocol (Supplementary Data 6) can be used for detection and experimental tests of new functional amyloids.
CONCLUSION
The recent progress with computational approaches predicting aggregation [10, 12, 13, 15, 16, 18, 31, 33], and an increasing number of whole-proteome sequencing data, opened an avenue for the comprehensive census of aggregation-prone regions in proteins. In this work, we performed the detailed analysis of 76 full reference proteomes from the UniProt databank. As a result, a number of interesting correlations, confirmed by all the predictors used in this work (ArchCandy 2.0, Pasta 2.0 and TANGO), were discovered. First, we detected a significantly lower percentage of EAR-containing proteins (about 10%) in comparison with a high percentage of AR-containing proteins in proteomes (about 80%). The number of EARs correlates better with a small number of the known proteins forming aggregates in vivo, and, therefore, EARs can be suggested as a more precise measure of the aggregation potential of proteins. Second, we showed that the more complex the organism (on a scale from unicellular prokaryotes to multicellular eukaryotes), the fewer the aggregation-prone regions, suggesting a higher selective pressure on complex organisms to avoid aggregation. Third, we found that thermophilic prokaryotes have significantly less EARs and ARs in comparison to mesophilic prokaryotes. The correlation may reflect an evolutionary pressure on thermophilic proteins because the amyloid formation rate constant increases with temperature [54]. Fourth, it was shown that proteins having different cellular localizations differ in their aggregation potential. For example, the level of EAR-containing proteins in nuclear proteins of eukaryotes is about twice higher than in the other cellular localizations. In prokaryotes, we observed more EAR-containing proteins among those involved in the secretory pathway in comparison to the transmembrane and cytosolic proteins. This tendency suggests that the secreted proteins being outside of the cell are under a reduced evolutionary pressure to avoid aggregation. Fifth, remarkably, a great majority of eukaryotic IDR-containing proteins with EARs are enriched in SLiMs in comparison to IDR-containing proteins without EARs. We also noticed that highly expressed proteins are less prone to aggregate suggesting that highly expressed proteins are under a greater negative selective pressure in order to avoid the aggregation. Finally, we revealed a greater level of aggregation predicted in non-essential proteins compared to essential proteins.
In addition, in agreement with previous studies, we observed a small decrease in the normalized AR coverage with protein length. However, we did not observe a decrease in the aggregation potential of sequences with an increase of protein size when we considered EARs. In our opinion, the mechanism of prevention of aggregation of long proteins has an entropic basis, where the other parts of the chain generate repulsive forces for intermolecular interactions similar to molecular brushes. It is worth mentioning that our analysis did not confirm previously published conclusions that the average aggregation propensity of a proteome correlates inversely with the longevity of the studied organism [29].
Thus, we performed the census of the aggregation-prone regions in proteomes. A number of new relationships found in this work led us to a better understanding of the link between protein evolution and aggregation in organisms from the three kingdoms of life: eukaryote, bacteria and archaea. Beyond this, our study opens up new opportunities for a number of experimental tests.
The most realistic census of protein aggregation regions requires their crossing with unstructured regions.
The analysis revealed that the simpler the organism, the greater the number of aggregation-prone regions.
The more thermophilic the prokaryotic organism, the less aggregation prone are its proteins.
In eukaryotes, nuclear proteins are more aggregation prone than proteins in other cellular localizations.
In prokaryotes, secreted proteins are more aggregation prone in comparison to those present in the cytosol.
EAR-containing proteins are enriched in short linear motifs (SLiMs) in comparison to IDR-containing proteins without EARs
ACKNOWLEDGEMENTS
The authors thank Priya Amin for her assistance with English.
FUNDING
REFRACT project with Latin America in Research and Innovation Staff Exchange program (2018–2023) (H2020-MSCA-RISE-2018 to A.V.K.); Azerbaijan National Academy of Sciences and The Ministry of Science and Education of Azerbaijan (to Z.O.); Ministère de l’Education Nationale de la Recherche et de Technologie (MENRT) (to E.V. and F.R.); CNRS PhD fellowship (to T.F.).
Author Biographies
Théo Falgarone is currently a postdoctoral research fellow at the Imagine Institute for Genetic Diseases, Paris, France. He received his Ph.D. degree at the group of Structural Bioinformatics and Molecular Modeling, at the Centre de Recherche en Biologie cellulaire de Montpellier and University of Montpellier, France. His research interests include structural and functional annotation of proteomes.
Etienne Villain is currently a postdoctoral research fellow at the Institut Pasteur, Department of Immunology, Paris, France. He received his Ph.D. degree at the group of Structural Bioinformatics and Molecular Modeling, at the Centre de Recherche en Biologie cellulaire de Montpellier and University of Montpellier, France.His research interests include development and application of bioinformatics methods to analyze multi-omics data.
Francois Richard is currently a research fellow at the Laboratory for Translational Breast Cancer Research, Leuven, Belgium. He received his Ph.D. degree at the group of Structural Bioinformatics and Molecular Modeling, at the Centre de Recherche en Biologie cellulaire de Montpellier and University of Montpellier, France.His research interests include the bioinformatics analysis of genomes.
Zarifa Osmanli is a graduate student (Ph.D. course) at the group Structural Bioinformatics and Molecular Modeling, at the Centre de Recherche en Biologie cellulaire de Montpellier and University of Montpellier, France.She is also a research fellow at the Biophysics Institute, Ministry of Science and Education of Azerbaijan Republic, Baku, Azerbaijan. Her research focus is on the application of bioinformatics methods to analyze dark proteome.
Andrey V. Kajava is a Director of Research at CNRS, a head of the Structural Bioinformatics and Molecular Modeling group at the Centre de Recherche en Biologie cellulaire de Montpellier, CNRS, and University of Montpellier, France.His group is using methods of theoretical structural biology and bioinformatics to understand principles of protein structures and biomolecular interactions.
