


Abstract
Single-cell RNA sequencing (scRNA-seq) has significantly accelerated the experimental characterization of distinct cell lineages and types in complex tissues and organisms. Cell-type annotation is of great importance in most of the scRNA-seq analysis pipelines. However, manual cell-type annotation heavily relies on the quality of scRNA-seq data and marker genes, and therefore can be laborious and time-consuming. Furthermore, the heterogeneity of scRNA-seq datasets poses another challenge for accurate cell-type annotation, such as the batch effect induced by different scRNA-seq protocols and samples. To overcome these limitations, here we propose a novel pipeline, termed TripletCell, for cross-species, cross-protocol and cross-sample cell-type annotation. We developed a cell embedding and dimension-reduction module for the feature extraction (FE) in TripletCell, namely TripletCell-FE, to leverage the deep metric learning-based algorithm for the relationships between the reference gene expression matrix and the query cells. Our experimental studies on 21 datasets (covering nine scRNA-seq protocols, two species and three tissues) demonstrate that TripletCell outperformed state-of-the-art approaches for cell-type annotation. More importantly, regardless of protocols or species, TripletCell can deliver outstanding and robust performance in annotating different types of cells. TripletCell is freely available at https://github.com/liuyan3056/TripletCell. We believe that TripletCell is a reliable computational tool for accurately annotating various cell types using scRNA-seq data and will be instrumental in assisting the generation of novel biological hypotheses in cell biology.
INTRODUCTION
The advances of single-cell RNA sequencing (scRNA-seq) techniques significantly boosted systematic transcriptomic profiling and single-cell level cell-type definition in complex tissues, such as cancer biopsies [1, 2]. Reliable and reproducible processing and analyses of scRNA-seq datasets are therefore crucially important in the accurate identification and annotation of cell types, thereby allowing for ensuing investigations of cellular lineages or differentiation trajectories, cell–cell communication and spatiotemporal progression of diseases [3, 4]. To date, cluster- and reference dataset-based strategies [5] have been widely employed to annotate cell types using the scRNA-seq data. The clustering-based methods first clusters the scRNA-seq data using the single-cell clustering algorithms, such as scGNN [6], scDeepCluster [7], and SMSC [8], scGNN and scDeepCluster, use graph autoencoder and denoising autoencoder to cluster the query cells into different clusters. Based on the clusters, the types of query cells are then identified by searching marker genes in public databases, such as CellMarker [9]. Cluster-based approaches therefore heavily rely on the accuracy of the applied clustering algorithms. In addition, marker genes are not usually specific to a certain cell type. For example, the insulin gene is a marker gene for both pancreas epithelial cells and pancreatic ductal stem cells [9]. To avoid such issues, reference dataset-based approaches were established to measure the similarities between query cells and those in reference cell datasets to infer cell identities [10]. A reference dataset contains cell types already annotated by experts or other cell-type annotation methods, while a query dataset is a dataset that needs to be annotated. Normally, there are three major steps in constructing the reference dataset-based approaches: (1) learning new cell features from the reference transcriptomic data using feature representation learning methods (e.g. principal component analysis (PCA) [11] and multiple correspondence analysis (MCA) [12]); (2) constructing a prediction model for single-cell level cell-type annotation using the features calculated based on the reference dataset and (3) conducting cell-type prediction using the trained model for each query cell.
These years have witnessed a number of cell-type annotation methods published, which have been systematically reviewed [13, 14]. These surveys suggest that while these methods achieve impressive annotation accuracy, two drawbacks limit their use: (1) requesting prior knowledge makes the annotation step cumbersome and time-consuming. For example, a number of methods involve manual inspection of cluster-specific marker genes, such as Garnett [15], Moana [16], DigitalCellSorter [17], SCINA [18], SCSA [19], MACA [20], scMRMA [21 and ACAM [22]. In scGRAPH [23], additional gene interaction information is also required for the calculation and (2) unable to discover the novel cell types in the query dataset, i.e. assigning a cell into an unsure category considering the unseen cell types in the reference dataset. For example, ACTINN [24], LAmbDA [25], CaSTLe [26], SingleR [27], singleCellNet [28], CellTypist [29], linear discriminant analysis [14], nearest mean classifier [14], random forest [14], support vector machine (SVM) [14] and K-nearest neighbors (KNN) [14] cannot discover new cell types. However, the discovery of new cell types is essential for the study of cell heterogeneity. The run time and memory requirement should also be considered when designing the algorithm. For example, CellTypist package does not provide a GPU-accelerated training option—using CPU training consumes a considerable amount of time. scDeepSort [30] and GraphCS [31] also demand additional memory and time in calculating the adjacency matrix calculation for cell-type annotation.
In addition, due to the unique characteristics of scRNA-seq data, there are challenges to be tackled in terms of the algorithm development of reference dataset-based methods. For instance, pervasive ‘dropout events’ that obscure scRNA-seq data matrices with prevailing ‘false’ zero count observations pose a significant challenge for the feature extraction [32]. Similarly, batch effects between the reference and query data also challenge the construction of an accurate and unbiased prediction model for cell-type prediction. It is therefore challenging to accurately annotate the types of cells from different tissues, scRNA-seq protocols and conditions [33].
In this study, we propose an accurate pipeline, TripletCell, for accurate annotation of cell types at the single-cell level. Within this pipeline, we developed a deep metric learning-based module, termed TripletCell-FE, to build cell embeddings from scRNA-seq data for extracting the features. We demonstrated that TripletCell-FE can significantly reduce the dimensionality of the raw gene matrix and further improve the cluster performance. We conducted extensive comparisons regarding the performance of TripletCell and other state-of-the-art approaches for cell-type annotation using a total of 21 datasets collected. These datasets cover a wide range of 10 scRNA-seq protocols, 2 species and 19 tissues. Our experimental studies on these datasets show that TripletCell outperformed other approaches by achieving outstanding and balanced performance. More importantly, TripletCell can accurately annotate cell types across different protocols, species and samples with scalable and robust performance. We therefore anticipate that TripletCell can serve as a prominent tool for reliable annotation of cell types regardless of experimental settings and types of samples.
MATERIALS AND METHODS
Construction of the TripletCell framework
In this study, we propose a novel, unified computational framework, TripletCell, which leverages the cell embedding and deep metric learning to address the cell annotation task from single-cell transcriptomic data. Dataset construction for TripletCell is provided in Supplementary Text S1 and Supplementary Table S1. The deep learning network of TripletCell was trained to obtain the cell embeddings that demonstrate the distances in the cell-signature space, which directly represent the similarity of cell types—the shorter the distance is, the more similar the cell types are. Therefore, the cell embeddings can predict novel cell types, as novel cell types are separated away from all other known types in the cell-signature space according to the distance measure and metric function, such as cosine distance and Pearson correlations. With the cell embedding, the cell-type annotation becomes a nearest-neighbor-based classification task. However, according to [34], the discriminative cell features from the datasets can only be insufficiently learned, due to the commonly used cross-entropy loss function. It is therefore challenging to project the original scRNA-seq data into the ideal cell-signature space. In addition, a proper objection function is difficult to find for guiding the training process of the deep neural network (DNN) effectively. It has been reported that a robust DNN structure can improve the performance of classification tasks [35]. In light of this, we designed a novel DNN-based feature extractor for TripletCell (Figure 1A), termed TripletCell-FE, to generate cell embeddings based on the modified triplet loss function [34]. In our previous work, we defined protein triplets for the network- and ensemble deep learning-based protein-fold recognition [36]. Similarly, in this work, we define cell triplets for the cell-type annotation task. It can be seen from Figure 1A that the scRNA-seq data of the anchor cells (A), negative cells (N) and positive cells (P) from the reference dataset are used as the inputs for the three feature extractors in the training process, respectively. The anchor cells were randomly selected for the construction of the triplet, while the positive cells are of the same cell types as the anchor cells and the negative cells are of different cell types from the anchor cells. Here we formulate a cell triplet in the cell embedding that includes A, P and N cells—an A and P cells share the same type and form a positive cell pair (i.e. a short distance between the A and P cells); while an A and N cells belong to different types and therefore form a negative pair (i.e. long distance between the A and N cells). TripletCell therefore aims to build a cell embedding where the distances of all cells of the same type are closer (Figure 1B left panel) than that between different types of cells (Figure 1B right panel).
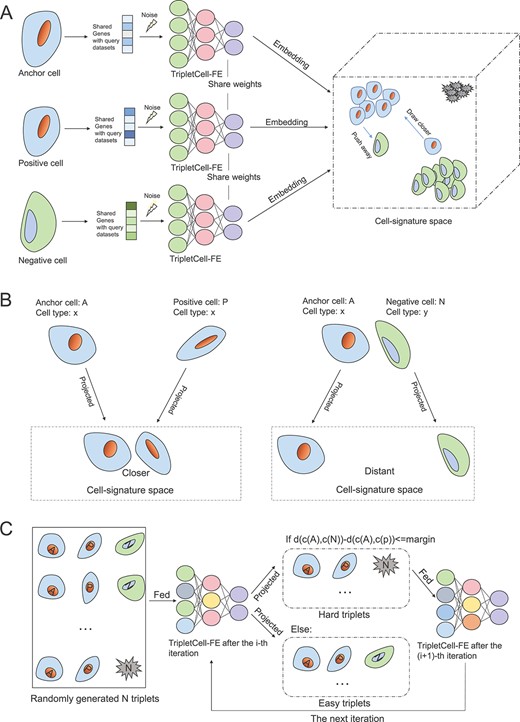
A graphical illustration of the training process of the TripletCell-FE module in TripletCell. (A) First, the noise is added randomly to the gene expression data of cells in triplets. The gene expression data are then encoded to the corresponding embedding by three respective TripletCell-FE models. Over multiple iterations, the cell-signature space is finally constructed to illustrate the distances between cells. (B) The learning goal of TripletCell is to minimize the distance between an anchor cell and a positive cell of the same type and maximize the distance between the anchor cell and a negative cell of a different type. (C) The strategy of constructing hard triplets to accelerate the convergence of TripletCell. In each iteration, n triplets are first generated randomly. Then, all the triplets are fed into the TripletCell-FE models and three-corresponding cell embeddings of each triplet are generated. Subsequently, cosine distances of the positive and negative cell pairs are calculated. If the difference of distances is less than the margin, this triplet (also referred to as a hard triplet) is fed to the next iteration of training; otherwise, the triplet is discarded for now.
Similar to our previous study [36], given a specific cell triplet <A, P, N>, the cell embedding in the cell-signature space satisfies the following property:
For Equation (2), if all the parameters of TripletCell-FE were valued as 0, the embedding of each cell would be the same. Then, it can almost trivially satisfy Equation (2). Obviously, this will cause the entire network to collapse. To avoid such an extreme case, using the strategy in our previous study [36], we accordingly modified this equation to ensure that the distance between positive and negative cell pairs is slightly smaller than 0:
where m is the margin that enforces between the positive and negative cell pairs. Based on Eq. (3), the individual triplet loss function L (A, P, N) can be further defined as follows:
If |$d\left(c(A),c(P)\right)+m-d\left(c(A),c(N)\right)\le 0$|, the loss on this training triplet would be 0; otherwise, L (A, P, N) > 0. Therefore, the training process of TripletCell is to optimize the triplet losses as follows:
where |$\Re$| represents the number of all training triplets in the training dataset (|$\left|\mathfrak{R}\right|=n$|). In addition, to guide the training of the network using the labels (i.e. cell types) and avoid overfitting, we added the label information:
where M is the number of cell types, |${y}_{ic}$| denotes the true cell type and |${p}_{ic}$| represents the predicted probability of the cell sample i belonging to the type c. The total loss function is defined as follows:
Three TripletCell-FE models sharing the same parameters for different types of cells are used to extract the features, as shown in Figure 1A. More specifically, each TripletCell-FE contains two fully connected layers [37], two dropout layers and one L2 regularization layer. The fully connected layers can study the non-linear relationship between the genes and cell types. The dropout layers [38] were designed to improve the network generalization and prevent overfitting by randomly losing neurons, which has been widely used in various classification tasks [39, 40]. On the other hand, we used the L2 regularization layer [34] to compare the distances between cells. The L2 regularization layer therefore can fix the cell embedding on the d-dimensional hypersphere, as demonstrated in our previous study [36] using the following equation:
where the c(x) denotes the output of TripletCell-FE. The specific parameters of TripletCell-FE are shown in Supplementary Figure S1. Constructing the training triplets from the reference dataset and the parameter discussion and implementation of TripletCell are provided in Supplementary Text S2, Figure 1C and Supplementary Figures S1–S4.
Alleviating batch effects in TripletCell
It is widely known that batch effects are a major factor affecting the performance of reference dataset-based cell-type annotation methods. Therefore, appropriately alleviating the batch effect between the reference and query datasets is the key to improving the performance of model annotation. TripletCell deals with batch effects mainly via the loss function that guides the neural network to learn the true bio-signals (e.g. the expression levels of specific genes in specific cell types) from the reference dataset. Specifically, scRNA-seq data consist of real bio-signals and noise (e.g. batch effects can be seen as a type of noise). Ideally, in the absence of noise presented in scRNA-seq data, identical cell types should cluster closely together in the embedding space. The loss function of TripletCell may force the construction of such an ideal space through a neural network (i.e. closer distances between cells of the same type and further distances between cells of different types), so that the noise is eliminated and the true bio-signals are retained.
Benchmarking TripletCell against state-of-the-art methods
We benchmarked TripletCell with six widely used approaches for cell-type annotation, including Cell_BLAST [41], scVI [42], scPred [43], SCMAPCLUSTER [44], CHETAH [45] and SVM_rejection [14], CellTypist [29]. More details are provided in Supplementary Text S3. Performance evaluation measures are provided in Supplementary Text S4.
RESULTS
Overview of the TripletCell framework
TripletCell deploys three DNNs (i.e. TripletCell-FE) to project the raw scRNA-seq gene expression data into the cell-signature space, where the distance between cells is directly related to intercellular similarity. With the cell-signature space, cell annotation can be formulated as an information retrieval task by assigning the types of query cells according to the cell (in the query dataset)-to-cell (in the reference dataset) distance. TripletCell in general consists of three major steps, including data preprocessing, model construction and cell annotation (Figure 2). In the data preprocessing step, in addition to quality control of the single-cell dataset, we need to maintain the list of genes shared by the reference dataset and the query dataset, and remove their private genes (i.e. genes that only in either the reference or the query dataset). Finally, the reference dataset and query dataset were normalized via log normalization. TripletCell-FE model construction is the core step of TripletCell, where the cells in the reference and query datasets are projected into the cell-signature space using our TripletCell-FE model (refer to the ‘TripletCell implementation’ in Supplementary Text S2 for more details). With TripletCell-FE, in the cell annotation step, we built a K-nearest neighbor classifier (KNN, k = 6) [46] to assign the appropriate cell type for the query cells based on the probability of the cell type generated by the KNN classifier. Specifically, when the highest probability among all the predicted types by the KNN classifier is less than a threshold (which can be configured by users), the type of the query cell will be assigned as ‘Unknown’; otherwise, the cell type with the highest predicted probability will be assigned. Therefore, the cell type of a query cell is determined by the most similar cells determined by TripletCell-FE. TripletCell-FE maps the reference cells and query cells into an embedding space, where the distance between cell points corresponds to the similarity of the cells in the reference dataset. One should bear in mind that if the cell type is predicted as ‘Unknown,’ further confirmation is required using the relevant marker genes. In addition, we proposed three more annotation strategies (Supplementary Text S5) for cell annotation based on the projected cell embedding. The experimental settings of these annotation strategies are demonstrated in Supplementary Text S6 and the performance comparison among different annotation strategies is shown in Supplementary Figure S5. It can be concluded that different annotation strategies lead to inconsistent cell annotation outcomes even when using the same parameters for the TripletCell-FE models. Considering both accuracy and the proportion of cells predicted as ‘Unknown,’ the KNN-based annotation strategy was selected for TripletCell. In addition, we explored the ability of TripletCell to discover new cell types compared to other methods in Supplementary Text S7. We also demonstrated that TripletCell-FE is an effective semi-supervised dimensionality reduction module of TripletCell in Supplementary Text S8 and Supplementary Table S2, respectively.
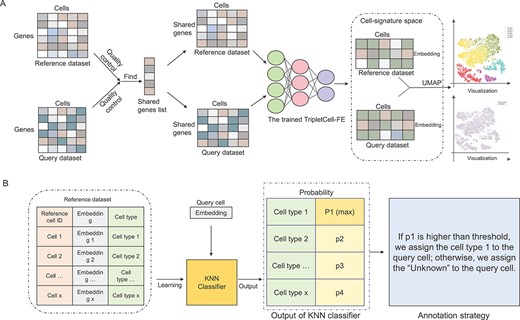
An overview of the TripletCell pipeline for cell-type annotation. (A) The query and reference datasets are respectively projected into the cell-signature space using TripletCell-FE. (B) The cell embedding of the reference dataset is used to train a KNN classifier. Then, the types of query cells are predicted according to the predicted probability of the type generated by the KNN classifier for each query cell.
TripletCell enables cross-sample cell-type annotation using scRNA-seq data
From Supplementary Text S9 and Figure 3A, we can conclude that the compared cell type annotators can generally achieve outstanding performance on the scRNA-seq datasets without batch effects or inconsistencies caused by different protocols and samples. Here, we discussed the ability of TripletCell to perform cross-sample cell-type annotation using scRNA-seq data. Specifically, we evaluated the cell-type annotation performance of TripletCell on the PbmcBench dataset [47], which consists of two samples (i.e. pbmc1 and 2) that were sequenced using seven different sequencing protocols (Supplementary Table S1). We used pbmc1 and 2 as the reference dataset and query dataset, respectively. To evaluate the performance of TripletCell objectively, we removed any novel/unknown cell types from the query dataset that do not appear in the reference dataset. Given that many cell annotation methods offered a rejection option, we also used the unlabeled rate to calculate the proportion of cells in the query dataset that are not assigned with a cell type. These unassigned cells were therefore not considered in the accuracy calculation.
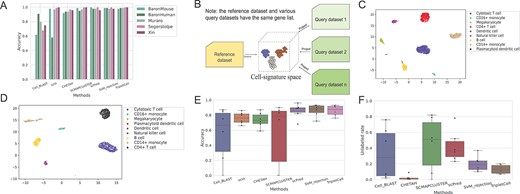
Cell-type annotation performance of TripletCell across scRNA-seq PbmcBench datasets by the same and different sequenced protocols. (A) Performance comparison of cell annotation tools on five pancreatic datasets. (B) The reference data and the individual query data are projected into the cell-signature space. (C) The 2D visualization of embeddings extracted from the reference dataset pbmc1 (X10v2) and query datasets pbmc2 (X10v2) by TripletCell-FE. (D) The 2D visualization of embedding extracted from the reference dataset pbmc1 (DR) and query datasets pbmc2 (DR) by TripletCell-FE. (E and F) Performance comparison of various methods in terms of the accuracy and unlabeled rate across PbmcBench datasets from different samples based on the same protocol. The black line in the rectangular box represents the average value.
First, we projected the reference and query datasets into the cell-signature space (Figure 3B) using the TripletCell-FE model. A 2D visualization was then generated via the UMAP method on the reference and query datasets (Figure 3C and D and Supplementary Figure S6). We can see that TripletCell-FE accurately projected the reference and query datasets into the cell-signature space, where cells of the same type were clustered together. For example, from the reference and query datasets generated by X10v2 (Figure 3C), most cells of the same cell type were clustered together, except for very few cytotoxic T cells were incorrectly clustered as CD4+ T cells. This is presumably because cytotoxic T and CD4+ T cells are functionally close and might be incorrectly annotated.
We also evaluated the performance of TripletCell against other widely used cell-annotation methods in terms of annotation accuracy and unlabeled rate. Given that all novel/unknown cell types from the query dataset compared to the reference datasets have been removed, a lower unlabeled rate indicates that TripletCell can annotate more query cells. While a higher annotation accuracy indicates that TripletCell annotates the cell types more accurately. Both measures (i.e. accuracy and unlabeled rate) should be used to provide a more objective performance comparison of these cell-type annotation approaches. As scVI does not provide a rejection option, it was not included in the performance comparison. From Figure 3E and F, we can see that TripletCell achieved an outstanding and balanced cell-type annotation performance. TripletCell achieved a satisfactory annotation accuracy, which is slightly lower than scPred and SVM_rejection (about 2% and 1.3%), respectively. Furthermore, TripletCell achieved the lowest unlabeled rate, 20% lower than scPred and 3.6% lower than SVM_rejection, respectively. In addition, although CHETAH achieved the lowest unlabeled rate, its annotation accuracy is significantly lower than scPred, SVM-rejection and TripletCell. Taken together, TripletCell can both effectively alleviate the batch effects by different samples with the same protocol and achieve outstanding performance in cell-type annotation performance.
TripletCell enables cross-protocol cell-type annotation using scRNA-seq data
To date, many scRNA-seq protocols have been applied, such as 10X version 2 (X10v2), CEL-Seq2 (CL) and Drop-Seq (DR). The technical difference of such protocols may lead to significant batch effects among the different datasets, posing a considerable challenge for cell-type annotation across protocols. In this section, we benchmarked the ability of TripletCell to accurately predict cell types using the datasets generated by different scRNA-seq protocols. We selected seven pbmc1 samples from the PbmcBench datasets (Supplementary Table S1), which were sequenced using seven different protocols. Each dataset was treated in turn as the reference and query dataset once, respectively. As a result, a total of 42 dataset pairs were generated. Note that we have again removed the cells of unknown/novel types in the query dataset that do not appear in the reference dataset. The annotation performances of all 42 experiments are shown in Figure 4A and Supplementary Figure S7. Similarly, as scVI does not provide a rejection option, it was not included in the performance comparison using the unlabeled rate.
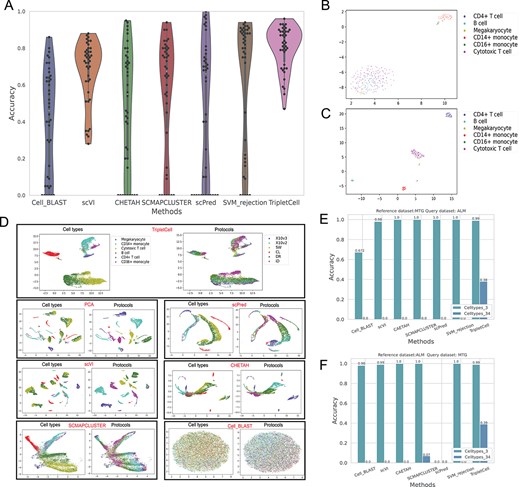
Performance benchmarking of TripletCell against state-of-the-art approaches on different types of scRNA-seq datasets. (A) Performance comparison of different cell annotation tools on the PbmcBench datasets generated using seven different protocols, the number corresponding to each method indicates the average accuracy of the 42 experiments. (B) The raw pbmc1 (SM2) dataset is shown in the 2D space by UMAP. (C) The reference dataset (pbmc1 (SM2)) projected by TripletCell-FE shown in the 2D space using UMAP; (D) When using pbmc1 (SM2) as the reference dataset, performance comparison of pbmc1 (combination of other six protocols) among PCA, TripletCell-FE, scPred, scVI, SCMAPCLUSTER, CHETAH and Cell_BLAST is shown and colored by their cell types and protocols using UMAP, respectively. (E) Performance comparison of each method in terms of accuracy when the reference and query datasets are MTG dataset and ALM dataset, respectively. (F) Performance comparison of each method in terms of accuracy when the reference and query datasets are ALM dataset and MTG dataset, respectively.
According to Figure 4A, TripletCell outperformed all other compared cell-type annotation approaches in terms of accuracy (a mean accuracy of ~80%). In particular, TripletCell outperformed the second best-performing approach, SVM_rejection, by ~17% in terms of accuracy. Despite that in some rare cases scPred achieved an accuracy of 100%, all other methods, except for TripletCell, had a 100% error rate for certain dataset pairs. This is because of the misprediction of the ‘Unknown’ type for the query cells, which was probably impacted by the batch effects from different scRNA-seq protocols. In terms of unlabeled rate, TripletCell achieved a mean unlabeled rate of 18.3%, outperforming the SVM_rejection by 32% (Supplementary Figure S7). In addition, all the benchmark approaches, excluding CHETAH and TripletCell, had a 100% unlabeled rate at least once. These benchmarking experiments indicate that TripletCell can accurately annotate cell types even from learning the reference datasets generated by a different scRNA-seq technique. To conclude, TripletCell achieved robust and accurate performance of cell-type annotation, regardless of the scRNA-seq protocols used to generate the reference and query dataset.
We further analyzed the ability of TripletCell to effectively alleviate batch effects induced by different protocols. First, to validate TripletCell's ability to construct reference datasets, the raw pbmc1 (SM2) dataset is shown in the 2D space and the corresponding projected embedding extracted by TripletCell-FE in the 2D space using UMAP [48] (Figure 4B and C). In 2D space, cells of the same cell type are clustered together, which indicates TripletCell-FE can successfully construct a well-defined reference dataset. Then, we used each Pbmc1 dataset as the reference dataset and the other six Pbmc1 datasets as the query datasets and compared their 2D space mapping of the cell embeddings generated with various methods. The results are demonstrated in Figure 4D and Supplementary Figures S8–S20. Figure 4D shows that the feature processing methods used in the benchmark cell-type annotation methods can not eliminate batch effects. Specifically, many cells of the same type do not cluster together, including B cell, CD14+ monocyte, CD4+ T cell and CD16+ monocyte. In addition, Cell_BLAST had a poor prediction performance. This is because Cell_BLAST employs an adversarial network, which requires a large amount of data to train. However, the samples of the pbmc1 (SM2) dataset are not sufficient to train an accurate adversarial network. When using the larger pbmc1 (X10v2) data as the reference dataset, Cell_BLAST achieved a higher cell-type annotation performance (Supplementary Figure S8). After the projection by TripletCell-FE, the cells (from six different protocols) of the same types were clustered together. For example, as shown in the left panel of Figure 4D (TripletCell), B cells clustered well and the corresponding region of B cells was populated with various protocols, suggesting that the batch effect has been successfully alleviated by TripletCell-FE.
TripletCell enables cross-species cell-type annotation using scRNA-seq data
In this section, we further examined the ability of TripletCell to perform cross-species cell-type annotation. We collected two different brain datasets including ALM [49] and MTG [50], from mice and humans, respectively (Supplementary Table S1). Each data were used as the reference and query dataset once during the experiment. Both ALM and MTG datasets contain two levels of annotation, including a shallower annotation of three cell types and a more specific and detailed level of annotation (i.e. 34 different cell types) [14]. We therefore conducted the experiments separately according to the annotation level of the datasets. All experimental results are illustrated in Figure 4E and F and Supplementary Figure S21.
It can be seen from Figure4E and F that most methods performed well when using the shallower annotation (i.e. three cell types) level, with the only exception of scPred that did not return any correct predictions using ALM as the reference dataset. Other methods, including CHETAH [45], SCMAPCLUSTER [44], scPred [43] and SVM_rejection [14], achieved an accuracy of 100% when using the MTG dataset as the reference and the ALM dataset as the query dataset; while TripletCell achieved a slightly lower accuracy (99%). However, CHETAH, SCMAPCLUSTER and scPred achieved a much higher unlabeled rate when using either MTG or ALM as the reference dataset. TripletCell, on the other hand, only had an average unlabeled rate of 0.1%. These results suggest that these methods could not recognize cells accurately from the same tissue across different species. However, TripletCell achieved outstanding and balanced cell annotation performance using either ALM or MTG as the reference dataset. It is also worth noticing that when using the deeper annotation label (i.e. 34 cell types annotated) [47, 49, 50], the cell-annotation task became challenging for all approaches. Regardless, TripletCell still achieved a more encouraging performance in terms of accuracy and unlabeled rate compared to other state-of-the-art approaches, highlighting its strong generalizability.
Performance comparison between TripletCell and CellTypist on the immune cell dataset
To explore the ability of TripletCell to identify cell types in large-scale immune cell dataset, we compared cell annotation performance and running time with CellTypist, a supervised neural network method focused on immune cells. Table 1 shows the results of the 5-fold cross-validation on the immune cell dataset.
Performance and run time comparison of TripletCell and CellTypist on the immune cell dataset
| Method | 1-fold (accuracy) | 2-fold (accuracy) | 3-fold (accuracy) | 4-fold (accuracy) | 5-fold (accuracy) | Average time |
|---|---|---|---|---|---|---|
| CellTypist | 0.7901 | 0.7709 | 0.7927 | 0.813 | 0.794 | 376 min |
| TripletCell | 0.8429 | 0.8492 | 0.8543 | 0.8347 | 0.858 | 117 min |
| Method | 1-fold (accuracy) | 2-fold (accuracy) | 3-fold (accuracy) | 4-fold (accuracy) | 5-fold (accuracy) | Average time |
|---|---|---|---|---|---|---|
| CellTypist | 0.7901 | 0.7709 | 0.7927 | 0.813 | 0.794 | 376 min |
| TripletCell | 0.8429 | 0.8492 | 0.8543 | 0.8347 | 0.858 | 117 min |
TripletCell outperformed CellTypist in every fold in terms of accuracy (Table 1), which can be explained as follows: (1) in general, the deeper the neural network is, the stronger the ability is to learn features [51, 52]. Deeper networks of TripletCell assist in uncovering non-linear relationships between genes and cell types; and (2) the goal of the loss function in TripletCell is to obtain closer distances between cells of the same type and farther distances between cells of different types in the embedding space, allowing the neural network to learn more discriminative features. In addition, since CellTypist (Intel(R) Xeon(R) CPU E5-2630 was employed to run CellTypist in this study) does not offer a GPU acceleration option, the network training consumed more time than TripletCell. Taken together, TripletCell can also be used as a reliable method for cell type identification in immune cells.
Biological relevance of cell embedding
Our experimental results demonstrated that the embedding of TripletCell-FE extraction is particularly beneficial for cell-type identification. A close inspection and further interpretation of the embedding from the biological perspective is therefore essential for biologists to have a better understanding of the evolution of cells. Here, we used pbmc1 (iD) as the reference dataset to train TripletCell, and subsequently applied the captum package [53] to identify the important genes corresponding to the embeddings of different cell types. For the query dataset, the other pbmc datasets were combined to construct the query dataset. A heatmap of the top 5 important genes for different cell types in the query dataset is illustrated in Figure 5. We can see that the important genes are specific for the corresponding cell types (in view of the small sample size of the plasmacytoid dendritic cell, we did not count its important genes). For example, the NKG7, PRF1, CCL5 and CST7 genes are highly expressed in cytotoxic T cells. In addition, by querying against the Cellmarker database [9], we found that NKG7, PRF1, CCL5, CST7 genes are marker genes of cytotoxic T cells. Such embeddings were extracted by TripletCell-FE mainly through search for cell type-specific genes, thereby indicating that they represent important components which are informative for cell-type annotation.
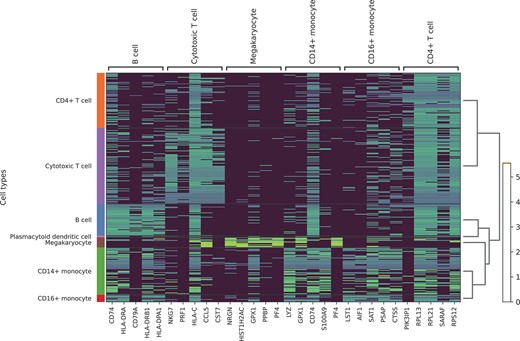
Heatmaps of the top five important genes for different cell types in the query dataset.
DISCUSSION
In this study, we proposed an accurate cell annotation pipeline, termed TripletCell, which leverages the deep metric learning technique to effectively mine the cell-type information from scRNA-seq data. Performance benchmarking experiments across different samples, species and scRNA-seq protocols suggest that TripletCell is a powerful and robust cell-type annotator. By projecting the reference and query datasets into cell-signature space using TripletCell-FE, the batch effect generated by different samples/protocols can be effectively alleviated. Moreover, to enable the discovery of new cell types, we have provided a rejection option based on the predicted probability of each cell type. In particular, if the cell type is assigned with a lower probability, TripletCell would assign a label of ‘new type’ to the query cell. Furthermore, as TripletCell extracts discriminative features from annotated transcriptome data, TripletCell can also be applied to identify cells from various species, such as pathogens including bacteria, mycoplasma and fungi, upon the availability of high-quality scRNA-seq data of these species.
Despite the promising cell-type annotation performance, several issues/limitations remain to be addressed. First, as TripletCell uses a labeled reference dataset to train the feature extractor, its performance relies on the accuracy of the cell-type annotation in the reference dataset. Second, although TripletCell can perform cross-species cell-type annotations using scRNA-seq data, its accuracy of cell subtype prediction at a deeper annotation level still requires further improvement. Third, the cell-type annotation performance is negatively impacted if the availability of certain cell types in the training dataset is limited. In addition, for training TripletCell, we recommended using a GPU with large memory for greater training efficiency and faster network convergence. In our future work, we will endeavor to update our TripletCell using the updated cell type data, thereby addressing the above issues and further improving the cell-type annotation performance of TripletCell.
TripletCell is a deep metric learning framework for cross-species, cross-protocol and cross-sample cell-type annotation.
Within TripletCell, we proposed a novel deep metric-based framework to extract discriminative features from scRNA-seq data analysis data, termed TripletCell-FE.
TripletCell can also detect novel cell types (absent from the reference dataset) for the query cells.
We demonstrated our proposed TripletCell method can effectively mitigate the batch effects caused by different scRNA-seq techniques.
FUNDING
This work was financially supported by the National Natural Science Foundation of China (62072243, 61772273 and 61872186); Natural Science Foundation of Jiangsu (No. BK20201304); Foundation of National Defense Key Laboratory of Science and Technology (JZX7Y202001SY000901); National Health and Medical Research Council of Australia (NHMRC) (1127948, 1144652); Australian Research Council (ARC) (LP110200333 and DP120104460); US National Institutes of Health (R01 AI111965) and a Major Inter-Disciplinary Research (IDR) project awarded by Monash University.
AUTHORS' CONTRIBUTIONS
Y.L. and G.W. conceived of the idea and designed experiments, Y.L. and L.-C.S. implemented the software and performed experiments. C.L. contributed to the data analysis. Y.L., C.L., R.B.S., J.S., D.C. and D.-J.Y. all contributed to the writing of the paper. All authors read and approved the final manuscript.
DATA AVAILABILITY
The datasets used in this papper are downloaded from https://zenodo.org/record/3357167#.ZCk5sntByUk.
Author Biographies
Yan Liu received his M.S. degree in computer science from Yangzhou University in 2019. He is currently a PhD candidate in the School of Computer Science and Engineering at Nanjing University of Science and Technology and a member of the Pattern Recognition and Bioinformatics Group. His research interests include pattern recognition, machine learning and bioinformatics.
Guo Wei received her M.S. degree in computer science from Dalian Maritime University in 2019. She is currently a PhD candidate in the School of Life Sciences, Nanjing University and a member of the Gattaca lab. Her research interests include pattern recognition, machine learning and bioinformatics.
Chen Li is a research fellow in the Biomedicine Discovery Institute and Department of Biochemistry and Molecular Biology, Monash University. His research interests include systems proteomics, immunopeptidomes, personalized medicine and experimental bioinformatics.
Long-Chen Shen received his M.S. degree in software engineering from Nanjing University of Science and Technology in 2021. He is a PhD candidate in the School of Computer Science and Engineering, Nanjing University of Science and Technology and a member of the Pattern Recognition and Bioinformatics Group. His current interests include pattern recognition, data mining and bioinformatics.
Robin B. Gasser is currently a Redmond Barry distinguished professor in the Faculty of Veterinary and Agricultural Sciences, The University of Melbourne. He is a fellow of the Australian Academy of Science (FAA). His research is focused on investigating socio-economically important parasites (including protozoa, trematodes, cestodes and nematodes) using genetic, genomic and bioinformatic approaches, in order to understand the biology and molecular biology of parasites, parasitic diseases and host–parasite interactions and to develop improved diagnostic and intervention methods.
Jiangning Song is an associate professor and group leader in the Monash Biomedicine Discovery Institute and the Department of Biochemistry and Molecular Biology, Monash University, Melbourne, Australia. He is also a member of the Monash Data Futures Institute and Alliance for Digital Health at Monash, Faculty of Information Technology, Monash University. His research interests include bioinformatics, computational biomedicine, machine learning, data mining and pattern recognition.
Dijun Chen received his PhD degree from Martin Luther University of Halle-Wittenberg and postdoctoral training from Humboldt-Universität zu Berlin, Germany. He is currently a full associate professor in the School of Life Sciences at Nanjing University. His research interests include bioinformatics, omics data exploration, machine learning and big data visualization.
Dong-Jun Yu received the PhD degree from Nanjing University of Science and Technology in 2003. He is currently a full professor in the School of Computer Science and Engineering, Nanjing University of Science and Technology. His research interests include pattern recognition, machine learning and bioinformatics. He is a senior member of the China Computer Federation (CCF) and a senior member of the China Association of Artificial Intelligence (CA).
