


Abstract
Discovering the relationships between long non-coding RNAs (lncRNAs) and diseases is significant in the treatment, diagnosis and prevention of diseases. However, current identified lncRNA-disease associations are not enough because of the expensive and heavy workload of wet laboratory experiments. Therefore, it is greatly important to develop an efficient computational method for predicting potential lncRNA-disease associations. Previous methods showed that combining the prediction results of the lncRNA-disease associations predicted by different classification methods via Learning to Rank (LTR) algorithm can be effective for predicting potential lncRNA-disease associations. However, when the classification results are incorrect, the ranking results will inevitably be affected. We propose the GraLTR-LDA predictor based on biological knowledge graphs and ranking framework for predicting potential lncRNA-disease associations. Firstly, homogeneous graph and heterogeneous graph are constructed by integrating multi-source biological information. Then, GraLTR-LDA integrates graph auto-encoder and attention mechanism to extract embedded features from the constructed graphs. Finally, GraLTR-LDA incorporates the embedded features into the LTR via feature crossing statistical strategies to predict priority order of diseases associated with query lncRNAs. Experimental results demonstrate that GraLTR-LDA outperforms the other state-of-the-art predictors and can effectively detect potential lncRNA-disease associations. Availability and implementation: Datasets and source codes are available at http://bliulab.net/GraLTR-LDA.
Introduction
Long non-coding RNAs (lncRNAs) play an important role in the processes of many human diseases. More and more evidences indicate that emergence and development of many diseases are related with gene expression regulated by several lncRNAs. For example, lncRNA LUCAT1 regulates microRNA-7-5p and reduces its expression to promote breast cancer development, which has been regarded as a potential therapeutic target [1]. With the development of high-throughput sequencing technology and the establishment of disease databases, many lncRNA sequence data and disease semantic information have been generated, which can be used to more comprehensively analyze associations between lncRNAs and diseases. In order to assist clinical diagnostics, many databases (LncRNADisease [2], Lnc2Cancer [3], etc.) have been established to record experimentally validated lncRNA-disease associations reported in the literature [4–6], based on which various computational methods were proposed to identify lncRNAs associated with diseases [7, 8]. In addition, the newly released database contains newly added associations between known lncRNAs and known diseases, indicating that many associations between lncRNAs and diseases have not been detected. Therefore, it is important to develop computational methods for predicting lncRNA-disease associations.
Existing computational methods can be divided into the following types: network-based methods, matrix factorization methods, random walk methods, machine learning (ML) methods and deep learning methods [9–13]. For network-based methods, LRLSLDA [14] is the first computational model and opens the door to research on the field of lncRNA-disease association identification from a computational perspective, which combined lncRNA-disease association network and lncRNA expression similarity network for identifying potential lncRNA-disease associations. Li et al. [15] introduced a model based on network consistency projection (NCPLDA) for lncRNA-disease association detection by integrating the lncRNA-disease association network, the disease similarity network and the lncRNA similarity network. For matrix factorization method, Lu et al. [16] designed an inductive matrix completion framework (SIMCLDA) for completing the association matrix by extracting primary feature vectors from the functional similarity network of diseases and interaction network of lncRNAs. For random walk methods, Xie et al. [17] implemented an unbalanced bi-random walk algorithm for predicting lncRNA-disease associations by the linear neighbor similarity reconstructed through lncRNA and disease network. However, network-based methods, matrix factorization methods and random walk methods cannot efficiently capture the complex non-linear connection between lncRNAs and diseases.
Machine learning methods treat lncRNA-disease association identification as a classification task. Guo et al. [18] applied auto-encoder neural network to obtain the optimal feature vectors of lncRNA-disease pairs, and then the feature vectors were fed into the rotating forest to predict potential lncRNA-disease associations (LDASR). Zhang et al. [19] fused multiple similarity data to construct feature vectors, and utilized Gradient Boosting to identify the associations between diseases and lncRNAs (LDNFSGB). Zhu et al. [20] proposed an incremental principal component analysis method to decrease the dimension of feature vectors, based on which a random forest predictor was trained to detect latent lncRNA-disease associations (IPCARF).
Deep learning methods have strong learning abilities by constructing complex neural networks. Zeng et al. [21] improved the prediction performance of lncRNA-disease associations by establishing a deep matrix factorization (DMFLDA). Wei et al. [22] combined convolution neural network framework and a 3D feature block based on similarity matrices to predict potential lncRNA-disease associations. Recently, inspired by the successful application of graph convolution neural network (GCN) [23] in the convolution operation of unstructured graph data, many methods combined the GCN-based deep learning algorithms and the graph to detect the associations between lncRNAs and diseases. Shi et al. [24] used graph auto-encoder to obtain graph embedding features and predicted potential lncRNA-disease associations (VAGELDA). Fan et al. [25] designed a graph convolutional matrix completion framework (GCRFLDA) to calculate the lncRNA-disease association score matrix by decoding embedding features extracted from the constructed lncRNA-disease graph. Lan et al. [26] predicted lncRNA-disease interactions by combining graph attention network and heterogeneous graph data of lncRNA and diseases (GANLDA). These GCN-based methods not only make great contributions to this field, but also reflect that GCN was particularly suitable for encoding graph nodes into low-dimensional, and has highly discriminative power embedded features. Besides, the related predictors for other similar tasks can contribute to identify lncRNA-disease associations, such as miRNA-disease association [27–29].
Learning to rank (LTR) [30] is a supervised algorithm, which is initially employed in retrieval tasks. In the field of web retrieval, LTR can rank the candidate websites according to the degree of correlation with queries [30]. LTR has been successfully applied to natural language processing and information retrieval, such as machine translation [31], recommender system [32], online advertisement [30], etc. For different application scenarios, LTR can be classified into three types: pointwise, pairwise and listwise. Listwise has been widely used in bioinformatics, such as human protein–phenotype association detection [33], protein remote homology prediction [34–36] and drug–target binding affinity prediction [37], etc. Recently, some methods treated lncRNA-disease association prediction as a search ranking problem, and consider the association between lncRNA and disease as an one-to-many relationship. LncRNAs and diseases can be regarded as query topics and documents, respectively. Therefore, LTR algorithm [30] can be used to predict latent lncRNA-disease associations. For example, Wu et al. [38] used the prediction results of the lncRNA-disease association predicted by different classification methods as the feature vectors of the lncRNA-disease pairs, which were fed into the supervised learning algorithm LTR [30] to re-calculate the relevant degree between lncRNAs and diseases (iLncDA-LTR). The experimental results showed that it has achieved the state-of-the-art performance. However, when the classification results are wrong, the ranking results will inevitably be affected, leading to the top predicted diseases unrelated to the query lncRNAs. In addition, directly fusing the final prediction results of the classification method as the ranking features may leave out important original information. As discussed above, embedded features can maximize the preservation of the topological information of the original graph. If so, can we use embedded features to replace classification results for solving the above shortcoming?
To answer this question, as shown in Figure 1, we treat the lncRNA-disease association prediction as a graph-based search task, which is similar as the searching task of searching associated movies for query actor in search engine. Graph-based knowledge storage is a kind of structured knowledge representation in knowledge graph. The current advanced search engines utilize the entity knowledge in the structured knowledge graph to find the entities associated with the query entities. For the lncRNA-disease association search task, the lncRNA-disease association graph is considered as biological knowledge graph.
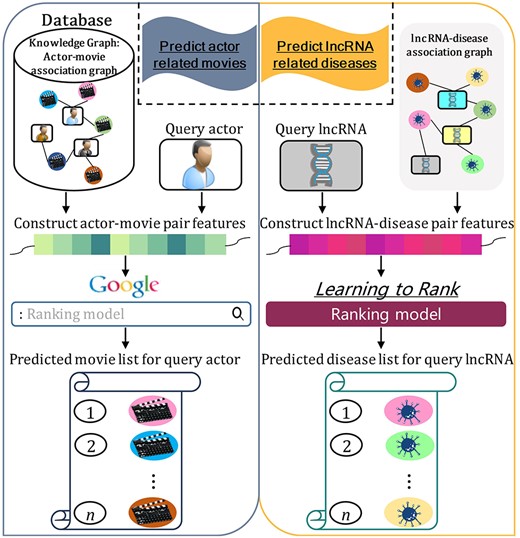
The similarities between the task of searching actor-movie associations in search engine combined with knowledge graph, and the graph-based lncRNA-disease association search task.
Therefore, we propose a new predictor called GraLTR-LDA to predict missing lncRNA-disease associations. GraLTR-LDA utilizes the feature crossing statistical method [32] to incorporate the embedded features into LTR to predict priority order of diseases related with query lncRNAs. In particular, we construct two kinds of graphs: (i) Homogeneous graph based on lncRNA sequence similarity and homogeneous graph based on disease semantic similarity. (ii) Heterogeneous graph combining lncRNA-disease association network and the above constructed homogeneous graphs. We combine graph auto-encoder [39] and attention mechanism [40] to obtain embedded features from the two kinds of graphs. Experimental results on independent dataset show that GraLTR-LDA outperforms the other existing methods for identifying missing lncRNA-disease associations.
Methods
Problem formulation
Given |$n$| lncRNAs |$\mathcal{L}=\{{l}_1,{l}_2,\dots, {l}_n\}$| and |$m$| diseases |$ \mathcal{D} =$||$\{{d}_1,{d}_2,\dots, {d}_m\}$|, the lncRNA-disease association network is represented by an interaction matrix |$\mathrm{Y}\in{\mathbb{R}}^{n\times m}$|. |$\mathrm{Y}(i,j)=1$| if lncRNA |${l}_i$| is verified related with disease |${d}_j$|; otherwise, |$\mathrm{Y}(i,j)=0$|. The purpose of our task is to predict missing associations between known lncRNAs and known diseases.
Methods overview
The framework of GraLTR-LDA with three main steps (construction of homogeneous graph and heterogeneous graph, feature representation and ranking diseases) is illustrated in Figure 2.
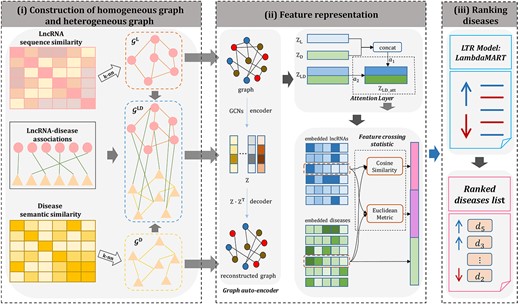
The overall framework of GraLTR-LDA. (i) Construction of homogenous graph and heterogeneous graph: homogeneous graphs |${\mathcal{G}}^{\mathrm{L}}$| and |${\mathcal{G}}^{\mathrm{D}}$| are constructed based on the top k most similarity information from calculated lncRNA sequence similarity matrix and disease semantic similarity matrix, respectively. Besides, the heterogeneous graph |${\mathcal{G}}^{\mathrm{LD}}$| is constructed by incorporating |${\mathcal{G}}^{\mathrm{L}}$|, |${\mathcal{G}}^{\mathrm{D}}$| and lncRNA-disease associations network. (ii) Feature representation: the node embedding matrices are learned from |${\mathcal{G}}^{\mathrm{L}}$|, |${\mathcal{G}}^{\mathrm{D}}$| and |${\mathcal{G}}^{\mathrm{LD}}$| by graph auto-encoder. Then, the attention layer is applied to integrate the embedding matrices from different graphs for constructing a global node embedding matrix |${\mathrm{Z}}_{\mathrm{LD}\_\mathrm{att}}$|. For any lncRNA-disease pair, GraLTR-LDA integrates the two kinds of features computed based on the feature crossing statistical method and the embedded vectors of diseases as the final features. (iii) Ranking diseases: the final features are inputted into the ranking model LambdaMART, based on which the diseases related with query lncRNA are ranked according to the predicted lncRNA-disease association scores calculated by the ranking model.
Graph construction
Construction of homogeneous graph
Because similar lncRNAs tend to be associated with similar diseases [16, 22], we utilize sequence information of lncRNA to construct the similarities among lncRNAs. The lncRNA sequences are available from Reference Sequence (RefSeq) database (https://ftp.ncbi.nlm.nih.gov/refseq/release/) [41]. Inspired by [22, 38], the lncRNA sequence similarity matrix (LSSM) is constructed by the Needleman–Wunsch alignment method [42].
Since similar diseases tend to be associated with similar lncRNAs [16, 22], disease semantic information is used to calculate disease similarities. The Disease Ontology database [43] is used to obtain term ‘DOID’ of diseases based on which the DOSE package [44] is used to construct the disease semantic similarity matrix (DSSM).
Construction of heterogeneous graph
Feature representation
Encoder
GraLTR-LDA uses the graph auto-encoder [39] to learn embedded features of lncRNA and disease from graphs |${\mathcal{G}}^{\mathrm{L}}$|, |${\mathcal{G}}^{\mathrm{D}}$| and |${\mathcal{G}}^{\mathrm{LD}}$|. Graph auto-encoder model was proposed by Kipf et al. [39] to solve the link prediction problem. Graph auto-encoder includes encoding layers and decoding layers. For a given graph, the encoding layer combines with the graph convolutional network (GCN) [23, 45] to encode graph nodes into low-dimensional embedded features, and the decoding layer decodes the low-dimensional embedded features to reconstruct the original graph. The obtained low-dimensional embedded features are often used to support downstream tasks, such as node classification [39], link prediction [25], etc. In the encoding layer, the node embedding matrix of the target graph is calculated by using GCN [23, 45] encoding the adjacency matrix and the feature matrix of the target graph.
Decoder
Attention layer
Optimization
In addition, the Adam optimizer [47] is adopted as the optimizer.
Feature crossing statistical strategy
Ranking diseases
LTR was widely used in the field of information retrieval, and the goal of LTR is to produce a permutation of a group of documents having the most relevant documents on the top of the result list [30, 51, 52]. At present, many bioinformatic problems can be solved by LTR, such as protein remote homology prediction [34–36], human protein–phenotype association detection [33], circRNA-disease association prediction [53] and drug–target binding affinity prediction [37]. LambdaMART algorithm [54] belongs to the listwise approach of LTR, which has been successfully applied to predict lncRNA-disease associations [38]. In this paper, we apply normalized discounted cumulative gain (NDCG) [55] as the loss function of LambdaMART algorithm to predict lncRNA-disease associations. The fixed data format {|$\mathrm{Y}$|(|${l}_q,{d}_e$|)|$, {l}_q$|, |${\varphi}^{LTR}({l}_q,{d}_e)$|} is fed into the ranking model LambdaMART, where |${l}_q$| and |${d}_e$| denote the query lncRNA and the candidate disease, respectively. Finally, the disease list related to query lncRNA is ranked according to the predicted lncRNA-disease association scores by the ranking model.
Experiments
Data
In this paper, training set |${\mathbb{S}}_{\mathrm{training}}$| and independent set |${\mathbb{S}}_{\mathrm{independent}}$| are obtained from previous work [38], and they are used to simulate the scenario of identifying missing lncRNA-disease associations. Specifically, lncRNA-disease associations contained in the dataset |${\mathbb{S}}_{\mathrm{training}}$| come from LncRNADisease database (v2017) [2], and lncRNA-disease associations contained in the dataset |${\mathbb{S}}_{\mathrm{independent}}$| are from LncRNADisease v2.0 database [56]. Following previous studies [16, 20, 25, 57], if the lncRNA-disease associations are recorded in the LncRNADisease, they are considered as positive samples. Otherwise, they are negative samples. The statistical information of training set and independent set is listed in Table 1.
Statistical information of dataset |${\mathbb{S}}_{\mathrm{training}}$| and |${\mathbb{S}}_{\mathrm{independent}}$|.
| Date set | LncRNA | Disease | Positive | Negative |
|---|---|---|---|---|
| |${\mathbb{S}}_{\mathrm{training}}$| | 404 | 190 | 1044 | 69,150 |
| |${\mathbb{S}}_{\mathrm{independent}}$| | 169 | 71 | 463 | 6103 |
| Date set | LncRNA | Disease | Positive | Negative |
|---|---|---|---|---|
| |${\mathbb{S}}_{\mathrm{training}}$| | 404 | 190 | 1044 | 69,150 |
| |${\mathbb{S}}_{\mathrm{independent}}$| | 169 | 71 | 463 | 6103 |
Metrics and parameter settings
Four metrics are used to evaluate the overall performance of different predictors: (i) area under the receiver operating characteristics curve (AUC) [58], (ii) area under the precision-recall curve (AUPR), (iii) ROCk [59] and (iv) NDCG@k [55]. AUC measures specificity and sensitivity, and AUPR more focuses on punishing false positives. ROCk and NDCG@k reflect the ranking quality of the recall results for information retrieval tasks [38, 55]. Higher ROCk and NDCG@k values indicate better ranking quality.
In this study, we implement GraLTR-LDA in Pytorch deep learning framework and Ranklib library. In the process of generation of the embedded representation, the dimensions of embedded features in the first layer GCN and the second layer GCN are set as 256 and 128, respectively. The dropout rate is set as 0.0005, and the initial learning rate is set to 0.01. The value of tree is the main parameter of the LambdaMART algorithm. We compare the performance changes of different numbers of trees of GraLTR-LDA by tenfold cross-validation on |${\mathbb{S}}_{\mathrm{training}}$|. As shown in Figure 3, GraLTR-LDA obtains the best performance when tree is set as 50.
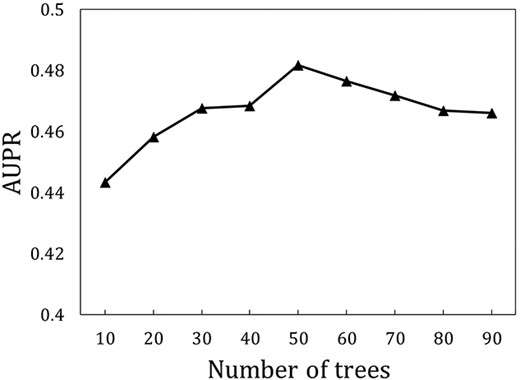
The AUPR values of GraLTR-LDA predictor with different number of trees via the ten-fold cross-validation on |${\mathbb{S}}_{\mathrm{training}}$|.
Comparison with the other methods
As discussed in the introduction section, several lncRNA-disease association identification methods have been proposed. In this section, we compare the performance of GraLTR-LDA with the state-of-the-art methods based on different theories on |${\mathbb{S}}_{\mathrm{independent}}$|. Three machine-learning-based methods are selected, including LDASR [18], LDNFSGB [19] and IPCARF [20]. These methods employ different kinds of machine learning classifiers. Two network-based methods (SIMCLDA [16] and NCPLDA [15]) are also selected for comprehensive performance comparison. The deep-learning-based methods DMFLDA [21] is selected, and it only uses the known lncRNA-disease association for prediction. Three graph-based methods (VAGELDA [24], GCRFLDA [25] and GANLDA [26]) are selected, and they are the recently proposed computational methods based on graph neural network. The ranking method iLncDA-LTR [38] is selected as well. These comparison methods are reproduced by using the parameter settings and corresponding codes reported in the corresponding papers. All evaluation metrics are average values of all query lncRNAs, and the results of the comparison are shown in Table 2. We can see the followings: (i) The GraLTR-LDA predictor outperforms the iLncDA-LTR, indicating that combining the graph-based embedded features into the ranking framework (LTR) is a more efficient way for predicting lncRNA-disease associations. (ii) The performance of GraLTR-LDA is superior with the other graph-based methods (VAGELDA, GCRFLDA and GANLDA). The reason is that GraLTR-LDA further processes the attention-mechanism-based embedded features learned from homogeneous and heterogeneous graphs by using the feature crossing statistical method. (iii) GraLTR-LDA is comparable with these advanced computational methods. In particular, GraLTR-LDA achieves the best performance in terms of NDCG@10 and AUC. The GraLTR-LDA model is based on a supervised learning ranking framework, leading to excellent performance in terms of the NDCG@10 metric [38, 55]. We further compared the quality of the top ranked associations predicted by different prediction methods as shown in Figure 4. These results further indicate that the GraLTR-LDA predictor can effectively improve the predictive performance.
The performance comparison between GraLTR-LDA and the other methods on |${\mathbb{S}}_{\mathrm{independent}}$|.
| Methods | AUC | AUPR | NDCG@10 |
|---|---|---|---|
| LDASR | 0.7342 | 0.2716 | 0.3970 |
| LDNFSGB | 0.7520 | 0.2304 | 0.3640 |
| IPCARF | 0.7956 | 0.3423 | 0.4682 |
| SIMCLDA | 0.7535 | 0.1784 | 0.3135 |
| NCPLDA | 0.8198 | 0.3680 | 0.4724 |
| DMFLDA | 0.7856 | 0.3004 | 0.4305 |
| VAGELDA | 0.7245 | 0.3173 | 0.4159 |
| GCRFLDA | 0.7690 | 0.3267 | 0.4219 |
| GANLDA | 0.7149 | 0.2872 | 0.4006 |
| iLncDA-LTR | 0.7805 | 0.3174 | 0.4264 |
| GraLTR-LDA | 0.8352 | 0.3597 | 0.5216 |
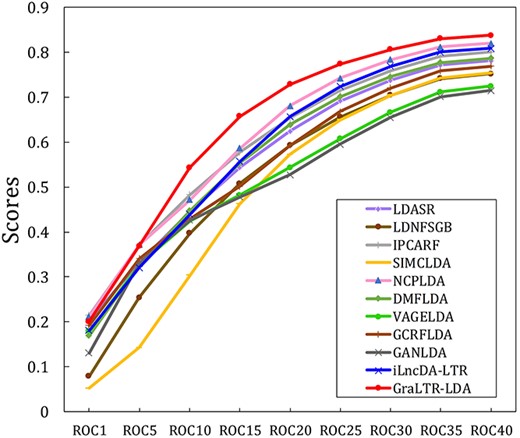
ROCk scores are obtained by different computational methods on |${\mathbb{S}}_{\mathrm{independent}}$|.
Feature analysis
In this paper, the feature crossing statistical method tightly couples the embedded features of lncRNA and the embedded features of disease to measure the correlation of lncRNA-disease pairs (Eqs (27) and (28)). The feature vector |${\varphi}^{LTR}({l}_q,{d}_e)$| of lncRNA-disease pair includes crossing statistical features |${\mathrm{Y}}_1({l}_q,{d}_e)$|, |${\mathrm{Y}}_2({l}_q,{d}_e)$| and the graph attribute features of disease |${\mathrm{Z}}_{\mathrm{LD}\_\mathrm{att}}({d}_e)$|. We explore the effectiveness of |${\mathrm{Y}}_1({l}_q,{d}_e)$|, |${\mathrm{Y}}_2({l}_q,{d}_e)$| and |${\mathrm{Z}}_{\mathrm{LD}\_\mathrm{att}}({d}_e)$| on |${\mathbb{S}}_{\mathrm{independent}}$|. As shown in Table 3, the model based on both features |${\mathrm{Y}}_1({l}_q,{d}_e)$| and |${\mathrm{Y}}_2({l}_q,{d}_e)$| performs better than the model based on only one feature. Furthermore, experimental results show that the model combining all the features outperforms the other models, which indicates that features of |${\mathrm{Y}}_1({l}_q,{d}_e),$||${\mathrm{Y}}_2({l}_q,{d}_e)$| and |${\mathrm{Z}}_{\mathrm{LD}\_\mathrm{att}}({d}_e)$| are complementary.
Predictive performance of various features on |${\mathbb{S}}_{\mathrm{independent}}$|.
| |${\mathrm{Y}}_1({l}_q,{d}_e)$| | |${\mathrm{Y}}_2({l}_q,{d}_e)$| | |${\mathrm{Z}}_{\mathrm{LD}\_\mathrm{att}}({d}_e)$| | AUC | AUPR | NDCG@10 |
|---|---|---|---|---|---|
| ✔ | ✗ | ✗ | 0.7314 | 0.2832 | 0.3837 |
| ✗ | ✔ | ✗ | 0.5584 | 0.1548 | 0.2449 |
| ✔ | ✔ | ✗ | 0.8069 | 0.3025 | 0.4659 |
| ✔ | ✔ | ✔ | 0.8352 | 0.3597 | 0.5216 |
Comparison of two different disease features
The previous study indicated that integrating semantic attribute features of disease to construct the feature vectors of lncRNA-disease pairs can improve the performance of the ranking framework iLncDA-LTR [38]. However, disease features based on semantic similarity cannot fully reflect the associations between lncRNA-disease pairs. Compared to the DSSM(|${d}_e$|) (semantic attribute features of disease), the |${\mathrm{Z}}_{\mathrm{LD}\_\mathrm{att}}({d}_e)$| (graph attribute features of disease) are based on graph auto-encoder and attentional mechanism, which can learn more deep information from multiple graphs. We further compare the influence of two different disease features. For the GraLTR-LDA predictor, we replace |${\mathrm{Z}}_{\mathrm{LD}\_\mathrm{att}}({d}_e)$| in Eq. (29) by DSSM(|${d}_e$|) to get a new model GraLTR-LDA*. As shown in Table 4, GraLTR-LDA is superior with GraLTR-LDA*, indicating that the disease features based on graph attribute features are more critical than the disease semantic attribute features.
Performance comparison between GraLTR-LDA* and GraLTR-LDA on |${\mathbb{S}}_{\mathrm{independent}}$|.
| GraLTR-LDA* | GraLTR-LDA | |
|---|---|---|
| AUC | 0.7509 | 0.8352 |
| AUPR | 0.2426 | 0.3597 |
| NDCG@10 | 0.3599 | 0.5216 |
| GraLTR-LDA* | GraLTR-LDA | |
|---|---|---|
| AUC | 0.7509 | 0.8352 |
| AUPR | 0.2426 | 0.3597 |
| NDCG@10 | 0.3599 | 0.5216 |
The impact of different k values on the performance of GraLTR-LDA
Construction of the similarity graph is the key of GraLTR-LDA. Therefore, we further analyze the influence of different k values on the performance of GraLTR-LDA for identifying lncRNA-disease associations in terms of AUPR (see Figure 5), from which we can see that GraLTR-LDA achieves stable performance and achieves the best performance when k is set as 20. The reason is that the smaller k values lead to sparse edges in the homogeneous graph resulting in insufficient model training, while the larger k values will introduce noise leading to performance decrement.
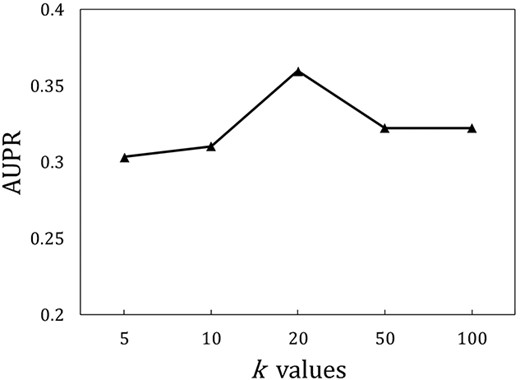
The influence of different k values on the performance of GraLTR-LDA on |${\mathbb{S}}_{\mathrm{independent}}$| in terms of AUPR.
Case study
We implement two different case studies to further examine the performance of the GraLTR-LDA predictor. First, all lncRNA-disease associations on the above datasets are utilized to train the GraLTR-LDA for predicting potential lncRNA-disease pairs. The lncRNA-disease associations predicted by GraLTR-LDA not in LncRNADisease V2.0 database [56] may be correct. Table 5 lists several top predictions of the lncRNA-disease associations are supported by literature, but not in the LncRNADisease V2.0 database [56]. For example, the interaction between lncRNA NEAT1 and activating transcription factor 2 (ATF2) promoted the progression of lung adenocarcinoma [60]. LncRNA PVT1 regulated related downstream factors to promote the development in endometrial cancer [61]. We further provide the prediction results of the other lncRNA related diseases in the source code (http://bliulab.net/GraLTR-LDA).
Top predictions of lncRNA-disease associations with literature evidence
| Rank | Disease | LncRNA | Evidence |
|---|---|---|---|
| 9 | Lung cancer | NEAT1 | PMID:32296457 |
| 10 | Lung adenocarcinoma | PMID:33298086 | |
| 16 | Melanoma | PMID:33202380 | |
| 20 | Pancreatic ductal adenocarcinoma | PMID:34405022 | |
| 10 | Lung adenocarcinoma | PVT1 | PMID:32960438 |
| 17 | Endometrial cancer | PMID:33948369 | |
| 8 | Ovarian cancer | TUSC7 | PMID:32706063 |
| 12 | Esophageal squamous cell carcinoma | PMID:32897196 |
In addition, to further demonstrate the practical ability of GraLTR-LDA for discovering potential lncRNA-disease associations, we use lncRNA MALAT1 as a typical example. We first removed the associations between lncRNA MALAT1 and the other diseases from all lncRNA-disease associations, and then used the remaining associations to train the GraLTR-LDA predictor. The trained predictor is used to re-predict the diseases related with lncRNA MALAT1. As shown in Table 6, top 10 predicted diseases associated with the lncRNA MALAT1 are recorded in the LncRNADisease V2.0 database [56] except for the fourth disease.
The top 10 MALAT1-associated diseases predicted by GraLTR-LDA
| Rank | Disease | Evidence |
|---|---|---|
| 1 | Astrocytoma | LncRNADiseaseV2.0 |
| 2 | Hepatocellular carcinoma | LncRNADiseaseV2.0 |
| 3 | Gastric cancer | LncRNADiseaseV2.0 |
| 4 | Hereditary hemorrhagic telangiectasia | Unconfirmed |
| 5 | Colorectal cancer | LncRNADiseaseV2.0 |
| 6 | Prostate cancer | LncRNADiseaseV2.0 |
| 7 | Ovarian cancer | LncRNADiseaseV2.0 |
| 8 | Non-small cell lung cancer | LncRNADiseaseV2.0 |
| 9 | Breast cancer | LncRNADiseaseV2.0 |
| 10 | Lung cancer | LncRNADiseaseV2.0 |
Conclusion
The previous method showed that combining the prediction results of different classification methods via LTR algorithm is effective for predicting potential lncRNA-disease associations [38]. However, once the classification results are wrong, the ranking results will inevitably be directly affected. Recently, the graph auto-encoder method was used to encode graph nodes into low-dimensional and has highly discriminative power embedded features.
Motivated by incorporating embedded features into the ranking methods, we propose a new predictor GraLTR-LDA for identifying missing lncRNA-disease associations. GraLTR-LDA has two main contributions: (i) Homogeneous and heterogeneous graphs are constructed by integrating multi-source biological information. GraLTR-LDA combines graph auto-encoder and attention mechanism to obtain embedded features from the constructed graphs. (ii) We employ a feature crossing statistical method to incorporate the embedded features into the LTR. LTR has been successfully applied to rank the candidate websites according to the degree of correlation with queries [30, 33]. The task of lncRNA-disease association identification is very similar with the task of searching actor-movie associations in search engine (see Figure 1), where one lncRNA can be associated with many diseases. Therefore, LTR works for lncRNA-disease association prediction. Experimental results show that GraLTR-LDA obviously outperforms the other state-of-the-art methods. In the future, we believe that GraLTR-LDA can be applied to the other similar tasks, such as protein–protein interaction prediction [62], drug–disease association prediction [63], etc. Because these problems can also be considered as the search tasks.
GraLTR-LDA treats the lncRNA-disease association prediction as a graph-based search task, in which homogeneous graph and heterogeneous graph are constructed by integrating multi-source biological information.
GraLTR-LDA employs graph auto-encoder and multi-view attention mechanism to extract embedded features from the constructed graphs.
GraLTR-LDA is able to incorporate the embedded features into Learning to Rank framework via feature crossing statistical strategies to predict priority order of diseases associated with query lncRNAs.
Acknowledgments
We are very much indebted to the four anonymous reviewers, whose constructive comments are very helpful for strengthening the presentation of this paper.
Funding
This work was supported by the Beijing Natural Science Foundation (No. JQ19019) and National Natural Science Foundation of China (No. 62271049, U22A2039 and U21B2009).
Qi Liang is a master candidate at the School of Computer Science and Technology, Beijing Institute of Technology, Beijing, China. His expertise is in bioinformatics, nature language processing and machine learning.
Wenxiang Zhang is a doctoral candidate at the School of Computer Science and Technology, Beijing Institute of Technology, Beijing, China. His expertise is in bioinformatics, nature language processing and machine learning.
Hao Wu, PhD, is an experimentalist at the School of Computer Science and Technology, Beijing Institute of Technology, Beijing, China. His expertise is in bioinformatics, nature language processing and machine learning.
Bin Liu, PhD, is a professor at the School of Computer Science and Technology, Beijing Institute of Technology, Beijing, China. His expertise is in bioinformatics, nature language processing and machine learning.
