


Abstract
The cell type identification is among the most important tasks in single-cell RNA-sequencing (scRNA-seq) analysis. Many in silico methods have been developed and can be roughly categorized as either supervised or unsupervised. In this study, we investigated the performances of 8 supervised and 10 unsupervised cell type identification methods using 14 public scRNA-seq datasets of different tissues, sequencing protocols and species. We investigated the impacts of a number of factors, including total amount of cells, number of cell types, sequencing depth, batch effects, reference bias, cell population imbalance, unknown/novel cell type, and computational efficiency and scalability. Instead of merely comparing individual methods, we focused on factors’ impacts on the general category of supervised and unsupervised methods. We found that in most scenarios, the supervised methods outperformed the unsupervised methods, except for the identification of unknown cell types. This is particularly true when the supervised methods use a reference dataset with high informational sufficiency, low complexity and high similarity to the query dataset. However, such outperformance could be undermined by some undesired dataset properties investigated in this study, which lead to uninformative and biased reference datasets. In these scenarios, unsupervised methods could be comparable to supervised methods. Our study not only explained the cell typing methods’ behaviors under different experimental settings but also provided a general guideline for the choice of method according to the scientific goal and dataset properties. Finally, our evaluation workflow is implemented as a modularized R pipeline that allows future evaluation of new methods.
Availability: All the source codes are available at https://github.com/xsun28/scRNAIdent.
Introduction
The single-cell RNA-sequencing (scRNA-seq) technology [1] has provided unprecedented opportunities to study the transcriptome at individual cell level. The complexity of the scRNA-seq data also poses challenges for data analysis. Among them, the identification of cell types for each individual cell is one of the most important questions.
Conventionally, cell types can be identified with laborious and expensive techniques such as immunochemistry, fluorescence-activated cell sorting and morphological methods [2]. These technologies, however, cannot be applied in large-scale studies. Over the last several years, many in silico methods have been developed for identifying cell type from scRNA-seq [3], which can be roughly divided into two categories: supervised and unsupervised. The unsupervised methods are based on various clustering algorithms. They pool all data from unlabeled cells and cluster them into groups based on the similarities of the gene expression profiles. Subsequently, using known cell type marker gene lists, the cell type labels are assigned to each cluster by manual inspection of gene expression profile of a cluster or by computational tools such as an adapted version of CIBERSORT and METANEIGHBOR [4–6]. The supervised methods require a reference dataset with known cell type annotations. They train a classifying model on the reference data, and then apply the trained model to predict the cell types in an unannotated dataset [4, 7, 8].
These two categories of methods have their own strengths and weaknesses. The unsupervised methods do not require reference dataset and assign every single cell to a cluster. However, it is not easy to specify an appropriate number of clusters, even though some methods provide functionality to automatically search for the most likely value. Moreover, assigning cell type labels to resulting clusters is not a trivial task. Although some computational methods [4, 9] have been developed to facilitate cell cluster annotation in a fast and systematic way, this step inevitably introduces another layer of errors and biases, as it fundamentally relies on expert curated known marker gene lists. In addition, it is not easy for the unsupervised methods to utilize prior knowledge for cell type-specific gene expression. On the other hand, the supervised methods utilize prior knowledge from the reference data and directly report the cell types. However, the cell types that can be identified are restricted to the ones included in the reference data. It is not straightforward for the supervised methods to identify new cell types. Some supervised methods with rejection option can potentially classify new cell types as ‘unassigned’; however, the detailed identification of unassigned cells require further analyses. Moreover, sometimes it is also challenging to obtain a suitable reference dataset, especially for novel tissue types.
With the availability of these methods, it is important to thoroughly understand their pros and cons and the factors affecting their performances. This will not only provide information for end users in choosing a method for their analyses but also shed light for future method development. There have been several studies that systematically reviewed and compared the performances of these methods from different perspectives [2, 4, 7, 8, 10, 11]. These reviews primarily focus on one category (supervised or unsupervised) and evaluate at the individual method level aiming to identify the best single method in specified settings. In this study, we primarily compared the general performances of the supervised and unsupervised methods. What makes our study different from previous studies is that rather than focusing on single methods, we focused on the broad category and investigated the factors affecting the performances of the methods in each category. To be specific, we evaluated 18 popular cell type identification methods, 8 supervised and 10 unsupervised. We evaluated several experimental settings that are usually encountered by researchers in practice, including different amounts of cells, number of cell types, sequencing depth, bias of references, interdataset batch effects, novel/unknown cell types, computational efficiency and scalability. In particular, we assessed the impacts of these factors in training and testing data separately, which have not been investigated before. The evaluations were performed on 14 public datasets of various sizes, tissues, experimental conditions, sequencing protocols and species. In order to establish a fair comparison between methods of the two categories, we adopted the Adjusted Rand Index (ARI) and BCubed-F1 score [12] as our main evaluation metrics, which are specific for clustering evaluation. Our results provided valuable insights for researchers to understand the performances of these methods from a perspective that combines methods’ mechanism and dataset properties. Together with the workflow implemented as an automated multimodule R pipeline (Figure 1 and Supplementary Note 1), our work also provided a general guideline and tool for the choice of cell typing method categories based on experimental settings and dataset properties.
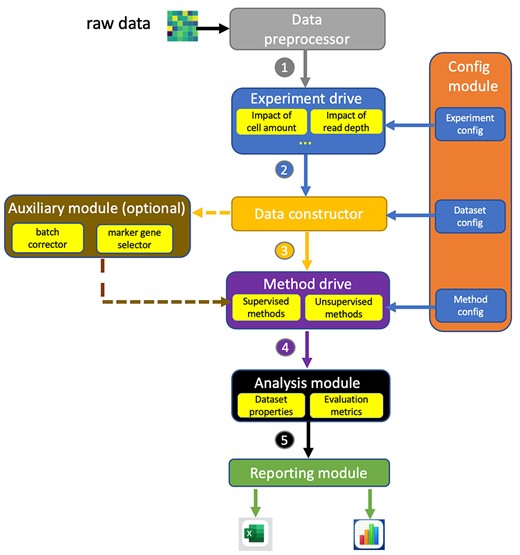
The workflow of scRNAIdent pipeline. It consists of seven core modules and one optional module. Core modules include configuration module, data preprocessor, experiment drive, experimental data constructor, method drive, analysis module and reporting module. The numbers in the figure represent the sequence of the workflow. The experiment drive module includes all experimental drives (e.g. impact of read depth) and executes the corresponding drive for the ongoing experiment specified in the experiment configuration. Data constructor module constructs specific training and testing datasets for the ongoing experiment based on the dataset configuration. Method drive modules includes all method drives and runs methods with parameters specified in the method configuration. The optional module is an auxiliary module lying between the data constructor and method drive, providing functionalities of removing batch effects and computationally selecting marker genes. Analysis module provides functions to calculate the training/testing dataset properties and evaluating metrics on the classification/clustering results.
Methods
Methods under evaluation
Eight supervised cell typing methods specifically developed for scRNA-seq data were selected for evaluation including CellAssign [13], Seurat v3 mapping [14], scmap-cluster [15], scmap-cell [15], singleR [16], CHETAH [17], Garnett [18] and SingleCellNet [19]. We also selected 10 unsupervised methods for cell clustering in scRNA-seq analysis, including Seurat v3 clustering [14], raceID3 [20], LIGER [21], SC3 [22], Monocle3 [23], TSCAN [24], pcaReduce [25] and CIDR [26], SAME-clustering [27] and SHARP [28]. The characteristics (e.g. rejection option) and methodologies (e.g. feature selection and dimension reduction) of these methods are summarized in Table S1 for supervised and Table S2 for unsupervised. We adopted the default settings or followed the software recommendations for setting method parameters except for the following places:
The prior selection of a marker gene list as input to CellAssign and Garnett (see Supplementary Note 2).
The specification or automated speculation of number of clusters for unsupervised methods (see Supplementary Note 3)
Except Seurat v3 mapping/clustering, LIGER and raceID3, batch effects are not explicitly addressed by all other methods. Therefore, we resorted to MNN [29] to explicitly remove batch effects for reasons described in Supplementary Note 4.
Datasets
We used a total of 14 datasets with different tissues, diseases, species and technologies for evaluation (Table S3). Six datasets (PBMC Zheng and five PBMC system lupus erythematosus (SLE) including PBMC SLE A-C, PBMC SLE Stim and PBMC SLE Ctrl) were from human PBMC. The PBMC Zheng [30] was collected from samples of healthy individuals and downloaded from https://support.10xgenomics.com/single-cell-gene-expression/datasets. The PBMC SLE datasets [31] were downloaded from https://www.ncbi.nlm.nih.gov/geo/query/acc.cgi?acc=GSE96583. The PBMC SLE A-C datasets were collected from the same eight patients of SLE disease and prepared in the same batch. PBMC SLE Stim and PBMC SLE Ctrl datasets were collected from another eight SLE patients, the cells of which were incubated with (Stim) or without (Ctrl) INF-beta stimulation prior to the sequencing. Three datasets were from human pancreas including Segerstolpe [32], Muraro [33] and Xin [34], which were acquired from https://hemberg-lab.github.io/scRNA.seq.datasets/. Alzheimer [35] and Autism [36] datasets were from brain tissue of Alzheimer and Autism patients, respectively, of which the former was downloaded from https://www.synapse.org/#!Synapse:syn18485175 and the latter was downloaded from the Sequence Read Archive with the accession number PRJNA434002. Two midbrain datasets [37] were collected from human and mouse tissues, respectively, and downloaded from GEO with accession number GSE76381. Finally, the Human Cellular Landscape dataset [38] that consists of ~600 k cells from diverse human tissues was downloaded from http://cells.ucsc.edu/?ds=human-cellular-landscape.
Data preprocessing
At first, we conducted a preliminary quality control on the raw datasets [39] to exclude cells with a total detected counts equal to zero or three median absolute deviations away from the median. Yet to preserve the integrity of the raw datasets, we excluded neither cell types of small populations nor atypical cell types, leaving further processing jobs to the experimental dataset construction step (Supplementary Note 5). We did not conduct gene-level filtering at this step either for the same reason.
Experimental design and dataset construction
Our study aims to design experiments resembling the cases encountered in the practical scRNA-seq analysis. In alignment with this aim, we did not use simulated datasets but sticking solely to real scRNA-seq datasets. Considering the complexity, diversity and noise of the real datasets we used in this study, the construction of experimental datasets was critically important and required careful design to associate the investigated factor to the constructed datasets while controlling for confounding factors. Briefly, we utilized 5-fold cross-validation in the intradataset evaluation for benchmarking all methods. We designed an experiment for each impact factor under investigation (Supplementary Note 5d–k), including the impact of amount of cells, impact of read depth, impact of batch effects, impact of biased reference, impact of number of cell types, impact of cell population imbalance, identification of novel/rare cell types, computational efficiency and scalability. Interdataset pairs were used in these experiments, and the supervised methods used one dataset as training and the other as testing; the unsupervised methods either ran on the same test dataset used by the supervised methods or ran on the combination of training and testing datasets and then analyzed only on the test dataset (e.g. for studying the batch effects). To assess the impact of an investigated factor in training and testing dataset separately, we conducted ‘fixed-training’ and ‘fixed-testing’ evaluations in each experiment. A ‘fixed training (testing)’ evaluation consisted of multiple rounds of tests, and the value of the investigated factor was altered only in the testing (training) dataset across rounds, whereas the training (testing) dataset was fixed. Note, in experiments using fixed-testing dataset, an unsupervised method had unchanged clustering results across rounds if it only ran on the testing dataset. The details of how to alter the investigated factor in each experiment and the construction of the experimental datasets for each experiment are elaborated in Supplementary Note 5.
Analytical metrics
We analyzed the performances of supervised and unsupervised methods based on two types of metrics. One type of metrics summarizes the properties of experimental dataset (e.g. dataset complexity and cell population imbalance), whereas the other type evaluates the classification/clustering results (e.g. ARI and BCubed F1 score). Their definitions and calculations, the justifications and places of using them are described in Supplementary Note 6 and listed in Tables S6 and S7.
Results
An overall comparison
To compare the baseline performances of supervised and unsupervised methods, we conducted intradataset tests on 13 datasets (Table S3). Stratified sampling without replacement was performed to obtain a sample of 1200 cells for each dataset. For supervised methods, we applied 5-fold cross-validation to train the classifier on 4 folds and tested on the one hold-out fold. Unsupervised methods performed clustering on the entire sampled test dataset. Predicted results were compared against true labels to calculate ARI scores. The overall distribution of ARI scores across the 13 datasets (Figure 2) suggests that supervised methods generally outperformed unsupervised methods. Further analysis reveals that this outperformance depends on two factors. The first factor is the discrepancy between the specified and true numbers of clusters. The larger the discrepancy, the more supervised methods outperformed unsupervised methods. This is illustrated in Figure S17 where true numbers of clusters were provided to six unsupervised methods that allow prespecifying the number of clusters as an input parameter. All six unsupervised methods showed improved performance but were still not as good as the supervised methods. The second factor is the dataset complexity (Table S6). As shown in Figure 3, the supervised methods significantly outperformed the unsupervised ones when the dataset complexity was low (left part of the figure). When the dataset complexity increases (right part of the figure), the points representing ARI scores of two types of methods overlap much more, suggesting a more comparable performance.
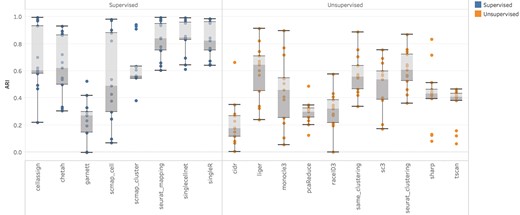
Overall comparison of supervised and unsupervised methods using 13 intradatasets. Each dot represents the ARI score of a method on a dataset.
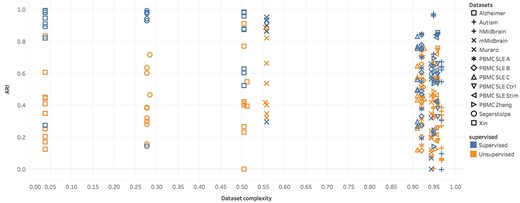
Performances of supervised and unsupervised methods versus dataset complexity using 13 intradatasets.
Impact of number of cells
The dataset size represents the amount of information that can be exploited for cell type annotation. Theoretically for any supervised model, the bias of the model estimates will reduce with larger training data, thus leading to better predictions. For unsupervised methods, it is not clear how the number of cells being clustered will impact the results. We performed two series of tests on nine dataset pairs (Table S4B). In each series, we gradually increased the number of cells in the testing or the training dataset.
In the first series of tests where the testing dataset varied in sizes (Figure S1a), supervised methods’ performances were mostly constant, whereas unsupervised methods’ performances showed great variations. A deeper look at the unsupervised results showed that the estimated number of clusters played an important role in these results. Specifically, if the cluster number was not prespecified, the unsupervised methods tended to infer a smaller number of clusters from a smaller dataset, whereas a larger number of clusters from larger dataset. As shown in the unsupervised part of Figure S1, the ARI scores generally followed the same trend as the discrepancy between the inferred and true number of clusters: smaller discrepancy led to better ARI. When the parameter of number of clusters was predefined as for CIDR and pcaReduce, the performances were relatively stable. Furthermore, we also evaluated the performance of the unsupervised methods when the true number of clusters was provided (Supplementary Note 3 and 7).
In the second series of experiments where the training dataset varies in sizes, we noticed that the unsupervised methods’ performances were comparable to supervised methods when training dataset size was small. Most supervised methods had improved performances with larger training dataset size, especially for datasets with larger complexity (Figure S1b). In some cases, the performance saturated when the training data size reach a certain level. The reason for the saturation was that data with certain complexity required a certain number of training cells to reach the potential near-maximum performance. After that, further increasing training size will not significantly improve the performance. The saturation point of the training size can depend on the degree of complexity and variability of the testing dataset. Briefly, a higher degree of complexity and variability of the testing dataset would require more training samples for sufficient learning, leading to a higher saturation point in training size.
Impact of read depth
In scRNA-Seq, because of the variation in experimental conditions such as the efficiencies of mRNA capture and reverse transcription, cells can have dramatically different sequencing depth. To assess the impact of sequencing read depth of test dataset on cell typing performances, we first fixed the training dataset and constructed five test datasets, each with different level of average sequencing depth (Supplementary Note 5e). Overall, the supervised methods outperformed unsupervised methods at all sequencing depth levels (Figure S2a). At the individual method level (Figure S3a), for test datasets of low overall read depth (e.g. Alzheimer, PBMC SLE datasets), all methods’ performances exhibited noticeable improvements with higher depth. In contrast, for test datasets of high read depth (e.g. Xin, Muraro), such improvements were not obvious. This is because data with higher depth contains more information for cell types. However, when the depth reaches a saturation point, further increasing in it would not help improving the performance. Next, we assessed the impact of read depth of the reference dataset. We fixed the test dataset and sampled five training datasets with different levels of read depth. These results (Figures S2b and S3b) were very similar to the results above: performances improved when training data have higher depth, but the improvement was saturated when reaching a certain depth level.
Overall, we conclude that deeper sequencing will help clustering and classification to a certain degree. An interesting question is how to determine the optimal sequencing depth. We believe that such number depends on many factors such as the ones we investigated in this work (data complexity, number of cells and cell types, etc.), so there will not be a global optimal number for all datasets. Nevertheless, to determine the optimal sequencing depth is an interesting question, we will explore in the near future.
Impact of batch effect
In interdata prediction, reference and target data are often from different batches, which is more challenging than the intradataset prediction because the heterogeneities across different datasets. Batch effects in scRNA-seq are well studied [29, 40, 41], and a handful of computational methods have been developed including MNN [29], ComBat-seq [42], iNMF [43], SMNN [44] and Harmony [45]. We evaluated the impact of computationally batch effect removal on eight pairs of datasets (Supplementary Note 5f). To establish a fair comparison with the unsupervised methods, unsupervised methods were tested on the combined training and testing datasets, but the ARI scores was calculated on testing dataset only. We applied MNN to remove batch effects. However, MNN produced negative values in the batch-corrected expressions, which were not allowed by eight methods in our study including CellAssign, scmap_cell, scmap_cluster, SingleCellNet, LIGER, raceID3, CIDR and SAME-clustering. As a result, we only consider the remaining 10 methods in this comparison.
As shown in Figure S4b, we observed that most supervised methods except CHETAH did not show performance improvement after correcting batch effects, which was also consistent with other studies [7, 8]. This makes sense because from a Bayesian point of view for a classification model, although the batch effects lower the likelihood for a query cell belonging to a cell type in the reference, its posterior probability would not be affected much as the batch effects also lower the likelihoods of it belonging to other cell types. However, if the supervised method includes a reject option, the batch effects could possibly increase the chance of labeling a cell as ‘unassigned’. For example, CHETAH was the only supervised method that showed significantly improved performances after batch correction, because of the dramatically reduced number of unassigned cells (shown as the numbers on top of the ARI bars for CHETAH in Figure S4b). The performances for unsupervised method also varied depending on their underlying clustering strategies (Figure S4b). Overall, only monocle3 showed improved performances after batch correction, whereas other methods became worse. These unsupervised methods were based on hierarchy clustering of reduced dimensional space. The variation in batch effects was usually captured in the top a few embedded directions, and the standard normalization of the directions and inclusion of many variational directions (eigenvector directions) essentially downweighed the variation from batch effects in the subsequent hierarchy clustering. In contrast, when only a few top variational directions were used in the clustering such as 3-dimensional Uniform Manifold Approximation and Projection (UMAP) (adopted by Monocle3), the variation from batch effects usually dominated, leading to incorrect grouping along this direction. Hence Monocle3 showed improved performance after batch correction. Moreover, computational batch effects removal could filter out relevant variations of biological differences, thus undermined the performances of many methods.
Impact of biased reference data
In practice, reference bias is usually inevitable as it is difficult to identify a perfect reference dataset that is analogs to the query dataset in all aspects for training supervised methods. Yet unsupervised methods by nature are free of such bias. In this experiment, we studied supervised methods’ performances under various types of reference bias and compared them with unsupervised methods’ performances. More specifically, reference bias can be introduced when using reference and query datasets from different individuals, conditions, batches or species. For example, patients could have significantly different gene expression from health individuals even for the same cell type. We classified reference biases into three types: (i) individual level bias that corresponds to bias only related to individual variation, (ii) condition level bias that corresponds to bias only related to different health conditions or cell cultural conditions and (iii) batch level bias that corresponding to bias related to batch effects. In addition, the three types can be combined leading to reference biases at multiple levels. We used three PBMC SLE datasets, including PBMC SLE B, PBMC SLE Stim and PBMC SLE Ctrl [31] in four experiments to evaluate the impact of reference bias from different levels. In the first experiment, we assessed the individual level bias by using training and testing datasets from two different individuals in the same dataset. In the second experiment, we assessed the condition level bias by using training dataset from either PBMC SLE Stim or PBMC SLE Ctrl datasets and testing dataset from the same individual in the other dataset. In the third experiment, we assessed the combined individual and batch level bias by using training dataset from PBMC SLE B and testing dataset from PBMC SLE Ctrl. In the last one, we assessed the combined individual, cell cultural condition and batch level bias by using training dataset from PBMC SLE B and testing dataset from PBMC SLE Stim. These settings are summarized in Table S4a. For all experiments, unsupervised methods were tested only on the testing dataset, which was not changed across reference bias levels. Consequently, the unsupervised methods’ results remained unchanged for that testing dataset, and thus we only show one result in both figures of Figure 4.
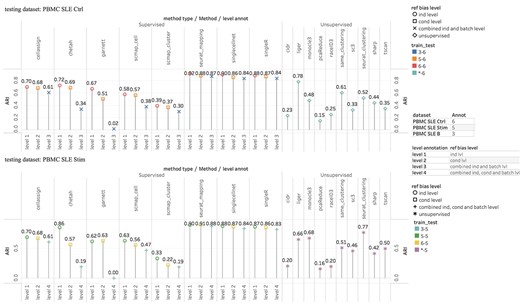
Evaluation of impact of reference bias: Upper figure was using PBMC SLE Ctrl as testing dataset. Lower figure was using PBMC SLE Stim as testing dataset. The four levels of reference bias are—level 1: individual bias; level 2: experimental condition bias; level 3: combined individual and batch bias and level 4: combined individual, experimental condition and batch bias. There is no level for unsupervised methods.
In general, the supervised methods became worse with higher levels of reference biases. For example, supervised methods had best performances at the individual level, of reference bias (marked as red circles in upper figure of Figure 4), and worst performances at the combined individual and batch level (marked as blue crosses in upper figure of Figure 4). In addition, most supervised methods had better performances with the individual level than the condition level reference biases (marked as square in both figures of Figure 4), suggesting the reference bias introduced by experimental conditions was larger than that from individuals. Note that Seurat v3 mapping and singleR had the least performance changes among different reference bias levels, consistent with the observation that these two methods are more robust to batch effects shown in the study of batch effects above. Overall, the supervised methods still outperformed the unsupervised ones at all levels of reference bias, but the outperformance shrunk as greater reference biases were introduced. This was confirmed in an additional evaluation (Figure S21) where we used the mouse/human midbrain dataset as the reference/query dataset to introduce a much greater cross-species reference bias. These results suggest that the choice of reference data is important to the performance of the supervised method. How to properly select reference data is certainly an interesting problem we will explore in the near future.
Impact of number of cell types
Dataset complexity largely depends on the number of cell types, and more cell types can render the cell type identification more challenging. To investigate the impact of the number of cell types of either reference or query dataset, we designed a series of tests using seven pairs of datasets (Table S4b), in which additional cell types were incrementally added to the training dataset (fixed test) or the test dataset (fixed training).
When using fixed-testing datasets, we observed that the supervised methods exhibited either relatively constant or declining BCubed F1 scores with more cell types in the training dataset (Figure S5a). We observed that, as the number of training cell types increased, there was an increasing percentage of testing cells that were incorrectly labeled as cell types only in training data particularly when the dataset included a relatively large number of cell types (e.g. the mouse/human midbrain datasets). This percentage was named as extra-type-percentage as in Table S7. Among all supervised methods, Seurat v3-mapping, SingleCellNet and singleR had a slower increasing in the extra-type-percentage than the others. All methods’ performances were observed to be negatively correlated with the extra-type-percentage.
In fixed-training tests, the number of cell types in the testing dataset was incrementally increased. As shown in Figure S6a, for unsupervised methods, smaller discrepancy between the true and inferred number of clusters (|$\mid{n}_{\mathrm{inferred}}-{n}_{\mathrm{true}}\mid$|) and fewer number of testing cell types led to better BCubed F1 scores. More precisely, the performance was better when the ratio of cluster number discrepancy to the number of cell types |$\Big(\frac{|{n}_{\mathrm{inferred}}-{n}_{\mathrm{true}}|}{n_{\mathrm{cell}\_\mathrm{type}}}\Big)$| was small (e.g. the mouse/human midbrain dataset pair) and vice versa. Indeed, given the true number of clusters (Supplementary Note 7 and Figure S19), performances of six unsupervised methods were negative correlated with the number of cell types. For supervised methods, the increased number of testing cell types reduced their performances when data had high complexities (e.g. PBMC SLE Ctrl and PBMC SLE B) but not so when data had low complexities (e.g. Segerstolpe and Muraro). This can be explained as when the gene expression profiles of cell types were of high similarity (high complexity), increasing the number of cell types enlarged the chances of misclassifying cells of different types but similar gene expressions profiles.
On the overall level as shown in Figures S5b and S6b, the supervised methods generally outperformed the unsupervised, especially when the dataset pairs were of smaller complexity and fewer cell types. However, this outperformance declined as training/testing cell types increased in datasets of large complexity. The advantage of supervised message may even disappear in the presence of very large reference biases such as using the cross-species prediction with the mouse/human midbrain datasets.
Impact of cell population imbalance
Cell type proportions in a complex tissue can be very imbalanced. In many cases, the rare cell types are the ones of interest. For an extremely unbalanced dataset, a method can achieve high accuracy but fail to identify rare cell types. Additionally, when researchers randomly sample a small portion of a large pool of cells, the created dataset can be very imbalanced and have a very different cell type proportion from the true one. Here, we evaluate the performances of the methods when the cell type proportions are very imbalanced. In fixed-training experiments methods were tested on datasets of increasing cell population imbalance measured as entropy of the cell type composition (Table S6). In the fixed-testing experiments, the cell population imbalance was altered only on the training dataset. A total of seven interdataset pairs were used (Table S4b).
In each fixed-training experiment, four (or five) testing datasets were sampled from the query dataset with four (or five) cell types in proportions according to the target entropy (Table S5). For the unsupervised methods (Figure S7a), cell population imbalance along with the cluster number difference between the true and inferred number of clusters (|${n}_{\mathrm{inferred}}-{n}_{\mathrm{true}}$|) affected methods’ performances from three aspects: (i) a difference closer to 0 led to better performance; (ii) If the method always overestimated the number of clusters (e.g. pcaReduce with difference > = 3), better performances were achieved on more balanced testing dataset; and (iii) If the method always underestimated the number of clusters (e.g. Monocle3 with difference ≤−2), better performances were achieved on more imbalanced testing dataset. We also investigated six unsupervised methods’ performances given the correct number of clusters (Supplementary Note 7 and Figure S20). Furthermore, we expected |${n}_{\mathrm{inferred}}$|would increase as the dataset became more heterogeneous (more balanced), which in turn generated a larger cluster number difference. However, except Monocle3, pcaReduce and CIDR, most methods exhibited irregular changes in the cluster number difference, suggesting the insufficiency of most unsupervised methods on inferring the true number of clusters. For supervised methods, we evaluated their performances using macro F1 score (Table S7) as shown in Figure S7a. Their performances were relatively stable and slightly affected by the distributional discrepancy between the cell type proportions of the training and testing datasets, which was quantified as Kullback–Leibler divergence (Table S6). When the KL-divergence was small, training and testing data had similar cell type proportions, contributing to overall better performance.
In the fixed-testing experiments, four (or five) training datasets of different cell type proportions were constructed in the same way as in the fixed-training experiments above. Supervised methods’ performances improved as the training dataset became more balanced (large entropy) as they had more chances of learning rare cell types in the testing dataset (Figure S7b).
In conclusion, the supervised methods were more robust to the imbalanced testing dataset than the unsupervised methods, especially when the training dataset included enough cells of rare testing cell types. Therefore, supervised methods should be a better choice in case of identification of rare cell types is important and there is considerable uncertainty about the severity of dataset imbalance.
Ability to identify novel/unknown cell types
Novel cell type identification is another important question. Supervised methods per se cannot identify cell types that are not included in the training data. However, some supervised methods, including Garnett, scmap-cell, scmap-cluster, Chetah, CellAssign, SingleCellNet, provide an option to label a cell as ‘unassigned’ if it is not similar to any reference cell type. Unsupervised methods, on the other hand, are not limited by the scope of the reference data and potentially can isolate novel cell types in separate clusters. Here, we evaluated the methods’ ability to isolate novel/unknown cell types from the known cell types.
We used F1 score to quantify the isolation ability of supervised methods to label an unknown cell as ‘unassigned’. F1 score could not be directly calculated with unsupervised methods as they did not annotate the clusters, so we first need to identify the cluster that most probably represented the unknown type. To achieve this, we first computed the F0.5 scores of the unknown cell type for each cluster and picked the one with the maximum F0.5 score. Then for this identified cluster, we calculated the F1 score of the unknown type in the identified cluster, which was used in the comparison with the supervised methods. In our experiments, we fixed the testing dataset and removed one cell type in the training to represent the unknown cell type. We repeated this process four times for each pair of training and testing datasets. On the aggregated level (Figure S8), unsupervised methods showed much better isolation ability (higher F1 scores) than the supervised methods, particularly for testing dataset of high complexity (The right part of Figure S8) or training dataset of large reference bias (e.g. the mouse/human midbrain dataset pair). This makes sense because unsupervised methods are not limited by the known cell types in the training dataset. Note, the isolation of unknown cell types and the correct annotation of known cell types are essentially a tradeoff between type I and type II errors i.e. a method that is more sensitive to unknown cell types tends to make more misclassifications on known cell types.
To conclude, in scenarios that the importance of identifying unknown cell types overweigh the importance of correctly designating cells of known types, it might be better off resorting to unsupervised methods.
Computational efficiency and scalability
As running time is a crucial factor on selecting the cell type identification method in face of an ultra-large dataset consisting of millions of cells, we evaluated and compared the speed and scalability of the methods under investigation. Considering the large variance of the running time, we split the methods into categories of fast-, medium- and slow-speed (Table S1 and S2). The methods of the three categories were run against a different range of cell numbers so that each method could finish within a reasonable time (Supplementary Note 5k).
As shown in Figure S9, among the 11 fast-speed methods, eight methods (LIGER, Seurat v3 mapping/clustering, CHETAH, SHARP, Monocle3, TSCAN and scmap-cluster) showed both good speed and scalability to increasing number of cells and were able to label/cluster 50 000 cells within 600 s. Seurat clustering was the fastest on handling datasets of no larger than 30 000 cells, whereas SHARP was the fastest on handling datasets of no less than 40 000 cells. Owing to the fast blocking principal pivoting algorithm [46] leveraged in the optimization process, LIGER showed best scalability as its running time almost did not increase with the increase of cell numbers. Among the six medium-speed methods, SC3 showed the best scalability on handling datasets of medium size (4000–10 000 cells) as it adopted parallel computing and resorted to a faster SVM-based algorithm on handling datasets with more than 5000 cells. SAME-clustering was the slowest and showed the worst scalability among all investigated methods because of its underlying ensemble algorithm and EM-based inference. Finally, the unsupervised methods generally outperformed the supervised methods in terms of speed and scalability (Figure 5).
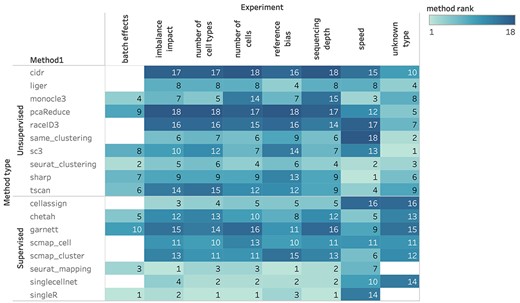
Overall ranking of methods.
Experiments on -large dataset
Considering the explosive growing size of scRNA-seq datasets, we evaluated seven fastest and memory-economic methods in five experiments using the Human Cellular Landscape dataset [38], which includes ~600 000 cells of 63 types from diverse human tissues (Table S3). The details of the experimental designs are elaborated in Supplementary Note 5l and Table S10.
Briefly, the results on ultra-large dataset were consistent with those of experiments on smaller scale datasets (Figure S22a–e). We enumerate some additional observations in each experiment below:
Seurat v3 mapping had the best performance among all methods and Monocle3 was the best unsupervised method (Figure S22a).
All unsupervised methods tended to underestimate the number of clusters particularly when there were relatively fewer cells. Monocle3 had the best estimation of the true number of clusters. The performances of supervised methods saturated and barely improved with more than 60 000 training cells (Figure S22b).
Using the default settings, the unsupervised methods except Monocle3 showed significantly increased absolute discrepancy between estimated and true number of clusters (Figure S22d) as the number of testing cell types increased from 21 to 63.
As shown in the left part of Figure S22e, the unsupervised methods except TSCAN always overestimated the number of clusters when testing dataset included a large number of cells and a relatively small number of cell types (five types in this experiment). As a result, their performance improved as the testing cell population became more balanced. The supervised methods’ performances were relatively stable for both fixed training and testing evaluations, suggesting that given an enough number of training cells, supervised methods were able to learn sufficient information to overcome the problem of imbalanced cell population.
Discussions and conclusions
In this study, we compared the performances of eight supervised and eight unsupervised methods for cell clustering and classification for scRNA-seq on 11 public scRNA-seq datasets with different origins and sequencing technologies. We performed extensive data analyses to investigate the impacts of eight experimental factors representing heterogeneities, inconsistencies and noises from both technical and biological aspects. The factors were introduced by meticulously selecting reference and query dataset pairs and manipulating the constructions of training and testing datasets. Unlike existing benchmark papers that only compared the performances of individual methods of either supervised or unsupervised type, we focused on the evaluation of the impacts of these factors on supervised and unsupervised methods at both broad type and individual method levels.
Confounding factors and diversity in methods’ underlying mechanisms were the two primary challenges in our study, which obfuscated our searching for patterns and regularities of methods’ behaviors. We addressed the two challenges by two means: the separation of the analysis into aggregated and individual method levels and controlling for confounding factors. The reason for the first mean was that the methods of the same type share some basic mechanisms. Although performances from individual methods varied among datasets, the aggregated performances at the supervised/unsupervised level can better reveal the impacts of the investigated factors and offer a more straightforward comparison. For the second means, we designed the experiments so that only the factor under investigation were changed, whereas all other factors are kept constant, so that we could isolate and primarily assess the impact of the factor of interest. For example, to control the confounding of the origin (training or testing data) of a factor, we performed two series of tests in each experiment: the factor was altered only in the training dataset (so-called fixed test) or only in the testing dataset (so-called fixed train).
We generated extensive results, summarized in Tables S8 and S9. Here, we provide a brief summary of our conclusion. Our results indicated that in general, supervised methods were better except in unknown cell type identification and computational efficiency, but the improvement over unsupervised ones were smaller in data with higher complexity and even reversed in data with large reference bias. For supervised methods, following factors led to better prediction results: more training cells, smaller number of cell types, deeper sequencing, more similar cell type proportions between training and testing data, more balanced training cell type proportions and less biased reference. For unsupervised methods, following factors led to better prediction results: deeper sequencing, smaller number of cell types and less discrepancy between true and estimated cluster numbers. We found that computational batch effect removal was not necessary in both supervised and unsupervised methods. In fact, the batch effect removal could lead to worse results in some cases. Data complexity played a huge role in all scenarios. Stronger similarity among cell types (often happens in sub cell type classification) led to higher complexity, which required larger training data and deeper sequencing to achieve satisfactory results. Importantly, these conclusions can be generalized to ultra-large datasets with more than 100 000 cells from a variety of cell types. Furthermore, for each experiment, we ranked the 18 methods on their mean performance rank over all tests, which are displayed in Figure 5 and summarized in Table S9. Among the supervised methods, Seurat v3 mapping and SingleR had the best overall accuracy across experiments other than unknown/novel cell type identification in which scmap-cell was the best supervised method. Although SingleR had very close or even better performances than Seurat v3 mapping, the latter is much faster than the former. Therefore, in face of large datasets (>10 000 cells), Seurat v3 mapping generally is a better choice. Among the unsupervised methods, Seurat v3 clustering had the best overall performance and excellent speed, making it the first choice of unsupervised methods. In addition, unsupervised methods were generally faster than supervised methods. Particularly, SHARP had the best computational efficiency and scalability, and a decent clustering performance. Hence, we recommend using SHARP to handle ultra-large datasets (>500 000 cells). The detailed rankings of methods for each experimental setup are shown in Figures S10–S16.
To conclude, our study provides the comparisons of the supervised and unsupervised methods under the influences of multiple factors along with detailed analyses and explanations on their behaviors from perspectives of both dataset properties and methods’ underlying mechanisms. Furthermore, the workflow of our study has been implements as a R pipeline consisting of independent modules including data preprocessing, training/testing dataset construction, experimental configuration, classification and clustering, dataset properties computation and results analysis, and analytical figure plotting. The pipeline is freely available at https://github.com/xsun28/scRNAIdent. This pipeline allows flexible modifications including changing experimental parameters, adding experiments of new impact factors, new cell typing methods and new analytical statistics. Our study not only serves as a guideline for selecting cell typing methods but also offers insights and a tool to the development of new models and algorithms of scRNA-seq cell typing.
Supervised methods in general perform better than unsupervised methods under different impacting factors including number of cells, sequencing depth, batch effects, number of cell types, reference bias, and imbalance on cell populations. The overall best performing supervised and unsupervised methods are Seurat v3 mapping/singleR and Seurat v3 clustering.
Unsupervised methods are better at identifying unknown/novel cell types and generally have better computational efficiency than supervised methods. SC3 is the overall best performing method for the identification of unknown/novel cells, and SHARP is the method of best computational efficiency and scalability.
The outperformance of supervised methods to unsupervised methods can decrease or reverse as the dataset complexity and reference bias increase.
Supervised methods’ performances are more likely to improve with more training cells, smaller number of cell types, deeper sequencing, more similar cell type proportions between training and testing data, more balanced training cell type proportions and less biased reference. Unsupervised methods’ performances are more likely to improve with deeper sequencing, smaller number of cell types and more accurate estimation of cluster numbers.
Computational removal of batch effects does not improve most investigated supervised methods’ performances and worsens the performances of most investigated unsupervised methods.
Availability of software
We implemented our analysis workflow as a R pipeline available at https://github.com/xsun28/scRNAIdent to provide an automated, modularized, flexible and extensible framework for evaluating new scRNA-seq cell type identification methods and adding other evaluation criteria in the future. The software was developed with a MIT license.
Availability of data sets
Please refer to the Datasets in the Methods section and Table S3 for the availability of the datasets used in this study.
Author contributions
H.W. conceived the idea. X.S. analyzed the real data and developed the pipeline, with inputs from Z.L. and X.L. X.S. and H.W. wrote the manuscript. All authors have read and approved the manuscript.
Funding
This work was supported by multiple funding. X.S. was supported by the National Natural Science Foundation of China (Grant No. 61773401). H.W. and Z.L. were partially supported by the National Institutes of Health (R01GM122083).
Xiaobo Sun is an Associate Professor at the Department of Statistics, School of Statistics and Mathematics, Zhongnan University of Economics and Law, Wuhan, Hubei, China. His research interests include statistical and machine learning on bioinformatics.
Xiaochu Lin was a graduate student at Emory University. Her research interest is in the application of single-cell RNA-sequencing.
Ziyi Li is an Assistant Professor at the Department of Biostatistics, The University of Texas MD Anderson Cancer Center, Houston, TX, USA. Her research interests include developing statistical methods for analyzing high-throughput data, biomarker identification and data integration.
Hao Wu is an Associate Professor at the Department of Biostatistics and Bioinformatics, Rollins School of Public Health, Emory University, Atlanta, GA, USA. His main research interest is to develop statistical methods and computational tools for analyzing large-scale biomedical data, in particular different types of high-throughput omics data.
