


Abstract
Identifying driver genes, exactly from massive genes with mutations, promotes accurate diagnosis and treatment of cancer. In recent years, a lot of works about uncovering driver genes based on integration of mutation data and gene interaction networks is gaining more attention. However, it is in suspense if it is more effective for prioritizing driver genes when integrating various types of mutation information (frequency and functional impact) and gene networks. Hence, we build a two-stage-vote ensemble framework based on somatic mutations and mutual interactions. Specifically, we first represent and combine various kinds of mutation information, which are propagated through networks by an improved iterative framework. The first vote is conducted on iteration results by voting methods, and the second vote is performed to get ensemble results of the first poll for the final driver gene list. Compared with four excellent previous approaches, our method has better performance in identifying driver genes on |$33$| types of cancer from The Cancer Genome Atlas. Meanwhile, we also conduct a comparative analysis about two kinds of mutation information, five gene interaction networks and four voting strategies. Our framework offers a new view for data integration and promotes more latent cancer genes to be admitted.
1 Introduction
Cancer is the second most frequent cause of death worldwide, killing more than |$8$| million people every year; the incidence of cancer is expected to increase by more than |$50$|% over the coming decades [1, 2]. On average, cancer genomes only contain |$4$|–|$5$| driver mutations, which play an important role in development of cancer, when combining coding and non-coding genomic elements [3]. One of the fundamental studies in the analysis and interpretation of cancer genomic data is to distinguish genes with driver mutations, i.e. driver genes. In terms of practical view, the discovery of driver genes is crucial for the prevention, diagnosis and clinical treatment of cancer. As far as the theory is concerned, finding these key driver genes can help us understand the mechanism of tumorigenesis and distinguish cancer subtypes better.
Over the past decade, researchers have come up with many models to identify driver genes based on some typical data. Thereinto, somatic mutation is so productive that it is almost an essential type of data for prioritizing driver genes [4]. Thanks to many publicly available databases, such as The Cancer Genome Atlas (TCGA) [5], somatic mutation data is easily accessed. Researchers have taken advantages of recurrence, functional impact (FI) and other information by mining mutation data for identifying driver genes. MutSigCV [6], based on recurrence information, takes three aspects of heterogeneity (samples, genes and mutation types) and assumes that background mutation rate of each tumor type is not consistent. OncodriveFML [7] applies Combined Annotation Dependent Depletion (CADD) and RNAsnp [8] to determine the magnitude of the impact of all mutations that occur in genomic elements. It regards genes with functional mutation (FM) bias as drivers.
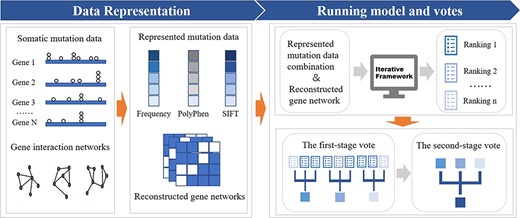
Overview of our method. First, we collect mutation data of |$33$| kinds of cancer from TCGA and 5 gene interaction networks from previous papers. Next, we represent mutation data in feature scores (Frequency, PolyPhen, SIFT) and reconstruct gene networks in undirected graphs. Then, represented mutation data combinations and reconstructed gene networks are regarded as inputs of an iterative framework to get multiple rankings. Finally, a two-stage vote is applied to rankings above for the final ranked gene list.
In recent years, it is preferable to combine multiple kinds of information to find driver genes, especially mutation data incorporated with gene interaction networks. Mutual interactions between genes are popular due to the power to elucidate molecular mechanisms of cancer development at the network level [9, 10, 11, 12]. There are computational methods that benefit from simultaneous analysis of mutation and gene network data [13, 14, 15, 16]. DriverNet [17], OncoIMPACT [18] and SCS [19] use greedy optimization approaches on manually curated subnetworks to prioritize the minimal set of driver genes. For example, SCS ensembles somatic mutations and expression data with a reference molecular network to obtain driver mutation profiles in a personalized-sample manner. DawnRank [20] and MECoRank [21] adopt random walk algorithms to diffuse impact on the perturbation of downstream genes. Specifically, DawnRank ranks mutated genes in a single patient referring to PageRank [22] and implements ranking aggregation in a population by Condorcet voting [23]. DriverML [24] and MoProEmbeddings [25], two machine-learning algorithms, leverage the knowledge of well-established cancer driver genes to enable supervised prediction.
As mentioned above, various kinds of information are provided by mining mutation data. But it is open to discussion if it is more effective for prioritizing driver genes when integrating various types of mutation information based on gene interaction networks. Hence, a two-stage-vote ensemble framework is designed to incorporate results after propagating mutation information through networks by an improved iterative framework referring to PageRank [22], Hyperlink-Induced Topic Search (HITS) [26] and their variants. In this work, useful information from both mutation data and gene interaction networks are extracted at first. Mutation frequency and FI of top |$N$| significantly mutated genes are measured by feature vectors based on somatic mutation data of |$33$| types of cancer from TCGA. Undirected graphs are obtained by reconstruction of five gene interactions networks. Next, unlike PageRank and HITS, there are some modifications in our algorithm. Specifically, symmetric undirected graphs and initialized mutation feature vectors mentioned above are inputs to the iterative framework. In order to achieve better ensemble effect, four brilliant voting strategies (Borda voting, Geometric mean, HPA [27] and SetExpan [28]) are used to integrate results at last. A comprehensive evaluation of our method is executed using multiple benchmark measures against well-known driver datasets, such as Cancer Gene Census (CGC) [29], Network of Cancer Genes (NCG) [30] and Integrative Onco Genomics (IntOGen) [31].
2 Method
In this work, we build a two-stage-vote ensemble framework propagating varied types of mutation information in networks to identify more known cancer genes and the overview of our method is in Figure 1.
2.1 Mutation data representation
We get access to mutation data of |$33$| kinds of cancer from TCGA. Somatic mutations are composed of two types: (i) single-nucleotide variants (SNVs) and (ii) Insertions and Deletions (InDels). In the cancer context, diffusing a signal from genes that are somatically mutated across tumors is highly effective for identifying cancer-relevant genes and pathways [32, 33]. In contrast to frequency-based approaches, network propagation methods can even pinpoint rarely mutated driver genes if they are within subnetworks whose component genes, when considered together, are frequently mutated [34]. In addition, the FI of somatic mutations in the coding regions of genes is fairly straightforward to predict, much less is known about the effect of mutations on non-coding regions of the genome; only |$1$|% of somatic mutations detected in PCAWG WGS data are exonic [35].
2.1.1 Mutation recurrence
To sum up, we choose top |$N$| significantly mutated coding genes as the dataset for each kind of cancer. Specifically, mutation frequency for every gene across samples is equal to the proportion of mutations that occur in this gene to the total in corresponding MAF file, and the experimental dataset only includes top |$N$| of most predominately mutated coding genes. And frequency score vector is just composed of mutation recurrences of these |$N$| genes.
2.1.2 Functional impact
As a different signal of positive selection, FM bias is useful to uncover driver genes, including lowly recurrent driver genes, and gene modules [36]. So, we compute two kinds of FI scores according to related entries SIFT [37, 38] and PolyPhen [39], two well-known tools that assess FI of mutations, in each MAF file for selected top |$N$| genes. Specifically, we take the average of SIFT and PolyPhen scores of all alterations each gene bears across samples, respectively. Note that we follow the principles of Oncodrive-FM [36] that FM bias can only be computed for genes that have mutations in at least two samples.
The lowest SIFT and highest PPH2 scores (|$0$| and |$1$|, respectively) represent the most deleterious mutations. We attribute the highest values to alterations without scores. Particularly, we transfer SIFT scores into |$1$|-SIFT for the sake of easier calculation later.
2.2 Gene interaction network reconstruction
In this paper, there are five gene interaction networks being adopted: the network from Dawnrank (Dawnrank), HINT+HI2012, iRefIndex [40], MultiNet [41] and the network constructed by Wu et al. [42]. Dawnrank uses a variety of sources, including the network used in MEMo [43] as well as the up-to-date curated information from Reactome [44], the NCI-Nature Curated PID [45] and KEGG [46] to build the interaction network [20]. HINT+HI2012 is a combination of HINT network [47] and the HI-2012 [48] set of protein–protein interactions [33]. IRefIndex is obtained by parsing protein interaction records from interaction databases including BIND [49, 50], BioGrid [51] and IntAct [52, 53], etc. MultiNet integrates the diverse modes of gene interactions (regulatory, genetic, phosphorylation, signaling, metabolic and physical protein–protein interactions) to create a unified biological network. Wu’s network, covering nearly |$50$|% of the human proteome, integrates information from known pathways as well as interactions derived from computational predictions [18].
One of input data is a symmetric |$N$|-by-|$N$| binary mutation matrix. For five reference gene interaction networks applied in this paper, we deal with them in the same way. Consider a reference network |$G=(V,E)$|, where |$V$| and |$E$| represent genes and their interactions, respectively. The corresponding genes of |$V$| are selected to be identical with the mutated genes in the experimental dataset of each kind of cancer (which limits the sizes of |$G$|). Then an undirected graph |$W=(V^{\prime},E^{\prime})$| is obtained where each vertex represents a gene, and there is an edge between two vertices if an interaction has been found between the corresponding genes in the reference network |$G$|. Specifically, if there is an interaction connecting gene |$i$| and gene |$j$| in |$G$|, |$W_{i,j}=1$|; otherwise, |$W_{i,j}=0$|. And we assume that |$W_{i,i}=1$|.
2.3 Iterative framework
PageRank and HITS have been proposed to rank vertices based on the graph structure. Specifically, these two algorithms are used to measure the importance of website pages and to rank web pages in their search engine results. PageRank estimates the importance score of vertices as the stationary distribution of a random walk process—starting from a vertex, the surfer randomly jumps to a neighbor according to the edge weight [54]. HITS algorithm is similar to PageRank in some aspects. This method assumes each vertex has two roles: hub and authority [26]. If a vertex is linked by many vertices with hub score, this vertex has high authority and vice versa [54].
While initial network approaches to identify disease genes focused on propagating knowledge from a set of known ‘gold standard’ disease genes, with the widespread availability of cancer sequencing data and genome-wide association studies, the source of where information is propagated from has shifted to genes that are newly identified as perhaps playing a role in disease [34]. In our model, we assume that coding genes with higher mutation frequency are the source of information and their information is able to be represented through diverse feature scores.
Here, we combine Frequency, PolyPhen and SIFT scores in pair, which generates three feature combinations, i.e. Frequency_PolyPhen, Frequency_SIFT and PolyPhen_SIFT. Two elements in a combination are regarded as |$A_{0}$| and |$H_{0}$|, respectively. Undirected graph |$M$| is provided by reconstructed DawnRank, HINT+HI2012, iRefIndex, MultiNet and Wu’s network. In a word, there are |$15$| diverse inputs produced by three feature combinations and five undirected graphs and updated |$A_{k}$| and |$H_{k}$| are two outputs for each input.
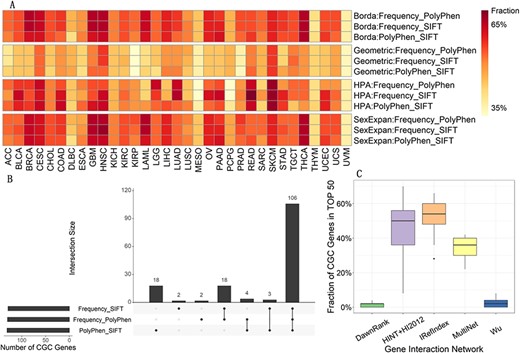
Analysis on the first vote. (A) Fraction of CGC genes in top |$50$| of 3 feature combinations when applying different voting strategies. Each column corresponds to one kind of cancer and each row represents one feature combination applying one voting strategy, i.e. voting method: feature combination. ‘Fraction’ in the legend refers to the percentage of CGC genes in top 50. Note that Geometric represents the voting method Geometric mean. (B) Overlap of CGC gene sets predicted by 3 feature combinations in the voting method HPA. Each bar on the bottom left represents the number of all CGC genes in top |$50$| of |$33$| kinds of cancer predicted by each feature combination. Each panel on the right displays the intersection size of predicted CGC genes sets. (C) Fraction of CGC genes in top |$50$| of 5 gene interaction networks in the voting method Geometric mean. Each panel includes results of all |$33$| types of cancer and represents one gene interaction network.
2.4 Voting strategy
In this paper, four voting strategies—Borda voting, Geometric mean, HPA and SetExpan—are carried out in order to determine whether voting strategies affect the drivers’ search, and if so, which one performs well.
Borda voting ranks candidates according to preference and regards the candidate with the most high rankings as the winner by giving each candidate a certain number of rankings. Geometric mean is conducted by multiplying the numbers altogether and taking the nth root of the multiplied numbers. Here these numbers are rankings of a candidate. HPA selects the top |$k$| ones that are nearest to th average value of all rankings, and weights them via the similarities between them and the average ranking. The final selection is equal to the weighted sum of the top |$k$| rankings. SetExpan collects |$T$| pre-ranked lists and scores each entity based on its mean reciprocal rank in all |$T$| rankings.
Here, we build a two-stage voting pipeline. First, we integrate corresponding iteration outcomes for Frequency_PolyPhen, Frequency_SIFT and PolyPhen_SIFT by the first vote, respectively, and produce three integrated ranked gene lists to study which feature combination is effective. Then, we get the ensemble of these three rankings by the second vote in order to get the final selection and detect novel driver genes.
3 Results
In this paper, comprehensive evaluation of our method is performed on mutation data of all |$33$| types of cancer from TCGA using multiple benchmark measures. First, we compare results after the first vote of different feature combinations, i.e. Frequency and PolyPhen, Frequency and SIFT, PolyPhen and SIFT. Then, we analyze the final ranking produced by the second vote from overlap of first vote, gold benchmark driver sets, voting strategies and other algorithms, four various perspectives. In addition, we summarize the novel predicted driver gene list and delve into several of these genes.
3.1 Analysis on mutation information
As mentioned in above section, we quantify mutation information by three kinds of feature scores, Frequency, PolyPhen and SIFT, for each gene in every cancer. Next, the scores are combined in pair: Frequency_PolyPhen, Frequency_SIFT and PolyPhen_SIFT, each of which and each of five reconstructed networks serve as inputs to the model together. Subsequently, four voting strategies, i.e. Borda voting, Geometric mean, HPA and SetExpan, are applied to integrate outputs of each feature combination cooperated with five networks. The fraction of CGC genes in top |$50$| contributes to reveal which combination is more effective for identifying driver genes.
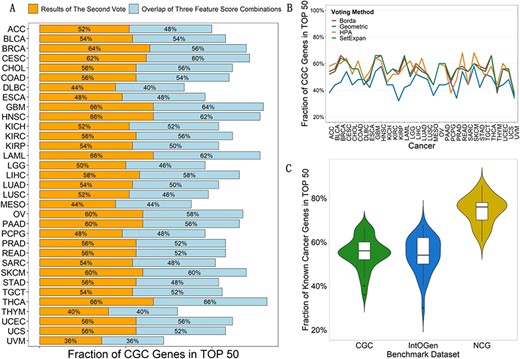
Evaluation for the second vote. (A) Comparison on overlap of three combinations after the first vote and predicted driver genes after the second vote by the voting method SetExpan. Each panel represents fractions of CGC genes in top |$50$| predicted for each kind of cancer by two sets. Blue panels match overlap of 3 feature combinations, while orange ones stand for results of the second vote. (B) Comparison of results after the second vote by four voting strategies. Each line represents one voting strategy and varies in |$33$| types of cancer. Note that Geometric represents the voting method Geometric mean. (C) Comparison of results after the second vote in three benchmark datasets. Each panel includes results of all |$33$| types of cancer and represents one benchmark driver set.
The performance of the first vote by four voting strategies is shown in Figure 2A. Each row includes results of all |$33$| types of cancer and represents one feature combination when utilizing one voting strategy. These three combinations identify similar CGC genes in quantity while it seems that the combination of Frequency and SIFT perform better in max and median among |$33$| kinds of cancer, |$70$|% and |$54$|%, respectively. In addition, for all three combinations, fractions of identified CGC genes reach |$40$|% in most kinds of cancer. However, results of some cancers are less than |$35$|%, such as MESO and UVM. Generally, the quantities of coding genes and samples included in most types of cancer are large enough when we choose top |$N$| significantly mutated coding genes as the datasets. But there are exceptions. For example, there are only |$2967$| and |$1476$| coding genes in MESO and UVM. That may be why less CGC genes are found in these two kinds of cancer.
We explore three feature combinations above in the view of pan-cancer further. Specifically, we merge all CGC genes in top |$50$| of all |$33$| kinds of cancer for each combination, and then take intersection of the three predicted CGC genes sets. Figure 2B shows overlap when using the voting method HPA and others are included in Supplementary Figure S1. The overlap is large enough that we reckon information provided by three feature combinations after repetitive iterations is similar.
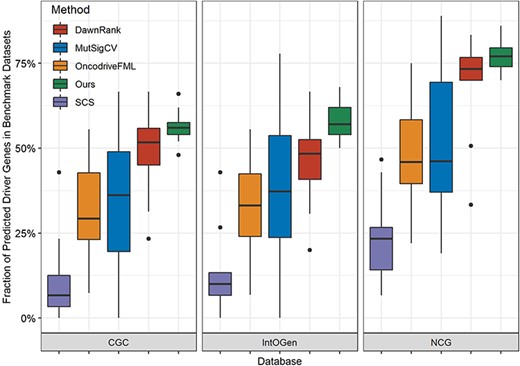
Comparison with four algorithms in three benchmark driver sets. Each group of panels corresponds to one benchmark driver set, in which every box includes results of all |$33$| types of cancer and represents one algorithm.
3.2 Analysis on gene interaction network
As one kind of vital information prioritizing driver genes, we also investigate impact of five individual networks on the effectiveness. Concretely, we integrate results of all three combinations for each network by four voting strategies, respectively. Figure 2C displays the voting results of utilizing Geometric mean and others are in Supplementary Figure S2. Each panel represents one reference network. Apparently, undirected graphs based on HINT+HI2012, iRefIndex and MultiNet find more CGC genes than those on the basis of DawnRank and Wu’network, medians of which three networks are |$50$|%, |$54$|% and |$36$|%. We discover that graphs obtained by dealing with the first three networks include less edges than those of the last two, which leads to a conclusion that our model may be more suitable for sparser networks. Note that gene interaction networks here have been selected to be identical with the mutated genes in the experimental dataset of each kind of cancer. Hence, it does not mean that original reference networks are sparse.
3.3 Overlap of first vote vs. second vote
Next, we perform the second vote to integrate ensemble ranked gene lists of three combinations using corresponding voting strategy. Top |$50$| are selected as our candidate driver genes. As shown in Figure 2B, there are |$106$| CGC genes sharing in three feature combinations when merging all CGC genes in top |$50$| of all |$33$| kinds of cancer for each combination. In the context of using four corresponding voting strategies, we classify the overlap into each kind of cancer and compare them with identified CGC genes after the second vote. Figure 3A displays the contrast of two sets in the condition of using the same voting method SetExpan and others are in Supplementary Figure S3. It is evident that performing the second vote on results of the first one prioritizes more CGC genes than only taking overlap of three feature combinations, which proves the necessity and rationality of the second vote. The same is true of other voting strategies. Therefore, we focus on analysis of the second vote in the following sections.
3.4 Comparison on four voting strategies
As shown in Figure 3B, there are dramatic variation between results of these |$33$| kinds of cancer. Some of them almost reach the proportion of |$~70$|%, such as |$68$|% for READ applying voting method HPA, while fractions of some are just about |$30$|%, such as |$34$|% for UVM utilizing Geometric mean. It indicates the heterogeneity of cancer. Comparatively speaking, SetExpan outstands relatively in quantity and consistency through comparison with other voting strategies. Hence, we do more research according to results of SetExpan in other benchmark driver sets and methods identifying driver genes.
3.5 Gold benchmark driver set
Due to the lack of a generally accepted gold standard (i.e. bona fide cancer driver genes), it has been difficult to determine which predictors performed best and which, if any, of the prediction tools performed adequately in previous studies [17, 20, 55]. However, three systematic benchmark sets are useful indicators of the excellence of tools for driver gene prediction. The CGC database manually curates a list of |$723$| genes whose mutations have been causally implicated in cancer [29]. It is widely acknowledged that a higher proportion of predictions in the CGC database indicates better performance [17, 20, 55]. Except CGC database, we also take NCG 6.0 database into consideration, which contains |$2,372$| cancer genes from manually curated publications. Besides these two databases, a new set of |$568$| driver genes have been recently reported by the IntOGen database. Overlap with the CGC, NCG and IntOGen gene lists is a benchmark for cancer driver genes.
As we can see, fraction of known cancer genes predicted for most of types of cancer hits over |$40$|% (Figure 3C) in CGC and IntOGen. But there is an outlier, i.e. UVM, whose fractions in two datasets above are |$36$|% and |$30$|%. In fact, available mutation data of UVM is lacking by contrast with other kinds of cancer, which may be the reason for its poor performance. It seems that proportion of NCG genes is much more considerable, and the overwhelming majority account for more than |$60$|%. Notably, the fraction of HNSC even reaches |$86$|%. In conclusion, the quantity of known cancer genes identified by our method is sufficient enough that we believe our method performs well in plentiful common types of cancer.
3.6 Comparison with other four methods
In this paper, we evaluate our method by comparing it with four excellent algorithms: DawnRank, MutSigCV, OncodriveFML and SCS. Their predictions of driver genes are obtained from DriverML. Figure 4 displays the proportion of predicted driver genes that are also presented in the CGC, IntOGen and NCG across the |$14$| kinds of cancer (specific cancer names are included in Supplementary Table 1) from TCGA database. Each panel represents one tool and is arranged in the order of its median fraction of predicted driver genes in three benchmark driver sets mentioned above. For a specific tool, fractions of its predicted drivers in three benchmark datasets vary among different cancer types. Our method ranks first and |$56$|%, |$57$|% and |$77$|% of its predicted candidate drivers belong to CGC, IntOGen and NCG, respectively. On the whole, our method and DawnRank are equally matched in terms of their median values: |$\sim $||$50$|% in CGC and IntOGen and |$\sim $||$70$|% in NCG. However, the fractions of predicted drivers in three databases are generally |$\lt $||$30$|% using SCS.
3.7 Novel driver gene analysis
It is vital to identify a core set of driver genes that are also predicted by several other methods [24]. The likelihood that predicted driver genes are actually associated with cancer increases with the number of tools that identify them, because false positives of one tool are likely to be discarded by other tools [55, 56]. Therefore, we acquire novel predicted driver gene list (Supplementary Table 2A) on the basis of non-CGC genes of our method and four methods above. Several prominent genes are investigated based on current literature reports using CarcerMine, a literature-mined database of drivers [57]. CancerMine extracts literature evidence of cancer genes, classifying them as drivers, oncogenes and tumor suppressors genes [13].
We count how many times each of non-CGC genes is predicted as drivers in all types of cancer. SOS1, which is regarded as the driver gene of half of |$14$| kinds of cancer [58, 59], is the most potential candidate in pan-cancer aspect. There are three papers related to this gene in CancerMine from 2018 to 2020. Researchers have found that SOS1, which is significantly mutated in lung adenocarcinoma, is an oncogene and that mutations in SOS1 are capable of driving tumor formation [60]. In addition, SOS1 plays an essential role in mediating the oncogenic effects of USP22 on gastric tumor growth, possibly via activating the RAS/ERK and PI3K/AKT pathways [61]. Due to its functional characteristics above, SOS1 may also participate in the development of other types of cancer, i.e. COAD, HNSC, KIRC, KIRP, UCEC, according our result. Hence, we have reason to believe that it is worthy of validating whether SOS1 influences progression of these tumors, and if so, how it induces cancer in patients.
In fact, we also do the same researches in top |$100$| and top |$150$| candidate driver genes to uncover more potential driver genes (Supplementary Table 2B, 2C). Although few non-CGC genes are shared by all five methods in every kind of cancer, there are three prominent non-CGC genes in PAAD. They are all predicted as cancer drivers by more than three methods. Specifically, EGR1 and SMARCC2 may be involved in the development of PAAD except aforementioned SOS1.
It has been reported that early growth response 1 (EGR1) is oncogenic in prostate cancer in 2005 [62] and other functions of EGR1 in cancer come to light from then on. For example, researchers reveal the stimulation of EGR1 transcriptional program through the RAS/MAPK signaling pathway in the study of endocrine gland cancer [63]. However, there is no paper to do with the role that EGR1 plays in PAAD in CancerMine database.
SMARCC2 is not included in CancerMine, but we seek out some researches by GeneCards [64], a searchable, integrative database that provides comprehensive information on all annotated and predicted human genes. It is reported that frameshift mutations in gastric and colorectal cancers would lead to premature stops of amino acid syntheses in SMARCC2 protein and resemble a typical loss-of-function mutation. Hence, SMARCC2 was hypothesized that frameshift mutations might contribute to tumorigenesis then [65]. Afterwards, researchers propose that SMARCB1-SMARCC2 subcomplex is required for the assembly and tumor suppression function of the BAF chromatin-remodeling complex [66]. Remarkably, tumor-suppression function of SMARCB1 has been proved and this gene is included in CGC databases. To sum up, SMARCC2 deserves more researches as one of potential driver genes in cancer.
4 Conclusion
In this work, a two-stage-vote ensemble model is designed to discover driver genes of |$33$| types of cancer based on mutation information, gene networks, iterative framework and voting strategy. By comparing with previous studies, results of the second vote demonstrate the effectiveness of our model. Except that, we conduct an additional analysis about feature combinations, gene interaction networks and voting strategies.
Nevertheless, there are also limitations in our work. One is that we do not assign weights to feature vectors when combining them in pair as the part of input. It is possible that the importance of mutation recurrence and FI is various in different kinds of cancer. What is more is that our model aims at finding driver genes in a population while individual tumors of the same type are heterogeneous. Therefore, it will be a bright choice to integrate weighted feature scores in a personalized manner.
|$\bullet $| We propose a two-stage-vote ensemble framework to identify more known cancer genes. This model is more precise than four existing methods in three benchmark driver sets.
|$\bullet $| We conduct an analysis about feature combinations and gene interaction networks after the first vote and perform an evaluation for four various voting strategies after the second vote. The analysis discovers more suitable combination and networks for our model and the evaluation determines better voting method on the basis of final ranked gene lists.
|$\bullet $| We uncover a number of potent driver genes in the level of pan-cancer and individual types of cancer, roles some of which play in tumor even hang in doubt.
Funding
This work is supported by a grant from the National Natural Science Foundation of China (NSFC 61972280) and National Key R&D Program of China (2020YFA0908400).
Data Availability
The data and results are available from https://github.com/guofei-tju/Two-stage-vote-ensemble-framework.
Yingxin Kan is currently master degree candidate in Tianjin University. Her research interests include bioinformatics and machine learning.
Limin Jiang is a PhD candidate in Tianjin University. Her research interests include bioinformatics and machine learning.
Jijun Tang is a professor in University of South Carolina. His main research interests include computational biology and algorithm.
Yan Guo is an associate professor in University of New Mexico, Comprehensive Cancer Center. His main research interests include bioinformatics.
Fei Guo is a professor at Central South University. Her research interests include bioinformatics and computational biology.
