


Abstract
RNA structural elements called pseudoknots are involved in various biological phenomena including ribosomal frameshifts. Because it is infeasible to construct an efficiently computable secondary structure model including pseudoknots, secondary structure prediction methods considering pseudoknots are not yet widely available. We developed IPknot, which uses heuristics to speed up computations, but it has remained difficult to apply it to long sequences, such as messenger RNA and viral RNA, because it requires cubic computational time with respect to sequence length and has threshold parameters that need to be manually adjusted. Here, we propose an improvement of IPknot that enables calculation in linear time by employing the LinearPartition model and automatically selects the optimal threshold parameters based on the pseudo-expected accuracy. In addition, IPknot showed favorable prediction accuracy across a wide range of conditions in our exhaustive benchmarking, not only for single sequences but also for multiple alignments.
Introduction
Genetic information recorded in DNA is transcribed into RNA, which is then translated into protein to fulfill its function. In other words, RNA is merely an intermediate product for the transmission of genetic information. This type of RNA is called messenger RNA (mRNA). However, many RNAs that do not fit into this framework have been discovered more recently. For example, transfer RNA and ribosomal RNA, which play central roles in the translation mechanism, nucleolar small RNA, which guides the modification sites of other RNAs, and microRNA, which regulates gene expression, have been discovered. Thus, it has become clear that RNAs other than mRNAs are involved in various biological phenomena. Because these RNAs do not encode proteins, they are called non-coding RNAs. In contrast to DNA, which forms a double-stranded structure in vivo, RNA is often single-stranded and is thus unstable when intact. In the case of mRNA, the cap structure at the 5′ end and the poly-A strand at the 3′ end protect it from degradation. On the other hand, for other RNAs that do not have such structures, single-stranded RNA molecules bind to themselves to form three-dimensional structures and ensure their stability. Also, as in the case of proteins, RNAs with similar functions have similar three-dimensional structures, and it is known that there is a strong association between function and structure. The determination of RNA three-dimensional (3D) structure can be performed by X-ray crystallography, nuclear magnetic resonance, cryo-electron microscopy, and other techniques. However, it is difficult to apply these methods on a large scale owing to difficulties associated with sequence lengths, resolution and cost. Therefore, RNA secondary structure, which is easier to model, is often computationally predicted instead. RNA secondary structure refers to the set of base pairs consisting of Watson–Crick base pairs (A–U, G–C) and wobble base pairs (G–U) that form the backbone of the 3D structure.
RNA secondary structure prediction is conventionally based on thermodynamic models, which predict the secondary structure with the minimum free energy (MFE) among all possible secondary structures. Popular methods based on thermodynamic models include mfold [1], RNAfold [2], and RNAstructure [3]. Recently, RNA secondary structure prediction methods based on machine learning have also been developed. These methods train alternative parameters to the thermodynamic parameters by taking a large number of pairs of RNA sequences and their reference secondary structures as training data. The following methods fall under the category of methods that use machine learning: CONTRAfold [4], ContextFold [5], SPOT-RNA [6] and MXfold2 [7]. However, from the viewpoint of computational complexity, most approaches do not support the prediction of secondary structures that include pseudoknot substructures.
Pseudoknots are one of the key topologies occurring in RNA secondary structures. The pseudoknot structure is a structure in which some bases inside of a loop structure form base pairs with bases outside of the loop (e.g. Figure 1A). In other words, it is said to have a pseudoknot structure if there exist base pairs that are crossing each other by connecting bases of base pairs with arcs, as shown in Figure 1B. The pseudoknot structure is known to be involved in the regulation of translation and splicing, and ribosomal frameshifts [8–10]. The results of sequence analysis suggest that the hairpin loops, which are essential building blocks of the pseudoknots, first appeared in the evolutionary timescale [11], and then the pseudoknots were configured, resulting in gaining those functions. We therefore conclude that pseudoknots should not be excluded from the modeling of RNA secondary structures.
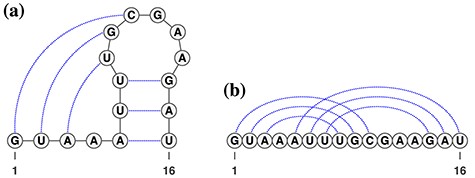
(A) A typical psudoknot structure. The dotted lines represent base pairs. (B) A linear presentation of the pseudoknot.
The computational complexity required for MFE predictions of an arbitrary pseudoknot structure has been proven to be NP-hard [12, 13]. To address this, dynamic programming-based methods that require polynomial time (|$O(n^4)$|–|$O(n^6)$| for sequence length |$n$|) to exactly compute the restricted complexity of pseudoknot structures [12–16] and heuristics-based fast computation methods [17–20] have been developed.
We previously developed IPknot [21], a fast heuristic-based method for predicting RNA secondary structures including pseudoknots. IPknot decomposes a secondary structure with pseudoknots into several pseudoknot-free substructures and predicts the optimal secondary structure using integer programming (IP) based on maximization of expected accuracy (MEA) under the constraints that each substructure must satisfy. The threshold cut technique, which is naturally derived from MEA, enables IPknot to perform much faster calculations with nearly comparable prediction accuracy relative to other methods. However, because the MEA-based score uses base pairing probability without considering pseudoknots, which requires a calculation time that increases cubically with sequence length, it is difficult to use for secondary structure prediction of sequences that exceed 1000 bases, even when applying a threshold cut technique. Furthermore, as the prediction accuracy can drastically change depending on the thresholds determined in advance for each pseudoknot-free substructure, thresholds must be carefully determined.
To address the limitations of IPknot, we implemented the following two improvements to the method. The first is the use of LinearPartition [22] to calculate base pairing probabilities. LinearPartition can calculate the base pairing probability, with linear computational complexity with respect to sequence length, using the beam search technique. By employing the LinearPartition model, IPknot is able to predict secondary structures while considering pseudoknots for long sequences, including mRNA, lncRNA and viral RNA. The other improvement is the selection of thresholds based on pseudo-expected accuracy, which was originally developed by Hamada et al. [23]. We show that the pseudo-expected accuracy is correlated with the ‘true’ accuracy, and by choosing thresholds for each sequence based on the pseudo-expected accuracy, we can select a nearly optimal secondary structure prediction.
Materials and Methods
Given an RNA sequence |$x=x_1 \cdots x_n\, (x_i \in \{ \textrm{A}, \textrm{C}, \textrm{G}, \textrm{U}\})$|, its secondary structure is represented by a binary matrix |$y = (y_{ij})$|, where |$y_{ij} = 1$| if |$x_i$| and |$x_j$| form a base pair and otherwise |$y_{ij}=0$|. Let |$\mathcal{Y}(x)$| be a set of all possible secondary structures of |$x$| including pseudoknots. We assume that |$y \in \mathcal{Y}(x)$| can be decomposed into a set of pseudoknot-free substructures |$y^{(1)}, y^{(2)}, \ldots , y^{(m)}$|, such that |$y = \sum _{p=1}^m y^{(p)}$|. In order to guarantee the uniqueness of the decomposition, the following conditions should be satisfied: (i) |$y \in \mathcal{Y}(x)$| should be decomposed into mutually exclusive sets; that is, for all |$1 \leq i < j \leq |x|, \sum _{p=1}^{m} y^{(p)}_{ij} \leq 1$|; (ii) every base pair in |$y^{(p)}$| should be pseudoknotted with at least one base pair in |$y^{(q)}$| for |$\forall q<p$|.
Maximizing expected accuracy
We can choose |$P^{\prime}(y \mid x)$|, a probability distribution over a set |$\mathcal{Y}^{\prime}(x)$| of secondary structures without pseudoknots, from among several options. Instead of using a probability distribution with pseudoknots, we can employ a probability distribution without pseudoknots, such as the McCaskill model [25] and the CONTRAfold model [4], whose computational complexity is |$O(|x|^3)$| for time and |$O(|x|^2)$| for space. Alternatively, the LinearPartition model [22], which is |$O(|x|)$| in both time and space, enables us to predict the secondary structure of sequences much longer than 1000 bases.
IP formulation
Pseudo-expected accuracy
To solve the IP problem (5)–(11), we are required to choose the set of thresholds for each level |$\tau ^{(1)}, \ldots , \tau ^{(m)}$|, each of which is a balancing parameter between true positives and true negatives. However, it is not easy to obtain the best set of |$\tau $| values for any sequence beforehand. Therefore, we employ an approach originally proposed by Hamada et al. [23], which chooses a parameter set for each sequence among several parameter sets that predicts the best secondary structure in terms of an approximation of the expected accuracy (called pseudo-expected accuracy) and makes the prediction by the best parameter set the final prediction.
We predict secondary structures |$\hat{y}_t$| (|$t=1, \ldots , l$|) for several threshold parameters |$\{ (\tau ^{(1)}_t, \ldots , \tau ^{(m)}_t) \mid t=1, \ldots , l \}$|. Then, we calculate their pseudo-expected accuracy |$\overline{F}(\hat{y}_t) + \overline{F}_{cb}(\hat{y}_t)$| and choose the secondary structure |$\hat{y}_t$| that maximizes the pseudo-expected accuracy as the final prediction.
Common secondary structure prediction
Implementation
Our method has been implemented as the newest version of a program called IPknot. In addition to the McCaskil model [25] and CONTRAfold model [4], which were already integrated into the previous version of IPknot, the LinearPartition model [22] is also supported as a probability distribution for secondary structures. To solve IP problems, the GNU Linear Programming Kit (GLPK; http://www.gnu.org/software/glpk/), Gurobi Optimizer (http://gurobi.com/) or IBM CPLEX Optimizer (https://www.ibm.com/analytics/cplex-optimizer) can be employed.
Datasets
To evaluate our algorithm, we performed computational experiments on several datasets. We employed RNA sequences extracted from the bpRNA-1m dataset [28], which is based on Rfam 12.2 [29], and the comparative RNA web dataset [30] with 2588 families. In addition, we built a dataset that includes families from the most recent Rfam database, Rfam 14.5 [31]. Since the release of Rfam 12.2, the Rfam project has actively collected about 1400 RNA families, including families detected by newly developed techniques. We extracted these newly discovered families. To limit bias in the training data, sequences with higher than 80% sequence identity with the sequence subsets S-Processed-TRA from RNA STRAND [32] and TR0 from bpRNA-1m [28], which are the training datasets for CONTRAfold and SPOT-RNA, respectively, were removed using CD-HIT-EST-2D [33]. We then removed redundant sequences using CD-HIT-EST [33], with a cutoff threshold of 80% sequence identity.
For the prediction of common secondary structures, the sequence selected by the above method was used as a seed, and 1–9 sequences of the same Rfam family and with high sequence identity (|$\geq 80\%$|) with the seed sequence were randomly selected to create an alignment. Common secondary structure prediction was performed on the reference alignments from Rfam and the alignments calculated by MAFFT [34]. Because there are sequences from bpRNA-1m that do not have Rfam reference alignments, only sequences from Rfam 14.5 were tested for common secondary structure prediction. To capture the accuracy of the common secondary structure prediction, the accuracy for the seed sequence is shown.
A summary of the dataset created and utilized is shown in Table 1.
Datasets used in our experiments. Each element of the table shows the number of sequences
| Pseudoknot-free | Pseudoknotted | |||||
|---|---|---|---|---|---|---|
| Short | Medium | Long | Short | Medium | Long | |
| Length (nt) | (12–150) | (151–500) | (501–4381) | (12–150) | (151–500) | (501–4381) |
| (Single) | ||||||
| bpRNA-1m | 1971 | 514 | 420 | 125 | 162 | 245 |
| Rfam 14.5 | 6299 | 723 | 9 | 1692 | 477 | 151 |
| (Multiple) | ||||||
| Rfam 14.5 | 5118 | 554 | 4 | 1692 | 477 | 151 |
Results
Effectiveness of pseudo-expected accuracy
First, to show the effectiveness of the automatic selection from among thresholds |$\tau ^{(1)}, \ldots , \tau ^{(m)}$| based on the pseudo-expected accuracy, Figure 2 and Table S1 in Supplementary Information show the prediction accuracy on the dataset of short sequences (|$\leq 150$| nt) using automatic selection and manual selection of the threshold |$\tau $| values. For IPknot, we fixed the number of decomposed sets of secondary substructures |$m=2$|, and varied threshold parameters |$\tau $| values for base pairing probability in such a way that |$\{(\tau ^{(1)}, \tau ^{(2)}) \mid \tau ^{(p)}=2^{-t}, p=1,2, \, t=1,2,3,4, \, \tau ^{(1)} \geq \tau ^{(2)}\}$|. In IPknot with pseudo-expected accuracy, the best secondary structure in the sense of pseudo-expected |$F$| is selected from the same range of |$(\tau ^{(1)}, \tau ^{(2)})$| for each sequence. For these variants of IPknot, the LinearPartition model with CONTRAfold parameters (LinearPartition-C) was used to calculate base pairing probabilities. In addition, we compared the prediction accuracy of IPknot with that of ThreshKnot [35], which also calculates base pairing probabilities using LinearPartition-C. We used |$\{2^{-t} \mid t=1,2,3,4\} \cup \{0.3\}$| as the threshold parameter |$\theta $| for ThreshKnot because the default threshold parameter of ThreshKnot is |$\theta =0.3$|. IPknot with threshold parameters of |$\tau ^{(1)}=0.125$| and |$\tau ^{(2)}=0.125$| had the highest prediction accuracy of |$F=0.659$|. IPknot with pseudo-expected accuracy has a prediction accuracy of |$F=0.658$|, which is comparable to the highest accuracy obtained. ThreshKnot with a threshold of 0.25 has an accuracy of |$F=0.656$|, which is also comparable to the best accuracy obtained.

PPV–SEN plot of IPknot and ThreshKnot for short RNA sequences (|$\leq 150$| nt).
The pseudo-expected |$F$|-value and “true” |$F$|-value are relatively highly correlated (Spearman correlation coefficient |$\rho =0.639$|), indicating that the selection of predicted secondary structure using pseudo-expected accuracy works well.
While the accuracy of the prediction of the entire secondary structure has already been considered, as shown in Figure 2, for the prediction of secondary structures with pseudoknots, it is necessary to evaluate the prediction accuracy focused on the crossing base pairs. In terms of prediction accuracy limited to only crossing base pairs, IPknot with pseudo-expected accuracy yielded |$F_{cb}=0.258$|, while the highest accuracy achieved by IPknot with the threshold parameters and ThreshKnot was considerably lower at |$F_{cb}=0.161$| and |$0.057$|, respectively (See Table S1 in Supplementary Information). We can observe the similar tendency to the above in Figures S1 and S2, and Tables S2 and S3 in Supplementary Information for medium (151–500 nt) and long (|$>500$| nt) sequences. These results suggest that prediction of crossing base pairs is improved by selecting the predicted secondary structure while considering both the pseudo-expected accuracy of the entire secondary structure and the pseudo-expected accuracy of the crossing base pairs.
Comparison with previous methods for single RNA sequences
Using our dataset, we compared our algorithm with several previous methods that can predict pseudoknots, including ThreshKnot utilizing LinearPartition (committed on 17 March 2021) [22], Knotty (committed on Mar 28, 2018) [22] and SPOT-RNA (committed on 1 April 2021) [6], and those that can predict only pseudoknot-free structures, including CONTRAfold (version 2.02) [4] and RNAfold in the ViennaRNA package (version 2.4.17) [22]. IPknot has several options for the calculation model for base pairing probabilities, namely the LinearPartition model with CONTRAfold parameters (LinearPartition-C), the LinearPartition model with ViennaRNA parameters (LinearPartition-V), the CONTRAfold model and the ViennaRNA model. In addition, ThreshKnot has two possible LinearPartition models for calculating base pairing probabilities. The other existing methods were tested using the default settings.
We evaluated the prediction accuracy according to the |$F$|-value as defined by Equation (14) for pseudoknot-free sequences (PKF in Table 2), pseudoknotted sequences (PK in Table 2) and only crossing base pairs (CB in Table 2) by stratifying sequences by length: short (12–150 nt), medium (151–500 nt) and long (500–4381 nt).
A comparison of prediction accuracies (|$F$|-values) by sequence length for each method
| Length | Short (12–150 nt) | Medium (151–500 nt) | Long (501–4381 nt) | ||||||
|---|---|---|---|---|---|---|---|---|---|
| PKF | PK | CB | PKF | PK | CB | PKF | PK | CB | |
| IPknot | |||||||||
| (LinearPartition-C) | 0.681 | 0.552 | 0.258 | 0.492 | 0.482 | 0.128 | 0.433 | 0.428 | 0.061 |
| (LinearPartition-V) | 0.669 | 0.499 | 0.143 | 0.478 | 0.461 | 0.091 | 0.380 | 0.370 | 0.038 |
| (CONTRAfold) | 0.678 | 0.550 | 0.259 | 0.495 | 0.505 | 0.154 | 0.426 | 0.413 | 0.066 |
| (ViennaRNA) | 0.669 | 0.500 | 0.144 | 0.480 | 0.461 | 0.091 | 0.212 | 0.317 | 0.041 |
| ThreshKnot | |||||||||
| (LinearPartition-C) | 0.681 | 0.501 | 0.027 | 0.493 | 0.475 | 0.019 | 0.439 | 0.431 | 0.008 |
| (LinearPartition-V) | 0.669 | 0.484 | 0.033 | 0.481 | 0.456 | 0.026 | 0.383 | 0.372 | 0.014 |
| Knotty | 0.641 | 0.550 | 0.315 | — | — | — | — | — | — |
| SPOT-RNA | 0.658 | 0.621 | 0.322 | 0.462 | 0.479 | 0.127 | — | — | — |
| CONTRAfold | 0.682 | 0.519 | 0.000 | 0.500 | 0.497 | 0.000 | 0.425 | 0.415 | 0.000 |
| RNAfold | 0.668 | 0.472 | 0.000 | 0.474 | 0.442 | 0.000 | 0.361 | 0.347 | 0.000 |
PKF, |$F$|-value for pseudoknot-free sequences; PK, |$F$|-value for pseudoknotted sequences; CB, |$F$|-value of crossing base pairs.
For short sequences, SPOT-RNA archived high accuracy, especially for pseudoknotted sequences. However, a large difference in accuracy between the bpRNA-1m-derived and Rfam 14.5-derived sequences can be observed for SPOT-RNA compared with the other methods (See Tables S4–S9 in Supplementary Information). Notably, bpRNA-1m contains many sequences in the same family as the SPOT-RNA training data, and although we performed filtering based on sequence identity, there is still a concern of overfitting. Knotty can predict structures including pseudoknots with an accuracy comparable to that of SPOT-RNA, but as shown in Figure 3, it can perform secondary structure prediction for only short sequences, owing to its huge computational complexity. Comparing IPknot using the LinearPartition-C and -V models with its counterparts, the original CONTRAfold model and ViennaRNA model achieved comparable accuracy. However, because the computational complexity of the original models is cubic with respect to sequence length, the computational time of the original models increases rapidly as the sequence length exceeds 1500 bases. On the other hand, the computational complexity of the LinearPartition models is linear with respect to sequence length, so the base pairing probabilities can be quickly calculated even when the sequence length exceeds 4000 bases. In addition to calculating the base pairing probabilities, IP calculations are required, but because the number of variables and constraints to be considered can be greatly reduced using the threshold cut technique, the overall execution time is not significantly affected if the sequence length is several thousand bases. Because ThreshKnot, like IPknot, uses the LinearPartition model, it is able to perform fast secondary structure prediction even for long sequences. However, for the prediction accuracy of crossing base pairs, ThreshKnot is even less accurate.
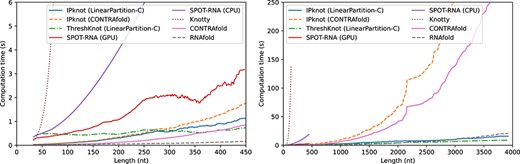
Computational time of each method as a function of sequence length. For SPOT-RNA with GPGPU, we used a Linux workstation with Intel Xeon Gold 6136 and NVIDIA Tesla V100. All other computations were performed on Linux workstations with AMD EPYC 7702. For IPknot, we employed IBM CPLEX Optimizer as the IP solver.
Pseudoknots are found not only in cellular RNAs but also in viral RNAs, performing a variety of functions [8]. Tables S10–S11 in Supplementary Information show the results of the secondary structure prediction by separating the datasets into cellular RNAs and viral RNAs, indicating that there is no significant difference in the prediction accuracy between cellular RNAs and viral RNAs.
Prediction of common secondary structures with pseudoknots
Few methods exist that can perform prediction of common secondary structures including pseudoknots for sequence alignments longer than 1000 bases. Table 3 and Tables S12–S20 in Supplementary Information compare the accuracy of IPknot that employs the LinearPartition model, and RNAalifold in the ViennaRNA package. We performed common secondary structure prediction for the Rfam reference alignment and the alignment calculated by MAFFT, as well as secondary structure prediction of single sequences only for the seed sequence included in the alignment, and evaluated the prediction accuracy for the seed sequence. In most cases, the prediction accuracy improved as the quality of the alignment increased (Single < MAFFT < Reference). IPknot predicts crossing base pairs based on pseudo-expected accuracy, whereas RNAalifold is unable to predict pseudoknots.
A comparison of prediction accuracies (|$F$|-values) of common secondary structure prediction by sequence alignments for each method
| Reference | MAFFT | Single | |||||||
|---|---|---|---|---|---|---|---|---|---|
| PKF | PK | CB | PKF | PK | CB | PKF | PK | CB | |
| IPknot | |||||||||
| (LinearPartition-C) | 0.765 | 0.616 | 0.220 | 0.732 | 0.585 | 0.218 | 0.718 | 0.548 | 0.227 |
| (LinearPartition-V) | 0.761 | 0.565 | 0.177 | 0.729 | 0.529 | 0.165 | 0.714 | 0.494 | 0.124 |
| RNAalifold | 0.804 | 0.611 | 0.000 | 0.745 | 0.540 | 0.000 | 0.716 | 0.474 | 0.000 |
PKF, |$F$|-value for pseudoknot-free sequences; PK, |$F$|-value for pseudoknotted sequences; CB, |$F$|-value of crossing base pairs.
Discussion
Both IPknot and ThreshKnot use the LinearPartition model to calculate base pairing probabilities, and then perform secondary structure prediction using different strategies. ThreshKnot predicts the base pairs |$x_i$| and |$x_j$| that are higher than a predetermined threshold |$\theta $| and have the largest |$p_{ij}$| in terms of both |$i$| and |$j$|. IPknot predicts the pseudoknot structure with multiple thresholds |$\tau ^{(1)}, \ldots , \tau ^{(m)}$| in a hierarchical manner based on IP (5)–(11), and then carefully selects from among these thresholds based on pseudo-expected accuracy. Because both the pseudo-expected accuracy of the entire secondary structure as well as the pseudo-expected accuracy of the crossing base pairs are taken into account, the prediction accuracy of the pseudoknot structure is inferred to be enhanced in IPknot.
Because the LinearPartition model uses the same parameters as the CONTRAfold and ViennaRNA packages, there is no significant difference in accuracy between using LinearPartition-C and -V and their counterparts, the CONTRAfold and ViennaRNA models. It has been shown that LinearPartition has no significant effect on accuracy even though it ignores structures whose probability is extremely low owing to its use of beam search, which makes the calculation linear with respect to the sequence length [22]. The LinearPartition model enables IPknot to perform secondary structure prediction including pseudoknots of very long sequences, such as mRNA, lncRNA, and viral RNA.
SPOT-RNA [6], which uses deep learning, showed notable prediction accuracy in our experiments, especially in short sequences containing pseudoknots, with |$F$|-value of 0.621, which is superior to other methods. However, SPOT-RNA requires considerable computing resources such as GPGPU and long computational time. Furthermore, SPOT-RNA showed a large difference in prediction accuracy between sequences that are close to the training data and those that are not compared with the other methods. Therefore, the situations in which SPOT-RNA can be used are considered to be limited. In contrast, IPknot uses CONTRAfold parameters, which is also based on machine learning, but we did not observe as much overfitting with IPknot as with SPOT-RNA.
Approaches that provide an exact solution for limited-complexity pseudoknot structures, such as PKNOTS [14], pknotsRG [15], and Knotty [16], can predict pseudoknot structures with high accuracy but demand a huge amount of computation |$O(n^4)$|–|$O(n^6)$| for sequence length |$n$|, limiting secondary structure prediction to sequences only up to about 150 bases. On the other hand, IPknot predicts the pseudoknot structure using a fast computational heuristic-based method with the linear time computation, which does not allow us to find an exact solution. Instead, IPknot improves the prediction accuracy of the pseudoknot structure by choosing the best solution from among several solutions based on the pseudo-expected accuracy.
IPknot uses pseudoknot-free algorithms, such as CONTRAfold and ViennaRNA, to calculate base pairing probabilities, and its prediction accuracy of the resulting secondary structure strongly depends on the algorithm used to calculate base pairing probabilities. Therefore, we can expect to improve the prediction accuracy of IPknot by calculating the base pairing probabilities based on state-of-the-art pseudoknot-free secondary structure prediction methods such as MXfold2 [7].
It is well known that common secondary structure prediction from sequence alignments improves the accuracy of secondary structure prediction. However, among the algorithms for predicting common secondary structure including pseudoknots, only IPknot can deal with sequence alignments longer than several thousand bases. In the RNA virus SARS-CoV-2, programmed -1 ribosomal frameshift (-1 PRF), in which a pseudoknot structure plays an important role, has been identified and is attracting attention as a drug target [10]. Because many closely related strains of SARS-CoV-2 have been sequenced, it is expected that structural motifs including pseudoknots, such as -1 PRF, can be found by predicting the common secondary structure from the alignment.
Conclusions
We have developed an improvement to IPknot that enables calculation in linear time by employing the LinearPartition model and automatically selects the optimal threshold parameters based on the pseudo-expected accuracy. LinearPartition can calculate the base pairing probability with linear computational complexity with respect to the sequence length. By employing LinearPartition, IPknot is able to predict the secondary structure considering pseudoknots for long sequences such as mRNA, lncRNA, and viral RNA. By choosing the thresholds for each sequence based on the pseudo-expected accuracy, we can select a nearly optimal secondary structure prediction.
The LinearPartition model realized the predictiction of secondary structures considering pseudoknots for long sequences. However, the prediction accuracy is still not sufficiently high, especially for crossing base pairs. We expect that by learning parameters from long sequences [36], we can achieve high accuracy even for long sequences.
We reduced the computational time required by IPknot from cubic to linear with respect to the sequence length by employing the LinearPartition model and enabled the secondary structure prediction including pseudoknots for long RNA sequences such as mRNA, lncRNA, and viral RNA.
We improved the accuracy of secondary structure prediction including pseudoknots by introducing pseudo-expected accuracy not only for the entire base pairs but also for crossing base pairs.
To the best of our knowledge, IPknot is the only method that can perform RNA secondary structure prediction including pseudoknot not only for very long single sequence, but also for very long sequence alignments.
Availability
The IPknot source code is freely available at https://github.com/satoken/ipknot. IPknot is also available for use from a web server at http://rtips.dna.bio.keio.ac.jp/ipknot++/. The datasets used in our experiments are available at https://doi.org/10.5281/zenodo.4923158.
Author contributions statement
K.S. conceived the study, implemented the algorithm, collected the datasets, conducted experiments, and drafted the manuscript. K.S. and Y.K. discussed the algorithm and designed the experiments. All authors read, contributed to the discussion of and approved the final manuscript.
Funding
This work was partially supported by a Grant-in-Aid for Scientific Research (B) (No. 19H04210) and Challenging Exploratory Research (No. 19K22897) from the Japan Society for the Promotion of Science (JSPS) to K.S. and a Grant-in-Aid for Scientific Research (C) (Nos. 18K11526 and 21K12109) from JSPS to Y.K.
Acknowledgments
The supercomputer system used for this research was made available by the National Institute of Genetics, Research Organization of Information and Systems.
Kengo Sato is an assistant professor at the Department of Biosciences and Informatics at Keio University, Japan. He received his PhD in Computer Science from Keio University, Japan, in 2003. His research interests include bioinformatics, computational linguistics and machine learning.
Yuki Kato is an assistant professor at Department of RNA Biology and Neuroscience, Graduate School of Medicine, and at Integrated Frontier Research for Medical Science Division, Institute for Open and Transdisciplinary Research Initiatives, Osaka University, Japan. His research interests include biological sequence analysis and single-cell genomics.
