


Abstract
Therapeutic peptides are important for understanding the correlation between peptides and their therapeutic diagnostic potential. The therapeutic peptides can be further divided into different types based on therapeutic function sharing different characteristics. Although some computational approaches have been proposed to predict different types of therapeutic peptides, they failed to accurately predict all types of therapeutic peptides. In this study, a predictor called PreTP-EL has been proposed via employing the ensemble learning approach to fuse the different features and machine learning techniques in order to capture the different characteristics of various therapeutic peptides. Experimental results showed that PreTP-EL outperformed other competing methods. Availability and implementation: A user-friendly web-server of PreTP-EL predictor is available at http://bliulab.net/PreTP-EL.
Introduction
Peptides can control human body growth, immune regulation, and metabolism [1, 2]. Peptides play an important role in biological activities. For example, anti-cancer peptides have the potential in curing cancer [3]. Anti-angiogenic peptides can inhibit angiogenesis and benefit the human body [4]. Cell-penetrating peptides can be transporters for drug delivery into cells [5]. Therefore, it is important to predict the therapeutic peptides by using computational methods.
In recent years, several machine learning methods have been developed to identify therapeutic peptides. The traditional machine learning methods can be divided into two steps: including peptide sequence feature extraction and machine learning classifiers.
In the first step, considerable research efforts have been made to characterize the discriminative features from the peptide sequences. A good feature extraction method can easily get a more discriminative feature vector, and effectively predict peptide sequences [6, 7]. Amino acid composition (AAC) and dipeptide composition (DC) are two features commonly used to represent the composition of the peptide sequence [8]. Composition of k-spaced amino acid pair (CKSAAP) [9] and adaptive skip dipeptide composition (ASDC) [10] consider short-range and long-range effects of residues, respectively. Pseudo amino acid composition (Pse-AAC) is based on the both composition and sequence information [11]. Several feature extraction methods utilize the physicochemical information to encode the peptide sequences, such as PPTPP [12]. Moreover, several peptide predictors extract the specific features from comprehensive features. For example, the PEPred-Suite [13] selects the discriminative features from 99 features using SFS and mRMD.
In the second step, different machine learning methods were used for constructing the predictors. For example, ACPredStackL [14] predicted anti-cancer peptides (ACP) trained with four different basic predictors, including KNN, Support Vector Machine (SVM), LigthGBM, and Naive Bayesian (NB). PPTPP [12] and PEPred-Suite [13] used random forest (RF) as their machine learning method. Most recent methods construct the models for specific peptides. For example, ACPred-FL [15] and ACPred-Fuse [16] models were established to predict the ACP. However, there is no predictor that can accurately predict all therapeutic peptides because of the different characteristics of different types of therapeutic peptides. In order to solve this problem, we developed an ensemble learning method to predict therapeutic peptides by integrating two machine learning classifiers with nine feature extraction methods.
Methods and materials
Dataset construction
In this study, we used eight therapeutic peptide datasets, including anti-angiogenic peptides (AAP) [17], anti-bacterial peptides (ABP) [18], anti-cancer peptides (ACP) [15], anti-inflammatory peptides (AIP) [19], anti-viral peptides (AVP) [20], cell-penetrating peptides (CPP) [21], polystyrene surface binding peptides (PBP) [22] and quorun sensing peptides (QSP) [23]. Their detailed information is listed in Table 1.
Information of the eight peptide training datasets and the independent test set
| Datasets | Training set | Independent test set | ||
|---|---|---|---|---|
| Positive | Negative | Positive | Negative | |
| AAP | 107 | 107 | 28 | 28 |
| ABP | 800 | 800 | 199 | 199 |
| ACP | 250 | 250 | 82 | 82 |
| AIP | 1258 | 1887 | 420 | 629 |
| AVP | 544 | 407 | 60 | 45 |
| CPP | 370 | 370 | 92 | 92 |
| QSP | 200 | 200 | 20 | 20 |
| PBP | 80 | 80 | 24 | 24 |
Table 1 shows that each dataset contains a training dataset and an independent dataset. The positive peptide sequences are usually experimentally proven to be therapeutic peptides, such as AAPs. While the negative peptide sequences are usually common and featureless peptide sequences or only random disordered sequences [13].
Overview of PreTP-EL
In this paper, we proposed a novel therapeutic peptides prediction method PreTP-EL based on ensemble learning. The PreTP-EL combines individual predictors via a genetic algorithm to improve prediction performance. First, nine different features are used to reflect the characters of a peptide sequence from its different properties. Second, the feature vectors from the previous step are sent into the two prediction models, including SVM and RF classifiers. Then we concentrate the 18 individual predictors using the optimal weights based on the genetic algorithm. Finally, the prediction model has predicted whether the query sequence is a therapeutic peptide or not. The higher the score is, the more likely the peptide is to be the corresponding specific peptide. The framework of PreTP-EL is illustrated in Figure 1.
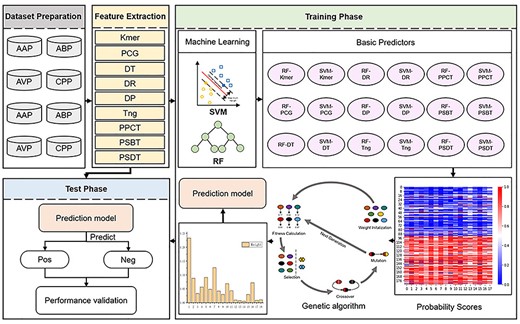
The framework of PreTP-EL. There are three main steps: (i) feature extraction. Each training or test peptide sequence is represented as nine feature vectors by nine feature extraction methods. (ii) Training phase. The nine feature vectors are fed into SVM and RF basic models for training, and then 18 individual basic predictors are constructed. The training sequences are embedded into the probability matrix based on 18 predictors, where the rows represent the probability scores obtained by the different predictors. Then, the probability matrix is fed into the genetic algorithm for training. The genetic algorithm is applied to learn the weights corresponding to the different predictors. (iii) Test phase. The therapeutic peptide sequence is predicted by Eq. (17).
Feature extraction methods
Kmer
PPCT
The feature dimension is |$\big(20\times \big(x-1\big)+y+400\times{d}_{MAX}\big)$| − D.
Tng
Tng [26] utilizes the evolutionary information based on the PSSM profiles and is represented as the profile-based building block of proteins. Tng represents the top n most frequent amino acids in the corresponding columns of the PSSM profile. The feature vectors represent the occurrences frequencies of |$n$|-gram subsequence in the PSSM profile (n ∈ [1, ⋯, 5]). The feature dimension is |${20}^n$|–D.
DT
DT [27] combines evolutionary information from Top-n-gram and distance information between pairs of amino acids. DT utilizes the occurrence times of all possible Top-n-gram pairs to calculate the feature vector at a given distance.
The dimension of DT is |$\big(20+20\times 20\times{d}_{MAX}\big)$| − D.
DR
DR [27] includes distance information between pairs of amino acids. DR calculates the occurrences of all possible residue pairs between distance |$d\ \big(d\in \big[0,\cdots, {d}_{MAX}\big],\big({d}_{MAX}>0\big)\big)$|. The dimension of DR is |$\big(20+400\times{d}_{MAX}\big)$| − D.
PCG
PSDT
PSBT
DP
Support vector machine and random forest
Widely used in the area of therapeutic peptide recognition and bioinformatics [37], the SVM [38] and RF [39] are two powerful algorithms. The SVM constructs the hyperplane for the decision boundary to produce the optimal separation class [38]. The scikit-learn package [40] with the radial basis function (RBF) kernel function is used to implement the SVM. The parameters C (with the regularization) and |$\gamma$| (with the kernel function) are optimized on the cross-validation.
The RF algorithm is one of the widely used algorithms in computational biology [12, 13]. It utilizes the automated voting system to determine the final classification results from multiple binary trees [39]. The detailed formulation of RF has been described in Breiman [41], and hence is not repeated here. The corresponding regularization parameters about the two predictors were given in Tables S2-S3.
Genetic algorithm
The genetic algorithm is an effective optimization method in the field of bioinformatics [42]. The genetic algorithm employs the crossover and mutation operation to optimize the individuals [43]. In this study, we calculate the fitness through the area under the curve (AUC) score to select excellent individuals. The characteristics of the better individuals will be passed on to the next generation through crossover and mutation, while eliminating the less desirable ones [43]. After hundreds of circulations, the optimal weight can be obtained.
In our study, we set the population size for the genetic algorithm as 1000, the generation for the genetic algorithm as 500, the number of folds for the cross-validation as 10 and the number of seeds for the partition of the dataset as 1.
Ensemble learning
As a series of previous peptides studies, such as PEPred-Suite [13], PPTPP [12], ACPred-Fuse [16], etc., the ensemble predictors derived from fusing varieties classifiers with different weights can provide better performance. In this study, nine feature extraction methods were fed into the two basic classifiers, SVM and RF, to produce 18 diverse predictors (such as RF-Kmer, SVM-Kmer, RF-DT, etc.). In order to improve the therapeutic peptide prediction performance, the proposed method employs 18 basic predictors with adaptive weights using a genetic algorithm for different peptide datasets.
Performance evaluation
Results and discussion
Cross-validation
In our experiment, we adopted the 10-fold cross-validation to evaluate the performance on 8 benchmark datasets. Genetic algorithms are used to generate the weights corresponding to 18 individual predictors per iteration. Then, the averages of 10 cross-validation optimization weights are set as the final weight results corresponding to certain dataset.
Performance of PreTP-EL
Importance of basic predictors
In this section, we evaluated and examined the importance of different predictors in distinguishing the therapeutic peptides. We compared the results of the proposed method with 18 ensemble learning methods, which integrate any 17 individual predictors with adaptive weights based on genetic algorithm. The results on the eight benchmark datasets are shown in Figure 2. The results show that the proposed method outperforms the other competition methods in terms of the AUC, indicating that the 18 predictors are necessary and removing one will significantly reduce the accuracy.
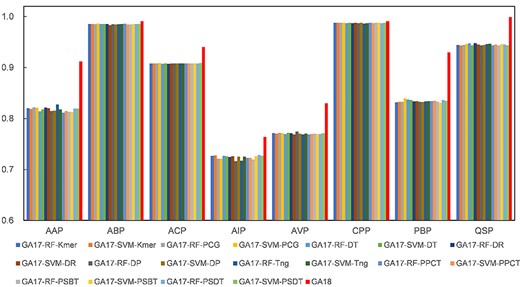
The performance of the PreTP-EL method and 18 individual predictors in terms of AUC on eight benchmark datasets. GA18 represents the proposed method PreTP-EL based on the 18 individual predictors. GA17-RF-Kmer represents the ensemble learning based on 17 predictors that the proposed method PreTP-EL eliminates the RF-Kmer predictor. The remaining 17 predictors employ the similar construction strategy.
Genetic algorithm improves the performance of the prediction model
To verify the effectiveness of adaptive weights based on genetic algorithm, we examined the ability of the proposed method with different weights strategies, including the average weights and the adaptive weights based on the genetic algorithm.
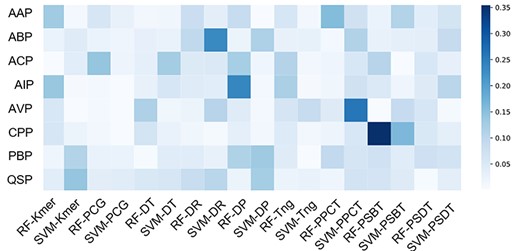
To show the performance of the average weights, we compared the prediction ability obtained by the 18 individual predictors (denoted as Ave18) and any 17 predictors (denoted as Ave17). The results are illustrated in Figure 3, from which we can see the following: (i) the red block means the Ave17 compared with Ave18 has a positive effect on prediction. In other words, the missing classifier has a negative effect, and vice versa. The darker the block, the greater the influence of the predictor on predicting the reference function peptide. (ii) The impact distribution of individual predictors is uneven on the eight benchmark datasets. Therefore, the same classifier has both positive and negative effects in different datasets.
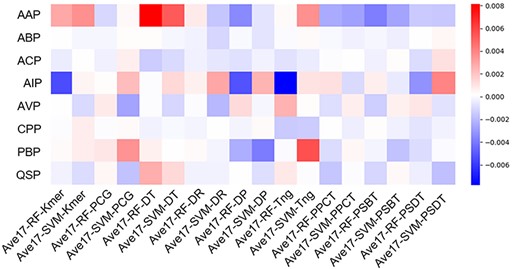
Differences between Ave17 and Ave18. Each block represents the value of corresponding Ave17 method minus the value of Ave18 method. The x-axis represents 18 kinds of Ave17. Ave17-RF-Kmer means the prediction result of ensemble learning method using 17 classifiers except RF-Kmer. The remaining 17 methods employ the similar construction strategy. The y-axis represents eight peptides datasets.
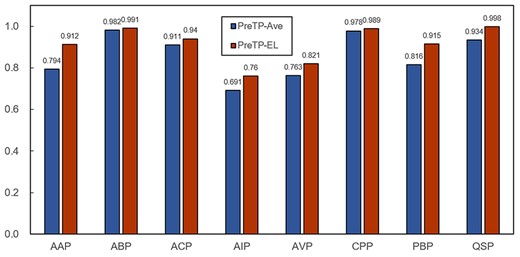
Furthermore, we employ the adaptive weights corresponding to the 18 individual predictors strategy to improve the prediction performance effectively. The performance of the ensemble methods with average weights and adaptive weights on training datasets and test datasets are shown in Figures 4 and 5, respectively. The results are shown that the proposed method with adaptive weights (PreTP-EL) outperforms the method with the average weights (PreTP-Ave) in terms of the AUC, indicating that the proposed method using the genetic algorithm is an effective method for therapeutic peptide prediction.
Comparison between the PreTP-Ave and PreTP-EL on the eight training datasets in terms of AUC.

Comparison between the PreTP-Ave and PreTP-EL in terms of AUC on the eight independent test datasets.
To investigate the importance of different basic predictors to the overall prediction accuracy of PreTP-EL, the distribution of the weights is illustrated in Figure 6. Figure 6 shows that the distribution of the weights between eight peptide benchmark datasets is various. The darker the color, the more important and discriminative the basic predictor is. Due to the functions of the eight peptides datasets are different, the prediction performance of 18 basic predictors is uneven. Therefore, it is necessary to utilize the adaptive weights based on the genetic algorithm to improve the effectiveness and robustness performance of the therapeutic peptide prediction.
Weights of individual predictors in the ensemble learning. The x-axis represents 18 basic predictors, and the y-axis represents eight peptides datasets.
Analysis of basic predictors
In this section, we evaluated the performance of the proposed method PreTP-EL and 18 basic individual predictors. The results are illustrated in Figure 7, from which we can observe the following: (i) the basic predictors using sequences feature achieve the comparable performance in prediction of therapeutic peptides. (ii) PreTP-EL further outperforms all the other basic predictors in the most benchmark dataset, by integrating the multi-features and various basic predictors through the genetic algorithm.
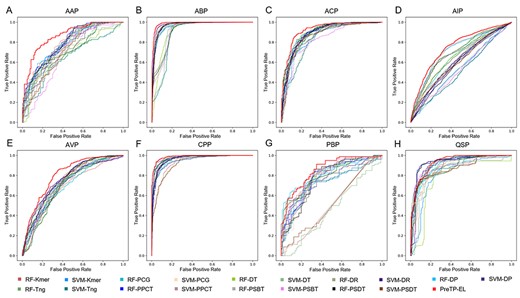
ROC curves of 18 basic predictors and PreTP-EL on eight benchmark datasets.
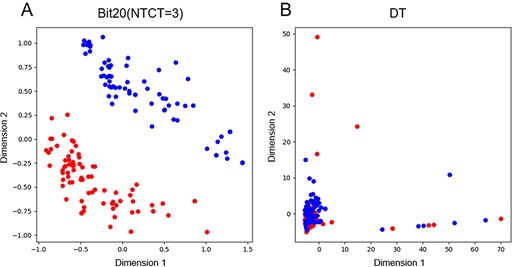
PCA on independent test dataset of ACP using Bit20(NTCT = 2) and DT.
Comparison of PreTP-EL with existing predictors
To examine the predictive power of PreTP-EL, we further evaluated and compared it with other existing predictors, including PPTPP [12] and PEPred-Suite [13]. The performance of different predictors is listed in Table 2 and Tables S4–S8, including PPTPP [12], PEPred-Suite [13], AntiAngioPred [17], AntiBP [18], ACPred-FL [15], AIPpred [19], AVPpred [20], CPPred-RF [21], PSBinder [22] and QSPpred [23]. These results showed that PreTP-EL achieved better or comparable performance than all the other competing methods in terms of AUC, ACC, MCC and P indicate that combining multiple supervised frameworks contributes to the better performance of PreTP-EL for predicting the therapeutic peptides.
The performance of the existing predictors and PreTP-EL on independent test datasets in terms of the AUC
| Datasets | PPTPP [12] | PEPred-Suite [13] | Methodsa | PreTP-EL |
|---|---|---|---|---|
| AAP | 0.770 | 0.804 | 0.742 (AntiAngioPred) | 0.819 |
| ABP | 0.988 | 0.976 | 0.976 (AntiBP) | 0.992 |
| ACP | 0.883 | 0.949 | 0.939 (ACPred-FL) | 0.950b |
| AIP | 0.720 | 0.751 | 0.795 (AIPpred) | 0.810 |
| AVP | 0.946 | 0.949 | 0.931 (AVPpred) | 0.951 |
| CPP | 0.965 | 0.952 | 0.941 (CPPred-RF) | 0.978 |
| PBP | 0.740 | 0.804 | 0.742 (PSBinder) | 0.809 |
| QSP | 0.944 | 0.960 | 0.903 (QSPpred) | 0.965 |
| Ave.c | 0.869 | 0.893 | 0.871 | 0.909 |
As shown in Table 2, PreTP-EL achieved better or comparable performance compared with the other existing methods, except the ACP. To test whether PreTP-EL is inherently unsuited for prediction ACP, or is influenced by the ACP dataset, we conducted a controlled experiment with different feature extraction methods. Due to the feature Bit20(NTCT = 2) obtains the highest feature representation score in the PEPred-Suite [13] on the ACP dataset, we integrate Bit20(NTCT = 2) with the PreTP-EL. The results in Table 2 showed that PEPred-Suite achieved a slightly higher than the PEPred-Suite, indicating that the proposed assembling framework can improve the performance in therapeutic peptide prediction.
Comparison of PreTP-EL with other existing predictors on the AP dataset
In this section, we further evaluated the performance of PreTP-EL on the AP dataset [45] by using the PreTP-EL model trained with the benchmark dataset, and compared with other related methods, including AntiCP2.0 [45], AntiCP [46], ACPred [47], ACPred-FL [15], ACPred-Fuse [16], PEPred-Suite [13] and iACP [48]. The results are shown in Table 3, from which we can see that: PreTP-EL outperforms all the other predictors in terms of ACC and MCC, further demonstrating the better performance of the proposed method.
The performance of PreTP-EL and other existing predictors on the AP datasetsa
| Methods | ACC | MCC | SE | SP |
|---|---|---|---|---|
| PreTP-EL | 0.866 | 0.733 | 0.843 | 0.890 |
| AntiCP2.0 [45] | 0.754 | 0.510 | 0.775 | 0.734 |
| AntiCP [46] | 0.506 | 0.070 | 1.000 | 0.012 |
| ACPred [47] | 0.535 | 0.090 | 0.856 | 0.214 |
| ACPred-FL [15] | 0.448 | −0.120 | 0.671 | 0.225 |
| ACPpred-Fuse [16] | 0.689 | 0.38 | 0.692 | 0.686 |
| PEPred-Suite [13] | 0.535 | 0.08 | 0.331 | 0.738 |
| iACP [48] | 0.551 | 0.110 | 0.779 | 0.322 |
aAll the results reported in this table except for the ones of PreTP-EL were obtained from [45].
Analysis of dataset ACP
In this section, we further examined the ability of the Bit20(NTCT = 2) and different sequence features in identifying ACP from non-ACP. We utilize the PCA to evaluate the performance of the Bit20(NTCT = 2) and DT feature, which is selected by the highest weight score based on the genetic algorithm. The results are illustrated in Figure 8, from which we can indicating that the Bit20(NTCT = 2) has better discrimination and can greatly separate ACP and non-ACP. The results in Table 2 and Figure 8 shown that the proposed method achieved a competitive performance in ACP prediction by utilizing the multiple discriminative features and integrating the basic predictors through the genetic algorithm.
Conclusion
In this study, a novel ensemble prediction model called PreTP-EL was proposed to identify multiple functional therapeutic peptides. The model combines nine feature extraction methods with two machine learning classifiers and integrated basic predictors based on a genetic algorithm. Furthermore, a user-friendly webserver of PreTP-EL is developed to predict the query peptide. The experimental results show that the proposed method outperforms the other state-of-the-art methods and achieves stable performance. Therefore, PreTP-EL is a useful algorithm for therapeutic peptide prediction. Because the prediction of novel peptides with post-translational modification is very important, in the future studies we will develop the computational predictors for post-translational modification prediction for novel peptides. Furthermore, because the post-translationally modified peptides are very interesting and important, we will analyze these peptides as well.
In this study, we proposed a therapeutic peptides prediction model PreTP-EL by integrating two machine learning classifiers with nine feature extraction methods. For different kinds of peptides, we constructed adaptively weights corresponding to 18 classifiers based on a genetic algorithm.
Feature analysis results show that the nine features used in this study are complementary. Predictors based on these features are able to improve the performance of therapeutic peptide prediction.
Furthermore, we established a webserver for PreTP-EL to predict unknown peptide sequences using a genetic algorithm and is available at http://bliulab.net/PreTP-EL. We expect that this webserver can help users identify therapeutic peptides.
Acknowledgements
We are very much indebted to the three anonymous reviewers, whose constructive comments are very helpful for strengthening the presentation of this paper.
Data Availability
The dataset used and analyzed during the current study are available from http://bliulab.net/PreTP-EL.
Funding
The National Natural Science Foundation of China (No. 62102030), the National Key R&D Program of China (No. 2018AAA0100100), and the Beijing Natural Science Foundation (No. JQ19019).
Yichen Guo is a master student at the School of Computer Science and Technology, Beijing Institute of Technology, Beijing, China. Her expertise is in bioinformatics, nature language processing and machine learning.
Ke Yan is a postdoctoral researcher at the School of Computer Science and Technology, Beijing Institute of Technology, Beijing, China. His expertise is in bioinformatics, machine learning.
Hongwu Lv is a master student at the School of Computer Science and Technology, Beijing Institute of Technology, Beijing, China. His expertise is in bioinformatics, nature language processing and machine learning.
Bin Liu, PhD, is a professor at the School of Computer Science and Technology, Beijing Institute of Technology, Beijing, China. His expertise is in bioinformatics, nature language processing and machine learning.
References
Author notes
Yichen Guo and Ke Yan authors contributed equally to this work.
