


Abstract
DNase I hypersensitive site (DHS) refers to the hypersensitive region of chromatin for the DNase I enzyme. It is an important part of the noncoding region and contains a variety of regulatory elements, such as promoter, enhancer, and transcription factor-binding site, etc. Moreover, the related locus of disease (or trait) are usually enriched in the DHS regions. Therefore, the detection of DHS region is of great significance. In this study, we develop a deep learning-based algorithm to identify whether an unknown sequence region would be potential DHS. The proposed method showed high prediction performance on both training datasets and independent datasets in different cell types and developmental stages, demonstrating that the method has excellent superiority in the identification of DHSs. Furthermore, for the convenience of related wet-experimental researchers, the user-friendly web-server iDHS-Deep was established at http://lin-group.cn/server/iDHS-Deep/, by which users can easily distinguish DHS and non-DHS and obtain the corresponding developmental stage of DHS.
INTRODUCTION
Some chromatin regions containing transcriptional active gene are more than 100 times more sensitive to DNase I degradation than the nontranscriptionally active region. These chromatin regions are called DNase I hypersensitive sites (DHSs) [1] (Figure 1). The DHSs typically mark compact [less than 250 base pair (bp)] functional cis-regulatory elements (CREs) [2], within promoters, enhancers, inhibitors and insulators, which can provide reliable signposts for high-precision delineation of regulatory DNA in complex genomes [3]. Furthermore, the genetic variations in DHSs are associated with a variety of diseases and phenotypic traits [4]. Recent studies have shown that DHS plays pivotal roles in cancer [5], Alzheimer’s disease [6], coronary artery disease and some common diseases [7]. For example, in the breast cancer research, the most highly mutated DHSs were identified as driver distal regulatory elements and affect the expression of cancer genes [5]. In the study of He et al. [8], DHSs were highly correlated with active genes expression in MSB1 cells, which can be considered as markers to identify the CREs associated with Chicken Marek’s disease. Therefore, precise identification of DHS is of crucial importance not only for deciphering transcriptional regulation but also for understanding the mechanisms of complex diseases.
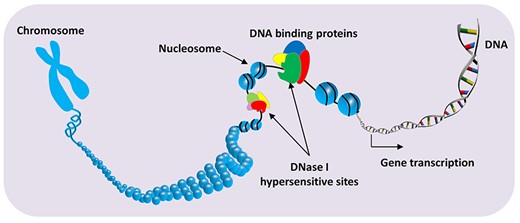
Schematic diagram of DNase I hypersensitive site in genome.
Now, some experimental techniques [9, 10] have been developed to study DHSs. Especially, the DNase-seq profiling [11] has enabled remarkable progress in understanding of DHSs with different developmental stages across different organs. According to statistics, to date, more than 290 million of DHSs derived from different tissues/cell types with different developmental stages have been recognized by various high-throughput methods [12]. Each tissue/cell type is represented by multiple distinguished DHS profiling derived from different individuals.
Based on such abundant data resources, many computational algorithms for detecting DHSs have been developed. For the identification of DHSs in human genome, Noble et al. [13] designed SVM-RevcKmer model to identify DHSs, in which they used RevcKmer to extract sequence information and established classifier by support vector machine (SVM). Feng et al. [14] developed a SVM-based model using pseudo K-tuple nucleotide composition (PseKNC) to identify DHS. Liu et al. [15] proposed an ensemble predictor named iDHS-EL, which combined three individual Random Forest (RF) classifiers with three different feature extraction methods (Kmer, RevKmer and PseDNC). Xu et al. [16] created predictor named iDHSs-PseTNC via deep sparse auto-encoder with pseudo trinucleotide composition (PseTNC). Manavalan et al. [17] utilized RF algorithm to obtain optimal features set from the combination of nucleotide composition and physicochemical properties (PP). Liang and Zhang [18] extracted features from the detrended moving-average cross-correlation coefficient descriptor based on dinucleotide property matrix and used SVM to construct classification model. Zhang et al. [19] used dinucleotide-based spatial autocorrelation to extract features and then utilized Ensemble Bagged Tree as classifier to build iDHS-DSAMS predictor. Recently, they developed iDHS-DXG model [20] based on XGboost. For the prediction of DHSs in plant genome (Arabidopsis and Rice), Zhang et al. [21] combined Revckmer and dinucleotide-based auto covariance to construct the feature space and build a predictor by SVM called pDHS-SVM. And then, they proposed an ensemble predictor pDHS-WE based on these five classes of features [22]. Soon afterward, they developed an ensemble ELM-based method based on two kinds of sequence-based features (Revckmer and PseDNC) [23]. Lately, they exploited pDHS-DSET method for DHSs prediction [24]. These methods have been summarized in Table 1 in the following aspects, identification species of DHSs, published year, method name, feature extraction method, prediction algorithm, web-server construction and related reference.
A comprehensive list of published methods for prediction DHS
| Species | Year | Name | Feature extraction | Classifier | Web server | Ref |
|---|---|---|---|---|---|---|
| Homo sapiens | 2005 | SVM-RevcKmer | RevcKmer | SVM | No | [12] |
| 2014 | SVM-PseKNC | PseKNC | SVM | No | [13] | |
| 2016 | iDHS-EL | Kmer, RevKmer, PseDNC | RF | Yes | [14] | |
| 2017 | iDHSs-PseTNC | PseTNC | Deep Sparse Auto-encoder | No | [15] | |
| 2018 | DHSpred | NC, PP | SVM | No | [16] | |
| 2019 | iDHS-DMCAC | DPM | SVM | No | [17] | |
| 2020 | iDHS-DSAMS | DSA | Ensemble bagged tree | No | [18] | |
| 2020 | iDHS-DXG | Kmer, Mismatch, DSA | XGboost | No | [19] | |
| Arabidopsis, Rice | 2017 | pDHS-SVM | RevKmer, DAC | SVM | No | [20] |
| 2018 | pDHS-WE | Kmer, RevKmer, Mismatch, PesKNC, AC | RF | No | [21] | |
| 2018 | pDHS-ELM | RevKmer, PseDNC | Extreme learning machine | No | [22] | |
| 2019 | pDHS-DSET | Kmer, RevKmer, Mismatch, PseDNC | SVM | No | [23] |
Although above-mentioned machine learning approaches [13–24] have taken an initial step toward prediction of DHSs in human and plants genome, there are no published methods for the identification of DHSs in mouse genome, especially for organ-specific or developmental stages-specific DHSs in mouse. In view of this, we introduce iDHS-Deep, a deep learning approach, for unambiguous determination of DHSs in various tissues and developmental stages in mouse genome. iDHS-Deep exhibited a superior performance for predicting DHSs in the experiments of 5-fold cross-validation and independent datasets validation. Finally, an open source ensemble tool was provided at http://lin-group.cn/server/iDHS-Deep/, which could predict whether an unknown sequence is potential DHS with certain developmental time point.
MATERIALS AND METHODS
Data collection and preprocessing
Breeze et al. [25] used DNase-seq to profile the regulatory landscape across the late embryonic and fetal stages of mouse development and create a comprehensive atlas comprising the DHSs of distinct tissues and developmental time points. Based on their study, we collected DHS sequences from multiple tissues and developmental stages in mouse genome.
To obtain reliable datasets, we drew the length distribution of DHSs and the distance distribution between two adjacent DHSs in Figure 2A and B. Further analysis found that more than 94.87% of DHSs were less than 300 bp in length, and more than 63.44% of the adjacent DHSs were less than 10 000 bp. Based on these investigations, we constructed positive and negative samples. In order to ensure the stability of the model, we only selected DHSs whose sequence length is between 50 and 300 bp as positive samples. For the construction of negative samples, firstly, the sequence fragments located between the adjacent DHSs with length more than 10 000 bp were selected as candidate negative samples. Subsequently, we set the coordinate of center point of each selected sequence fragments and take the list of coordinates on the flanking regions of p according to the rule (p|$\pm$|1000|$\times$|n, n = 0,1,2, …) until the distances from two coordinates to both terminals of the sequence fragments are less than 2000 bp. Finally, the sequence fragments flanking these coordinates with arbitrary length in ranges of 50–300 bp were extracted as non-DHS samples.
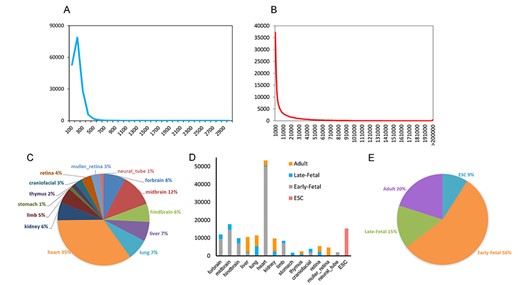
The information of DHSs in mouse genome. The length distribution of DHSs (A). The distance distribution between two adjacent DHSs (B). The proportion of cell types in the benchmark dataset (C). The proportion of different developmental stages in the benchmark dataset of each cell type (D). The proportion of different developmental stages in the benchmark dataset (E).
As the evaluation of proposed model on redundant samples will overestimate the performance of the model, the high similar sequences must be excluded. Here, we used the CD-HIT program [26] to remove redundant samples with a sequence identity cut-off of 0.8. On the basis of above steps, benchmark datasets were obtained. We provide the proportion of DHSs in different cell types (Figure 2C) and developmental stages (Figure 2E), respectively. As it can be seen from the Figure 2D, the dataset for each cell type is composed of one or more data of different developmental stages. Generally, an independent dataset should be established for objectively evaluation proposed models. Therefore, we divided the final datasets into training datasets and independent datasets in a ratio of 7:3 [27]. Details about the data are listed in Supplementary Table S1 available online at http://bib.oxfordjournals.org/.
Design of iDHS-Deep model and training strategy
The deep learning techniques provide new strategies to automatically detect the discriminative features based on the neural network models [28–34]. The Convolutional Neural Network (CNN) [35] and the Long Short-Term Memory (LSTM) [36] are two most widely used deep neural networks [37], because they can capture motifs, domains and extract global sequence order information. Thus, we used CNN and LSTM to construct a prediction model, called iDHS-Deep, to predict DHSs. The model consists of three modules: input module, feature extraction module and classification module. This network architecture is shown in Figure 3.
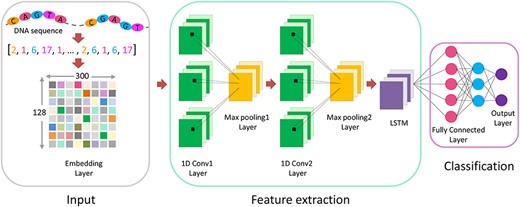
Visualization of the detailed architecture of iDHS-Deep.
In the input module, the input is the DHS or non-DHS sequence. Different from traditional binary coding strategy that has been widely used in DNA encode [38–40], we directly assigned different positive integer values to the four bases. Thus, an arbitrary DNA sequence can be converted into a string of numbers. For the DNA sequences with length less than 300 bp, we filled in 0 to make up length of 300 by the function pad_sequence. After that, a two-dimensional integer tensor with the shape of (samples, sequence_length) is generated. And then, embedding layer can convert a two-dimensional integer tensor into a three-dimensional floating-point tensor with the shape of (samples, sequence_length, embedding_dimensionality). Here, the ‘samples’ was the number of total of DHS and non-DHS sequences, the value of ‘sequence_length’ was 300 and the size of ‘embedding_dimensionality’ was set as 128. Finally, the three-dimensional floating-point tensor was used as the input of the feature extraction module.
The feature extraction module is in charge of finding the effective features from DNA sequences [41]. Its basic architecture consists of five distinct layers: first convolutional layer, first pooling layer, second convolutional layer, second pooling layer and one LSTM layer. A convolution layer was used for feature extraction, together with a rectifier operation (ReLU) to propagate positive outputs and eliminate negative outputs. Then, a max-pooling layer was used to reduce dimensions and help extract higher-level features. In this integration module, layers of convolution and pooling enabled the network to extract features from larger spatial ranges and potentially capture interactions between sequence motifs. And a following LSTM layer further captured short- and long-term dependencies in sequences and extracted the context features from the pooled sequence patterns [42].
In the classification module, a fully-connected layer [43] followed the LSTM was applied to mine the deep hidden DNA sequence features and the global sequence order information. Finally, the output vector of the fully connected layer was used as the input of the softmax layer, which generated the corresponding classification probability to a query sequence.
Implementation and training of iDHS-Deep
In this study, we used Keras (2.2.2) [44] with the backend of Tensorflow (1.2.1) [45] to implement the iDHS-Deep. The output node uses sigmoid function as activation function, whereas all the other nodes use rectified linear function (ReLU) [46] as activation function. In order to avoid the overfitting and internal covariate shift, the dropout technique was employed. And the batch size was set as 128.
Cross-validation is generally used to evaluate the performances of a model [47]. In this verification, the original dataset is grouped, one part is used as the training set and the other part is used as the validation set. Afterward, the classifier is trained with the training set, and tested with the validation set to evaluate the performance of the model. In practice, the generalization ability of a machine learning model should be further tested on a new independent dataset. Therefore, we firstly used the 5-fold cross-validation strategy to examine the classification model. Once the model was determined, an independent dataset examination was applied to further evaluate the model’s performances.
In the cross-validation and independent dataset test, four metrics were used to evaluate the performances of proposed predictor, including sensitivity, specificity, overall accuracy and Matthew’s correlation coefficient [48–51]. In addition, the area under the receiver operating characteristic (AUROC) [52] was also calculated to quantitatively and objectively evaluate the predictive ability of model.
RESULTS AND DISCUSSIONS
iDHS-Deep accurately predicts DNase I hypersensitive sites
According to the description of Materials and methods, DHSs classification models were established using 5-fold cross-validation on the training datasets of tissues and developmental stages. In order to show the performance of models visually, the AUROC values were drawn in Figure 4A and B. We noticed that the AUROCs yielded by models based on different tissues and different developmental stages are 0.88–0.96 and 0.90–0.95, respectively. Obviously, iDHS-Deep achieved good performance for detecting DHSs, indicating that the architecture of CNN-LSTM combination is feasible and effective for classifying DHSs.
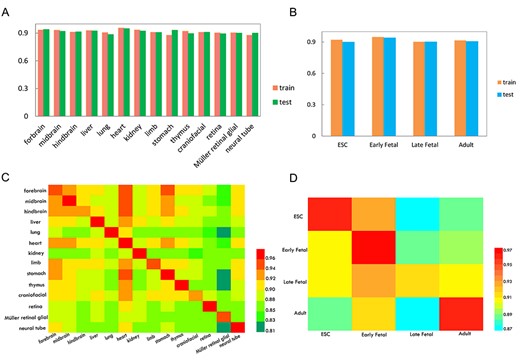
The 5-fold cross-validation, independent datasets validation and cross-cell validation were used to analyze the robustness and reliability of propose models. The histogram to show the performances of the 5-fold cross-validation of the training datasets and independent datasets validation, it is generated by the DHS datasets of tissues (A) and developmental stages (B), respectively. The heat map showing the values of AUROC in cross-cell types validation (C) and cross-developmental stages validation (D). Once a cell-specific model was established on its own training dataset in rows, it was validated on the data from the same cell as well as the independent data from the other datasets in columns.
To further assess the robustness and generalization of the models generated above, we examined the proposed model’s performance on independent datasets. The details about evaluation were recorded in Supplementary Table S2 available online at http://bib.oxfordjournals.org/. It showed that our model can achieve AUROC values of 0.89–0.95 and 0.90–0.94, respectively, for tissues (Figure 4A) and developmental stages (Figure 4B). These satisfactory results suggested that our proposed classification method iDHS-Deep has capability to identify the potential DHSs in different tissues or different developmental stages.
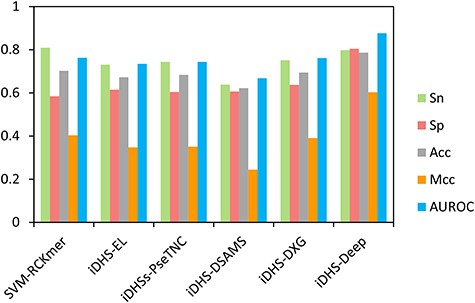
Compared iDHS-Deep with other published methods.
To provide an available tool, we built a user-friendly online web server called iDHS-Deep based on above-mentioned models, which can be accessed at http://lin-group.cn/server/iDHS-Deep. It is the first web server for mouse genome to identify whether an unknown sequence is a potential DHS sequence and which the development stage of this potential DHS belongs to. The powerful and robust tool could provide convenience to most of the scholars without computer or mathematic background.
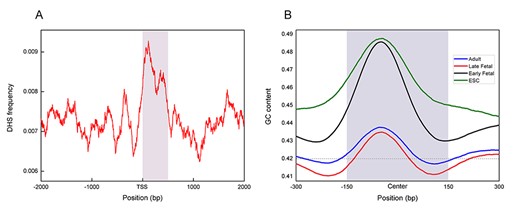
The distribution of DHS on known genes (A) and the distribution of GC-content along DHS sequences for four developmental stages (B).
Cross-tissues/developmental stages validation
After obtaining all robust classification models based on different tissues and developmental stages, one naturally wonder whether a model trained with the data from one tissue/developmental stage could recognize the DHS sequences in other tissues/developmental stages. To examine this potential relationship between different tissues and developmental stages, we further conducted cross-tissues/developmental stages validation. Based on the knowledge of transfer information [53], we trained the model on one tissue or developmental stage and then predicted DHS sequences in other tissues or developmental stages. For the convenience to observe, the AUROC values were represented by a heat map in Figure 4C and D to describe the prediction performance of cross-tissues and cross-developmental stages validation. The models in rows were tested on the other datasets in columns.
We observed that all calculated AUROC values are greater than 0.81 and 0.87, respectively, for the cross-tissues validation (Figure 4C) and cross-developmental stages validation (Figure 4D). These results suggested that DHS sequences of one specific tissue or developmental stage can be accurately identified as potential DHSs by any other models constructed on other tissue or developmental stage data. Especially, almost all models tend to achieve better results (AUROCs >0.89) on heart-based dataset in cross-tissue validation. In addition, due to the low heterogeneity among the forebrain, midbrain and hindbrain of mouse, it is expected that the cross-tissues examinations could produce better performance (AUROCs >0.92). Furthermore, we found most models based on themselves datasets always achieve satisfactory AUROCs (Figure 4C and D), which further proved the robustness and stability of the proposed models.
Compared with published methods
For further proving the superiority of our proposed method, we need to compare our proposed method with other published methods. Up to now, there have been published many excellent machine learning methods for predicting DHSs in human genome and plant genome (Table 1). But, it should be noted that these published tools were not based on the DHS datasets of mouse genome. To provide a fair comparison, we rebuilt the models of some typical published methods [13, 15, 16, 19, 20] by adopting the same assessment criteria and benchmark dataset of neural tube. The corresponding performances of models were produced and recorded in Supplementary Table S3 available online at http://bib.oxfordjournals.org/. As shown in Figure 5 available online at http://bib.oxfordjournals.org/, all the evaluation metrics suggested that iDHS-Deep is superior to other models. This result indicated that our proposed method is powerful and reliable for DHS identification in mouse genome.
Enrichment of DHSs within known genes
To study the pattern of DHSs in different regions of genes, we collected known gene of mouse from UCSC [54]. The coordinates of DHSs were mapped within a region that spanned the known gene as well as 2 kb upstream and downstream of transcription start site (TSS). The distribution of DHSs in this region was plotted a 2D plane in Figure 6A. It can be easily observed that DHSs are significant enriched in the range of 500 bp downstream of TSS (marked by dark rectangle). That is to say, DHSs are enriched nearby regions of known genes, which is consistent with previous study that DHSs in human genome were genetically enriched nearby or within known genes [55].
Enrichment of DHSs within GC-rich regions
The different development stages in mammalian are orchestrated by genome-encoded regulatory elements to create a dynamic chromatin landscape. Therefore, it is conceivable that DHSs also change dynamically at the sequence level at different stages of development. Because the vast majority of DHSs are less than 300 bp in length in Figure 2A, we selected all DHSs with lengths less than 300 bp for further sequence analysis. And then, the sequence fragments from 300 bp upstream to 400 bp downstream the midpoint of these DHSs sequences were took out. Next, a slide window of length 100 bp was used to calculate GC content [56] of each base. Finally, the obtained GC content of DHS sequences at different development stages was shown in Figure 6B, in which the dash line is the average GC-content in mouse genomes and the dark rectangle represents the DHS region.
First of all, we can see that the DHSs are located in GC-rich regions, where the GC-content exceeded the average. This was hardly an unexpected observation as GC-rich regions are likely to be the sites for regulatory signals and have significantly more hypersensitive to DNase digestion than random coordinates. Secondly, there were differences in the GC contents of the DHS regions in the four different developmental stages. Especially, the GC contents in the ESC and Early Fetal development stages were higher than in Late Fetal and Adult. Sequences with high GC-content perhaps have a higher degree of DNA methylation, which may reduce the levels of DNA transcription and gene expression. Therefore, the gene expression levels for different developmental stages of mouse are in a dynamic process.
CONCLUSIONS
The recognition of DHSs contributes to identify the precise location of many different regulatory elements in specific, well-studied genes. Here, CNN-LSTM-based method, named iDHS-Deep, was developed to identify DHSs in different tissues and developmental stages in mouse genome with the sequence-based features. The performances of models have been demonstrated using both 5-fold cross-validation and independent testing. Good prediction performance of proposed method also demonstrated that CNN-LSTM can extract effective features for predicting DHSs in mouse. According to the proposed model, we built a freely web server to judge whether an unknown sequence would be a potential DHS. Furthermore, the DHS sequences always enrich within regions of known genes, especially, nearby the gene 5′ UTR. High GC content in DHSs suggested dynamic regulation by epigenetics during different tissue and development stage. We hope the work could provide a theoretical guide for the research of gene expression mechanisms or experimental research in related fields.
Data availability
We provide the Python source code of iDHS-Deep model training, which is freely available at http://lin-group.cn/server/iDHS-Deep/download.html.
Author contributions
Conceptualization: H. Lin and F.-Y.D. Investigation: F.-Y.D., H. Lv and Z.-J.S. Coding: F.-Y.D., W.S. and Q.-L.H. Writing—Original Draft: F.-Y.D. and H. Lv. Writing—Review and Editing: H. Lin. Funding acquisition: H. Lin.
We provide the first machine learning method to identify the DHSs in mouse genome with CNN-LSTM-based model.
Experiments based on cross-validation and independent datasets validation demonstrate the excellent superiority of iDHS-Deep.
We briefly discussed the distribution of DHSs within known genes and GC-rich regions.
A user-friendly web-server iDHS-Deep at http://lin-group.cn/server/iDHS-Deep/ was built to detect DHSs in different tissues and developmental stages in mouse genome.
Funding
National Nature Scientific Foundation of China (61772119); Sichuan Provincial Science Fund for Distinguished Young Scholars (2020JDJQ0012).
Declaration of interests
The authors declare that they have no competing interests
Fu-Ying Dao is a PhD candidate of Center for Informational Biology at University of Electronic Science and Technology of China. Her research interests include bioinformatics.
Hao Lv is a PhD candidate of Center for Informational Biology at University of Electronic Science and Technology of China. His research interests include bioinformatics.
Wei Su is a MS candidate of Center for Informational Biology at University of Electronic Science and Technology of China. His research interests include bioinformatics.
Zi-Jie Sun is a MS candidate of Center for Informational Biology at University of Electronic Science and Technology of China. Her research interests are bioinformatics and machine learning.
Qin-Lai Huang is a MS candidate of Center for Informational Biology at University of Electronic Science and Technology of China. His research interests are bioinformatics.
Hao Lin is a professor of Center for Informational Biology at University of Electronic Science and Technology of China. His research is in the areas of bioinformatics and system biology.
