


Abstract
Biological pathways reflect the key cellular mechanisms that dictate disease states, drug response and altered cellular function. The local areas of pathways are defined as subpathways (SPs), whose dysfunction has been reported to be associated with the occurrence and development of cancer. With the development of high-throughput sequencing technology, identifying dysfunctional SPs by using multi-omics data has become possible. Moreover, the SPs are not isolated in the biological system but interact with each other. Here, we propose a network-based calculated method, CNA2Subpathway, to identify dysfunctional SPs is driven by somatic copy number alterations (CNAs) in cancer through integrating pathway topology information, multi-omics data and SP crosstalk. This provides a novel way of SP analysis by using the SP interactions in the system biological level. Using data sets from breast cancer and head and neck cancer, we validate the effectiveness of CNA2Subpathway in identifying cancer-relevant SPs driven by the somatic CNAs, which are also shown to be associated with cancer immune and prognosis of patients. We further compare our results with five pathway or SP analysis methods based on CNA and gene expression data without considering SP crosstalk. With these analyses, we show that CNA2Subpathway could help to uncover dysfunctional SPs underlying cancer via the use of SP crosstalk. CNA2Subpathway is developed as an R-based tool, which is freely available on GitHub (https://github.com/hanjunwei-lab/CNA2Subpathway).
Introduction
Cancer is a complex disease caused by the interactions of multiple dysfunctional genes and pathways [1]. Biological pathways are models that contain structural information between genes, such as interaction, regulation, modification and binding properties, which reflect the key cellular mechanisms that dictate cancer states, drug response and altered cellular function [2]. Pathway analysis is a powerful tool for understanding the biology system and helps to understand the pathogenesis and progression of cancer. Generally, genes in the same pathway usually coordinate to achieve some specific biological functions. Many pathway analysis methods, such as gene set enrichment analysis (GSEA) [3] and signaling pathway impact analysis (SPIA) [4], have been proven to be effective for revealing complex traits and dysregulated pathways behind human diseases. Edge set enrichment analysis [5] was developed to identify dysregulated pathways by investigating the changes of biological relationships of pathways in the context of gene expression (GE). LncRNAs2Pathways [6] found the functional pathways influenced by the combinatorial effects of a set of lncRNAs of interest based on a global network propagation algorithm. Although these methods have successfully identified dysregulated pathways, they did not consider the interaction between pathways. To do this, PAGI [7] was designed to identify dysregulated pathways by considering both within pathway effects and crosstalk between pathways. Lisa et al. proposed a latent pathway identification analysis (LPIA) [8], which constructs a pathway network that implicitly links pathways through their common function in the cells, to looks for statistically significant dysregulated pathways.
Recently, the concept of subpathways (SPs) was proposed, which were defined as the local areas of pathways. Compared with the original pathways, the SPs contain fewer components and reflect more specific biological functions. Several studies have reported that the dysregulated SPs were associated with the occurrence and development of cancer. SubpathwayMiner [9] facilitated the SP identification of metabolic pathways by using pathway topological structure information. It identified a ‘norepinephrine metabolism’ SP, which belongs to a local region of the ‘Tyrosine metabolism’ pathway, and which is highly associated with cancer initiation and progression [10]. However, the entire ‘Tyrosine metabolism’ pathway may not be found to be significant by the traditional pathway enrichment analysis method. This indicates that the SPs may tend to perform certain type-specific functions (e.g. norepinephrine metabolism) and may be more associated with certain phenotypes (e.g. cancer). SP-GM [11] was proposed to identify metabolic SPs by integrating the information of genes and metabolites, and their positions in a given pathway. This method identified 36 SPs associated with the progression of lung cancer, enriched by differentially expressed genes. MIDAS [12] determined condition-specific SPs, via GE data and network centrality information across multiple phenotypes. A novel systems biology R-based software package psSubpathway [13] identified phenotype-specific SPs in breast cancer dataset with multiple categories. It was also found that the SPs could be used as prognostic biomarkers of patients with breast cancer [14]. These SP analysis methods mainly identified SPs by using only the GE data between normal and tumor tissues, but considering multi-omics data will find more reliable SPs associated with cancer.
With the development of high-throughput sequencing technology, such as next-generation sequencing, the pathogenic mechanism of cancer will be better understood at the molecular level [15]. Multi-omics data integration allows the joint analysis of multiple omics data types to provide a global view of the biological system [16]. Somatic copy number alterations (CNAs) are nearly ubiquitous in cancer and alter a greater portion of the cancer genome than any other type of somatic genetic alteration [17, 18]. Finding cancer-related somatic CNA genes is an important challenge in identifying cancer molecular markers. Several recent methods of integrating CNA and GE data have been proposed. For example, the iGC package was effective and useful for identifying CNA-driven genes [19]. Oncodrive-CIS measured the cis effect of copy number changes that may be useful to identify genes involved in tumorigenesis due to CNAs [20]. These methods demonstrated that CNAs are both, directly and indirectly, correlated with changes in their expression [21]. To better study the function mechanism of the CNAs in cancer, the SP analysis by integrating CNA and GE data will be a promising strategy. Thus, it is essential to develop a calculated method to detect dysfunctional SPs driven by the CNAs at the system biology level. This will help to clearly understand the biological mechanism of cancer and develop new drug targets.
Here, we propose a network-based calculated method, CNA2Subpathway, to identify dysfunctional SPs with respect to somatic CNAs in cancer by integrating CNA data, GE data and SP crosstalk network. CNA2Subpathway provides a novel way of SP analysis by using the SP interactions. In the method, we first extract the SPs from the canonical biological pathways and construct a weighted SP crosstalk network. The weights of the network consider both the crosstalk relationship of the biological functions performed among those SPs and the differential expression extent of genes influenced by the CNAs. Next, we calculate the centrality scores of SPs by a random walk with a restart algorithm on the network, which reflects the extent of SPs influenced by the somatic CNAs and SPs crosstalk. Finally, a bootstrap-based randomization method is used to calculate the statistical significance of the scores. We analyze The Cancer Genome Atlas (TCGA) breast invasive carcinoma (BRCA) and head and neck squamous cell carcinoma (HNSC) data sets to illustrate the performance of CNA2Subpathway. We further compare our results with the GSEA and hypergeometric test methods based on somatic CNA and GE data without considering SP crosstalk (defined as CNA-GSEA and CNA-hypergeometric test). With these analyses, we demonstrate that the CNA2Subpathway method is able to identify the cancer-relevant SPs driven by somatic CNAs.
Materials and methods
CNA2Subpathway is a network-based calculated method to identify dysregulated SP driven by somatic CNAs. In this section, we describe the schematic overview of the CNA2Subpathway method in Figure 1. In steps1–3, a crosstalk network of SPs is constructed that reflects the interactions among SPs in the system biological level, through their participation in common biological functions simultaneously augmented with measurements of transcriptional dysregulation associated with CNAs. In step 4, we calculate the centrality score for each SP by using the random walk algorithm, which reflects the extent of SPs visited by a random walker on the network. Finally, we use a bootstrap-based randomization method to calculate the statistical significance of SP centrality scores. The SPs with significant centralities are reported as potentially dysfunctional on the cascade of altered SPs activated by somatic CNAs.
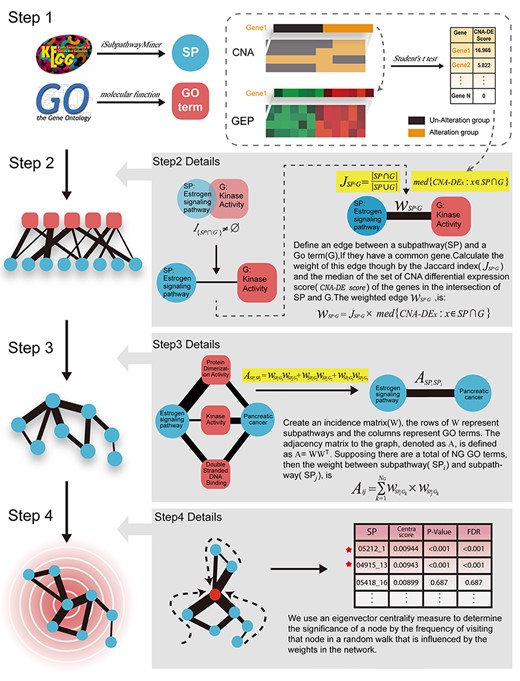
Schematic overview of the CNA2Subpathway method.
Data preprocessing
During constructing the SP network, we use three diverse but interrelated biological data: (1) biological pathways obtained from the Kyoto Encyclopedia of Genes and Genomes (KEGG) database, (2) biological molecular functions compiled in the gene ontology (GO) database, (3) CNA and GE data downloaded from TCGA.
SP extraction
We download the biological pathways from the KEGG database [2], which provides pathway structure information (such as interaction, regulation, modification, binding, etc., between genes) and is widely used in pathway analysis. Based on the structure information, each pathway is converted into an undirected graph. We extract SPs from each pathway graph based on the SubpathwayMiner method [9]. This method uses a k-clique algorithm to identify the SPs based on pathway topology information embedded in the graph, of which the genes in them have a highly similar function. The SubpathwayMiner method has been successfully applied in the SPs analysis method [13, 22]. Thus, 689 biological SPs are obtained.
Biological functions data
We use the GO [23] molecular function data obtained from MSigDB (version 7.0) [3], which C5 GO gene sets that contain genes annotated by the same GO term. The biological function terms with more than 5 genes or less than 100 genes are selected, which will avoid the terms from being either too specific or too vague. A total of 1441 biological function terms are retained.
Gene expression profile and CNA data preprocessing
We download gene expression profiles (GEPs) and CNA data with the same samples from the GDC TCGA portal (https://portal.gdc.cancer.gov/). In the study, BRCA and HNSC data sets are used. For the GEP data, we choose TCGA RNA-seq data, and the GE values are normalized by the Fragments per Kilobase per Million (FPKM). Then, the FPKM values for each gene are normalized with z-score. CNA data use the Gene-level GISTIC 2.0 [24] segmented and thresholded CNAs downloaded from the GDC database. While the segmented data contain the copy number estimate, the thresholded copy number data contain the thresholded estimate, i.e. −2, −1,0,1,2, representing homozygous deletion, single copy deletion, diploid normal copy, low-level copy number amplification and high-level copy number amplification.
Calculation of gene CNA-DEscore by integrating GE and somatic CNA data
In step 1, we define a gene CNA-DEscore to reflect the extent of GE influenced by its somatic CNA (Figure 1). Specifically, for each gene, the samples are classified into two different groups based on the CNA status derived from GISTIC2 analysis. The samples with copy deletion genes (CNA estimate values with −2 and − 1) are assigned with label ‘1’ and others are assigned with ‘0,’ or the samples with copy number amplification genes (CNA estimate values with 1 and 2) are assigned with label ‘1’ and others are assigned with ‘0.’ Thus, the samples obtain a binary label vector for each gene. Then, for each gene, we use Student’s t-test method to calculate the gene differentially expressed the extent between CNA labels. To compare the differentially expressed extent of genes influenced by CNAs at a common level, we convert the t-test P-value of each gene to z-score using |$z={\phi}^{-1}(1-p)$|, where |${\phi}^{-1}$| is the inverse normal cumulative density function. The z-score of the gene is defined as CNA-DEscore. If the expression of a gene is strongly influenced by its CNA, the CNA-DEscore will be relatively large.
Construction of a GO/SP bipartite network
Construction of the SP crosstalk network based on the bipartite network
In step 3, the SP crosstalk network is constructed based on the GO/SP bipartite network. The bipartite network can be represented as an incidence matrix |$W=[{W}_{i,j}]$|, where the rows of the matrix represent SPs and the columns represent GO terms. In the bipartite network, two SPs share more neighbor GO nodes; they tend to participate in similar biological functions and implement crosstalk with each other.
The |${N}_G$| denotes all number of GO terms. That means the weight of an edge between two SPs is the sum of the contributions, concerning the CNAs induced transcriptional dysregulation of all biological functions (GO terms) shared between them. Two SPs have an edge in this network when and only when they share at least one biological function induced by CNAs and the edge weights will be increased with GO terms to both SPs. Thus, a weighted SP crosstalk network is constructed, where self-interactions are removed. This process has been used by the LPIA algorithm for constructing the pathway network previously [8], we use it to construct the SP crosstalk network in the context of somatic CNAs.
Evaluation of dysfunctional SPs with eigenvector centrality
The parameter r is the restart probability, which has been demonstrated to have only a slight effect on the results when it fluctuated between 0.1 and 0.9 [25]. The default parameters r is set at 0.9. After an infinite number of steps, the probability |${\pi}^t$| will converge to a unique steady state |$\pi$|, whose ith element |${\pi}_i$| is defined as the EC score of the subpathway |${SP}_i$|. The EC score of SP will be influenced not only by the numbers of its neighbors but the values of the weights on the edges linked to it. A larger EC score |${\pi}_i$| indicates the subpathway |${SP}_i$| may be more inclined to be influenced by the cascade of altered SPs activated by somatic CNAs.
Results
SP analysis of BRCA
In the study, CNA2Subpathway was developed to identify cancer-relevant SPs driven by CNAs in cancer through integrating pathway topology information, multi-omics data and SP crosstalk. Specifically, we first converted each pathway into an undirected graph based on pathway structure information and extracted SPs from each pathway graph based on the SubpathwayMiner method [9], which uses a k-clique algorithm to identify the SPs based on pathway topology embedded in the graph. Then, we defined a gene CNA-DEscore by integrating genomic and transcriptome data to reflect the extent of GE influenced by its somatic CNA. Thirdly, we constructed a weighted GO/SP bipartite network. The weight of the edge in this network reflects both the relationship with SPs and GO terms and the CNA-DEscores. Finally, the SP crosstalk network is constructed based on the GO/SP bipartite network. The EC score of SP was calculated with a random walk with a restart algorithm in the network to determine the significance of an SP that is influenced by the somatic CNAs.
It has been reported in the literature that somatic CNAs offer new insight into the underlying of cancer [27]. CNA2Subpathway was designed to identify the SPs driven by the somatic CNAs. In the method, all the SPs will be evaluated, and then ranked with their eigenvector centrality score and FDR. The default threshold value of FDR was set at 0.2 in the study. However, the researchers could select the FDR threshold value as needed by using our ‘CNA2Subpathway’ package. To demonstrate the CNA2Subpathway method, we downloaded the BRCA dataset from the GDC TCGA database, which includes 1059 samples with both GE and somatic CNA data. We applied CNA2Subpathway to BRCA datasets, and the top 10 significant SPs are shown in Table 1, of which their original pathways include the estrogen signaling pathway, Citrate cycle (TCA cycle), fluid shear stress and atherosclerosis, etc. Most of these pathways have been reported to be related to tumor occurrence, development and alteration [28–31].
Top 10 subpathways identified by CNA2Subpathway in the BRCA dataset
| Rank | SubpathID | Pathway | Sizea | P-value | FDR |
|---|---|---|---|---|---|
| 1 | path:00020_6 | Citrate cycle (TCA cycle) | 12 | <0.001 | <0.001 |
| 2 | path:05418_16 | Fluid shear stress and atherosclerosis | 21 | <0.001 | <0.001 |
| 3 | path:04915_13 | Estrogen signaling pathway | 28 | 0.001 | 0.23 |
| 4 | path:05212_1 | Pancreatic cancer | 21 | 0.003 | 0.517 |
| 5 | path:05166_11 | HTLV-I infection | 23 | 0.007 | 0.758 |
| 6 | path:04066_3 | HIF-1 signaling pathway | 24 | 0.008 | 0.758 |
| 7 | path:05167_21 | Kaposi’s sarcoma-associated herpesvirus infection | 26 | 0.009 | 0.758 |
| 8 | path:05418_12 | Fluid shear stress and atherosclerosis | 15 | 0.01 | 0.758 |
| 9 | path:01524_4 | Platinum drug resistance | 25 | 0.011 | 0.758 |
| 10 | path:04623_4 | Cytosolic DNA-sensing pathway | 9 | 0.011 | 0.758 |
aThe number of genes contained in the subpathway.
With the default FDR < 0.2, CNA2Subpathway identified two statistically significant SPs. The most significant SP was path:00020_6 in the TCA cycle pathway, which contains 12 genes (Figure 2A). In the SP, two genes, fumarate hydratase (FH) and succinate dehydrogenase complex flavoprotein subunit A (SDHA) are copy number amplificated (labeled with pink in Figure 2A), and three genes, dihydrolipoamide S-succinyltransferase (DLST), succinate dehydrogenase complex iron–sulfur subunit B (SDHB), succinate dehydrogenase complex subunit D (SDHD), are copy number deleted (labeled with blue in Figure 2A). To study the biological function of the SP, we mapped the 12 genes to the original TCA cycle pathway. Interestingly, these SP genes are mostly concentrated in a local area of the pathway (marked with a red rectangle in Figure 2B), which including the continuous metabolic reaction of fumarate, succinate, succinyl-CoA, and S-succinyldihydrolipoamide-E. The CNAs of these genes such as FH, SDHA, DLST, SDHB and SDHD may result in enzymes abnormal of their encoded. And the abnormal metabolic enzymes such as FH and succinate dehydrogenase may cause metabolic dysregulation of this local pathway area (SP) [32]. Moreover, several literature have shown that the genetic and acquired changes of three TCA cycle enzymes, FH, succinate dehydrogenase, and isocitrate dehydrogenase, play a causal role in cancer progression, indicating that the metabolic changes may be potential signs of cancer [33, 34]. Especially, growing evidence suggest that FH mutations may also be involved in the pathogenesis of breast and bladder tumors [35].
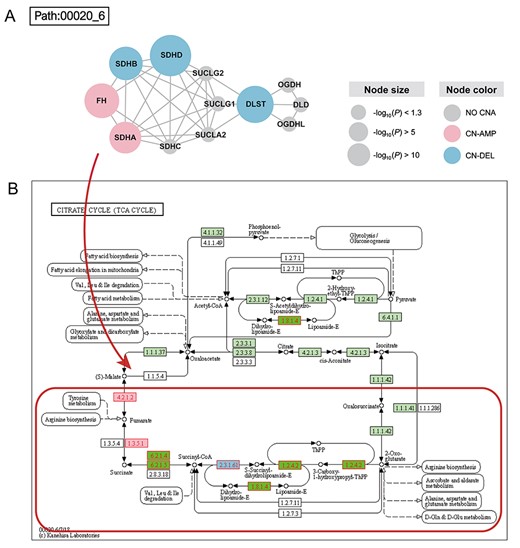
(A) Dysregulation subpathway (path:00020_6) of the TCA cycle pathway in BRCA. The t-test is used to calculate the gene differentially expressed the extent between CNA labels. A gene with a smaller P-value corresponding to a larger circle, indicating that it may be strongly influenced by its CNA. The copy number amplification (CN-AMP) genes are labeled with pink, the copy number deletion (CN-DEL) genes are labeled with blue and the non-CNA genes are labeled with gray. (B) TCA cycle pathway in the KEGG database. The genes in the subpathway are mapped to the pathway. The subpathway region is marked with a red rectangle.
We tested if the dysregulated SPs driven by the CNAs were associated with the prognosis of breast cancer patients. For the SP, the risk score of the SP for each sample was calculated by the sum of the weight expression value across all the genes in the SP, where the gene weight was the univariate Cox proportional hazards regression coefficient estimated on the GE value and the overall survival data. According to the median of SP risk scores, patients were classified into high-risk and low-risk groups (Figure 3A; log-rank P = 1.4e-3 in Kaplan–Meier survival analysis). With another significant SP path:05418_16 in fluid shear stress and atherosclerosis pathway, patients were also classified into two different groups (Figure 3C; log-rank P = 1.2e-4). These results indicate that the SPs identified by the CNA2Subpathway method may be used as potential prognostic biomarkers.
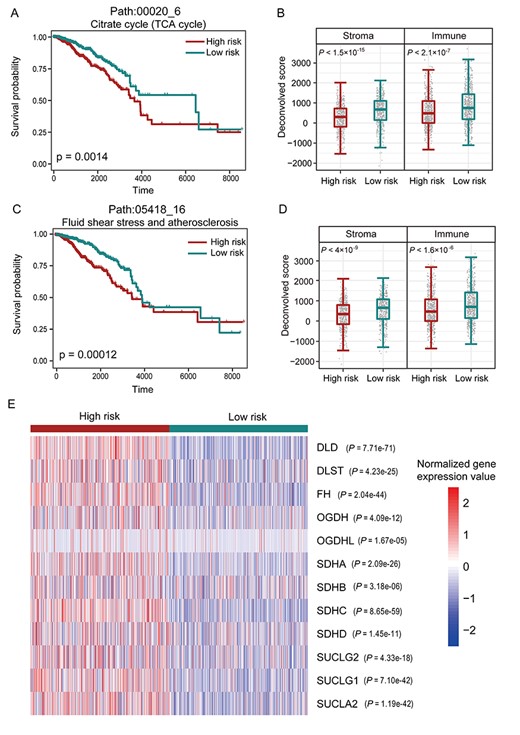
(A) Kaplan–Meier survival curves of patients classified into high-risk and low-risk groups using subpathway path:00020_6 in the TCA cycle pathway. P-value was estimated using the log-rank test. (B) Box plot to show the stromal and immune scores for the patients in high-risk and low-risk groups classified by the subpathway path:00020_6. (C) Kaplan–Meier survival curves of patients classified into high-risk and low-risk groups using subpathway path:05418_16 in the fluid shear stress and atherosclerosis pathway. (D) Box plot to show the stromal and immune scores for the patients in high-risk and low-risk groups classified by the subpathway path:05418_16. (E) Heat map of the normalized expression values of the genes in the subpathway path:00020_6.
Moreover, there was a recent study report that somatic CNAs play important roles in cancer immune [36]. Thus, we tested the difference of cancer immune between high-risk and low-risk groups classified by the significant SPs. We used the ESTIMATE method [37] to infer the stromal and immune scores in tumor patients. This method calculates stromal and immune scores to predict the level of infiltrating stromal and immune cells by performing single-sample GSEA on GE data. We applied the R-based ‘ESTIMATE’ package to implement this method (https://sourceforge.net/projects/estimateproject/). For the patients in high-risk and low-risk groups classified by the SP path:00020_6, the stromal and immune scores presented a significant difference (ANOVA analysis, P < 1.5e-15 and P < 2.1e-7,) (Figure 3B). Similar results were also found in patient groups classified by the SP path:05418_16 (ANOVA analysis, P < 4e-9 and P < 1.6e-6, Figure 3D). Interestingly, the original TCA cycle pathway of path:00020_6 has been reported to be related to the immunity of transformed cells and malignant tumors [38]. Furthermore, some genes, include DLST, FH, SDHB, SDHD, which occurred copy number variation in this SP, were used as marker genes for an estimate of the endothelial cells and macrophages in the study of Alejandro et al. [39]. These results indicate that the significant SPs may be associated with the tumor immune microenvironment.
We then tested the expression changes of genes in the significant SPs. For the SP path:00020_6 in the TCA cycle pathway, the heatmap of normalized GE values shows obvious differences between patients in high-risk and low-risk groups (Figure 3E). This might be the result of the CNAs of the genes in the SP, which may alter the activity of SP and further influence the progress of cancer.
SP analysis of HNSC
The HNSC dataset includes 526 samples with both CNAs and GE data. In the dataset, CNA2Subpathway identified two significant SPs (FDR < 0.2) that are SP path:04140_8 in the autophagy pathway and path:05418_16 in the fluid shear stress and atherosclerosis pathway. Some studies proposed that these two pathways play important roles in the initiation and progression of cancer [40, 41]. For example, fluid shear stress and atherosclerosis pathway have been reported to be associated with altering the cancer cell response to receptor-mediated apoptosis [42, 43]. Moreover, most of the top 10 significant SPs (listed in Supplementary Table S1) are also associated with cancer, such as path:04150_16 in the mTOR signaling pathway and path:04066_3 in the HIF-1 signaling pathway, etc. To further explore their effect on the cancer process, the SP risk score is calculated in the same manner in the previous case. We then performed a Cox proportional hazard regression model estimated the risk score of each SP and the overall survival data. The results showed that these SPs are all risk factors [hazard ratios (HRs) > 1, P < 0.001] (Figure 4A), which indicates that these SPs may play important roles in the process of HNSC. We also calculated the SP risk scores of patients by using genes with CNAs and all genes in the SP, respectively. For the SP path:04140_8 in the autophagy pathway, the results showed that the risk score based on all genes in the SP had a better-classifying effect than those of the genes with CNAs (Figure 4B). This indicates that the CNAs may not only influence the states of their genes but also the neighboring genes in the SP, and further alter the activity of the SP.
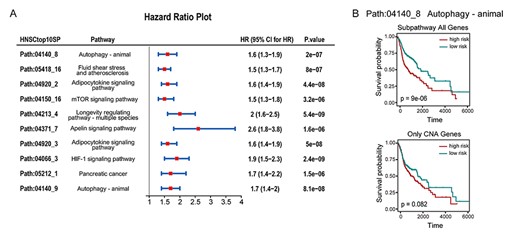
(A) Forest plot shows HR, the 95% confidence interval (CI), and P-values of the top 10 significant subpathways in HNSC calculated by the univariate Cox proportional hazards regression model. (B) Kaplan–Meier plots show the prognostic signal related to the subpathway path:04140_8 in the autophagy pathway. The upper shows all genes in the path:04140_8 as signature; the lower shows only CNA genes in the path:04140_8 as a signature.
We then tested genes with CNAs in the SPs, which may alter the SP activity. For the SP path:04140_8 in the autophagy pathway, three genes occur copy number amplification (IGF1R, PRKAA1 and IRS2) and nine genes occur copy number deletion (AKT1, MTOR, HRAS, INS, IRS1, NRAS, PIK3CD, PTEN and RHEB) (Supplementary Figure S1A). We use the ‘maftools’ package [44] to provide visualization of those 12 genes across the HNSC samples. The waterfall plot shows that out of 526, 425 (80.8%) samples are copy number altered for the genes (Figure 5A). Then, Fisher’s exact test was used to perform co-occurrence and mutual exclusivity analysis between each pair of CNAs genes in the SP. The results showed that more than 60% of the gene pair are co-occurrence (P < 0.05) (Figure 5B). This indicates that the CNAs genes in the SP may tend to jointly implement the biological function.
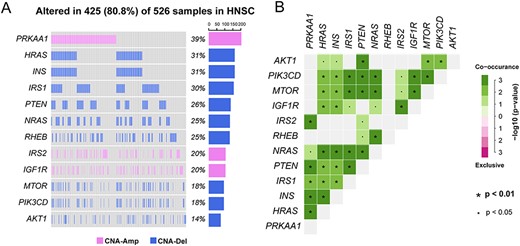
(A) Waterfall plot of 12 genes with CNAs in the subpathway path:04140_8 in the autophagy pathway. (B) Co-occurrence and mutual exclusivity plots between genes with CNAs. Fisher’s exact test was used to calculate the statistical significance between each pair of genes.
We further tested if the significant SPs were associated with the tumor immune microenvironment in HNSC. For the significant SP path:04140_8 in the autophagy pathway and SP path:05418_16 in the fluid shear stress and atherosclerosis pathway, the patients were classified into high-risk and low-risk groups according to median SP risk scores (Supplementary Figure S2A and C). For the patients in high-risk and low-risk groups classified by the SP path:04140_8, the stromal and immune scores were, respectively, calculated with ESTIMATE [37]. These two scores were shown to be a significant difference between the two groups (ANOVA analysis, P < 0.012 and P < 1.3e-7, Supplementary Figure S2B). For the patients classified by the SP path:05418_16, the immune scores also presented a significant difference (ANOVA analysis, P < 1.6e-4, Supplementary Figure S2D). This indicates that the dysregulated SPs may influence the tumor immune microenvironment in HNSC.
To detect the biological function of the SP, we mapped the genes in the SP path:04140_8 to its original pathway (Supplementary Figure S1A), and a local region of the autophagy pathway was identified (Supplementary Figure S1B). It has been proposed that the autophagy pathway is implicated in the pathogenesis of various diseases, like cancer, infectious diseases and neurodegenerative disorders [45]. According to this pathway map, we found that the SP region has crosstalk with the mTOR signaling pathway and the insulin signaling pathway (Supplementary Figure S1B).
SP analysis of multi-cancers
We selected eight cancers in TCGA, including BRCA, cervical squamous cell carcinoma and endocervical adenocarcinoma (CESC), colon adenocarcinoma (COAD), HNSC, lung adenocarcinoma (LUAD), lung squamous cell carcinoma (LUSC), pancreatic adenocarcinomas (PAAD) and stomach adenocarcinoma (STAD), to quantitatively determine the similarity between different tumor types at the SP level. To provide a general comparison, the top 10 most significant SPs for each cancer identified by CNA2Subpathway were enrolled. Through comparison, 38 SPs only appear in a single cancer type and three SPs are overlapped in at least four (1/2) cancer types (Figure 6A). The three highly overlapped SPs are path:05418_16 in fluid shear stress and atherosclerosis, path:04066_3 in the HIF-1 signaling pathway, and path:04915_13 in the estrogen signaling pathway.
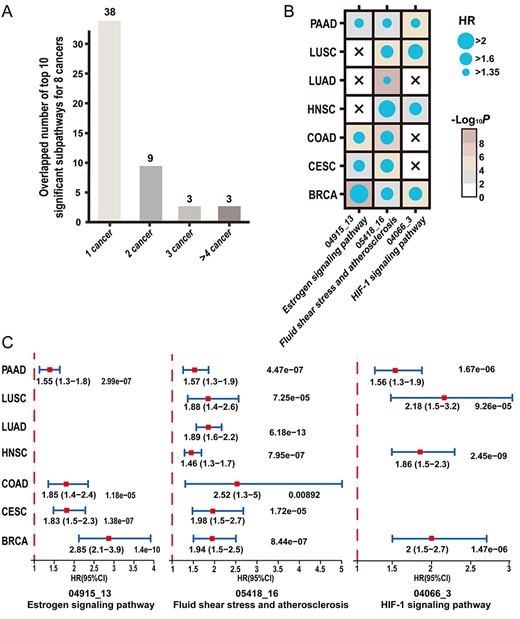
(A) Comparison of the top 10 most significant subpathways for each of eight cancers cancer identified by CNA2Subpathway. (B) Dot plot of univariate HRs and P-values for the three highly overlapped subpathways associated with patient outcome (HR > 1.3, P < 0.01) in their respective cancers but STAD. (C) Forest plot showing HR and 95% CI for the three overlapped subpathways across seven cancers except for STAD. HR, 95% CI, and P-values are calculated by using the univariate Cox proportional hazards regression model.
Through univariate Cox proportional hazards regression analysis, the three highly overlapped SPs were all found to be associated with patient prognosis in their respective cancers but STAD (HR > 1.35, P < 0.01) (Figure 6B). The SP path:05418_16 are implicated in seven cancer types, and SP path:04066_3 and path:04915_13 are implicated in four cancer types. The detailed HRs information for these SPs across seven cancers except for STAD was shown with a forest plot (Figure 6C). The highly overlapped SPs driven by CNAs across multiple cancers may play some consistent biological function. These overlapped SPs thereby highlight the repurposing potential of anti-cancer drugs targeting the SPs.
Comparison of CNA2Subpathway with other pathway analysis methods
To determine whether CNA2Subpathway could provide new biological insights in identifying important SPs driven by somatic CNAs, we compared our results with the widely used pathway or SP analysis methods, which are the hypergeometric test, GSEA [2], SPIA [4], SP-GM [11] and SubpathwayMiner [9]. The summary of these methods was listed in Supplementary Table S2. These methods are mainly designed to identify dysregulated pathways based on GE data; however, CNA2Subpathway identifies dysregulated pathways driven by CNAs by using SP crosstalk. To provide a fair comparison, we improved these methods to make them apply CNAs and GE data. Specifically, for GSEA, the CNA-DEscores of genes are calculated by integrating CNAs and GE data (see Method section), and a ranked list of genes is constructed according to decreasing CNA-DEscores. The genes in each pathway are mapped to the ranked gene list, and pathway enrichment scores were calculated to identify the statistically significant pathways. For the hypergeometric test, SPIA, SP-GM and subpathwayMiner methods, the Student’s t-test was used to compute the gene differentially expressed level between CNA labels (CNAs versus non-CNAs). The genes with FDR < 0.05 in the t-test were inputted into these methods to identify statistically significant pathways or SPs.
We applied the above six methods to the HNSC datasets. As these methods use different strategies to calculate the statistically significant level of pathways, we took the top 10 most significant pathways to provide a general comparison and used the pathway level for analysis. Through comparison, CNA2Subpathway uniquely identified four pathways, fluid shear stress and atherosclerosis, HIF-1 signaling pathway, cGMP-PKG signaling pathway and pathways in cancers, which were simultaneously missed by the other five methods (Table 2). These pathways have been reported by the literature to be associated with HNSC. For example, Traci et al. have shown the effects of cGMP pathway activators on the growth and survival of HNSC cells [46]. Additionally, Hanneke et al. and Makoto et al. have shown that the HIF-1 signaling pathway was used as a novel molecular therapeutic target in HNSC [47, 48]. We further compared the results of CNA2Subpathway with the other five methods in BRCA, CESC, COAD, LUAD, LUSC, PAAD and STAD. We also found that several cancer-related pathways were uniquely identified by CNA2Subpathway in these cancers. The detailed results of the comparison for the above cancers are listed in Supplementary Table S3–S10. These results indicate that CNA2Subpathway which applies the SP crosstalk may reveal some new biological dysregulated SPs driven by CNAs.
Comparison of top 10 pathways identified by CNA2Subpathway, GSEA, hypergeometric test, SPIA, subpathway-GM, SubpathwayMiner in HNSC
| Pathway | CNA2Subpathway | Hypergeometric test | GSEA | SPIA | Subpathway-GM | SubpathwayMiner |
|---|---|---|---|---|---|---|
| Autophagy animal | √ | √ | √ | |||
| Fluid shear stress and atherosclerosis | √ | |||||
| Adipocytokine signaling pathway | √ | √ | √ | √ | ||
| mTOR signaling pathway | √ | √ | √ | √ | ||
| Longevity regulating pathway | √ | √ | ||||
| Apelin signaling pathway | √ | √ | ||||
| HIF-1 signaling pathway | √ | |||||
| Pancreatic cancer | √ | √ | ||||
| cGMP-PKG signaling pathway | √ | |||||
| Pathways in cancer | √ |
Discussion
CNAs drive tumor growth and evolution; however, the functional roles of CNAs across the genome are still poorly understood [49]. Many specific cancer-related genes with CNAs have been proposed to be associated with cancer outcomes [50]. Biological pathways reflect the key cellular mechanisms and biological functions, whose dysfunction plays some important roles in tumor occurrence, development and prognosis [2]. SPs are defined as local gene subregions within biological pathways. Compared with the original pathways, the SPs contain fewer components and reflect more specific biological functions. Therefore, determining the dysregulated SPs driven by CNAs in cancer is important to explore the pathogenesis of cancer and develop new drug targets. In the study, we propose a new network-based method, CNA2Subpathway, to identify dysregulated SPs by integrating CNAs, GE data and SP crosstalk network. CNA2Subpathway applied the network topology to calculate network centrality for each SP, which reflects the degree of SP abnormality. This method provides a novel way of SP analysis by using the SP interactions, which may uncover something new insight into the biological system.
We applied CNA2Subpathway to BRCA and HNSC data to evaluate the performance of the method. For the BRCA data, the SP path:00020_6 and path:05418_16 were the most significant dysregulated SPs, belong to the TCA cycle and fluid shear stress and atherosclerosis pathway, respectively. These two pathways are basic and important in the human body, and they have been regarded as breast cancer-related pathways recently [51, 52]. Moreover, the two SPs could be used as prognostic markers and are also found to be associated with cancer immune (Figure 3A–D). For the HNSC data, through comparison of survival analysis with all genes and genes with CNAs in the significant SP, an interesting discovery was that all genes in the SP are altered but not only the genes with CNAs. This indicates that the CNAs may not only influence their corresponding genes but also influence other genes in the SP through gene interaction and SP crosstalk. We also tested the proportional hazards assumption using the scaled Schoenfeld residuals when performing the Cox proportional hazards regression model. For the significant SPs in BRCA and HNSC data (SP path:00020_6 and path:05418_16 in BRCA, and SP path:04140_8 and path:05418_16 in HNSC), the risk scores of these SPs are mostly not statistically significant (P > 0.05) in Schoenfeld residuals test (Supplementary Figure S3A–D). Therefore, the Cox proportional hazards regression model can be applied to the risk scores of these SPs.
To assess whether the survival prediction ability of the SP risk scores independent of the other clinical characteristics (e.g. sex, age and clinical stage), multivariate Cox proportional hazard regression analysis was performed. The genes in the SP and the clinical characteristics, such as sex, age and clinical stage, were used as covariates. Thus, the gene weight was adjusted with the multivariate Cox proportional hazards regression coefficient. In the BRCA dataset, we recalculated the risks score for the SP path:00020_6 in the TCA cycle pathway and path:05418_16 in the fluid shear stress and atherosclerosis pathway with the adjusted gene weights. The results showed that the patients were classified into high-risk and low-risk groups (Supplementary Figure S4A-B; log-rank P = 2e-11 and 9e-16, respectively). In the HNSC dataset, the risk scores of the SP path:04140_8 in the autophagy pathway and path:05418_16 in the fluid shear stress and atherosclerosis pathway were also recalculated. Similar results were obtained (Supplementary Figure S4C-D; log-rank P = 1e-07 and 6e-11, respectively). These results indicate that the SP risk score was independent of the clinical characteristics of patients (e.g. sex, age and clinical stage).
We then applied CNA2Subpathway to other 18 cancers in TCGA, which include BLCA, CESC, COAD, ESCA GBM, KIRC, KIRP, LIHC, LUAD, LUSC, OV, PAAD, READ, SARC, SKCM, STAD, THYM and UCEC. The detailed information about the top 10 most significant SPs for each of the above cancer was shown in Supplementary Table S11. For each cancer, some cancer-related pathways have been identified. Through comparing the top 10 most significant SPs across the above cancers, we found that five SPs were overlapped in at least five cancers, including SP path:04066_3 in the HIF-1 signaling pathway, path:04140_8 in autophagy, path:04380_15 in Osteoclast differentiation, path:04915_13 in the estrogen signaling pathway and path:05418_16 in fluid shear stress and atherosclerosis (Supplementary Table S12). These SPs have been reported to play important roles in the progress of cancer in the published literature. For example, the HIF-1 signaling pathway has been found to be associated with breast cancer [53], head and neck squamous cell carcinoma [47] and lung squamous carcinoma [54]; the autophagy pathway are associated with bladder urothelial carcinoma [55], ovarian cancer [56], stomach adenocarcinoma [57], etc. The recurrent SPs across multiple cancers could be used as potential anti-cancer drug targets for drug repurposing.
To further validate the CNA2Subpathway method, we compared our results with five other pathway or SP analysis methods based on CNA and GE data. CNA2Subpathway uniquely identified four SPs that were simultaneously missed by the other five methods, which have been reported to be associated with the cancer process [46–48]. This indicates that the CNA2Subpathway method which applies SP crosstalk may uncover something new biological insights into underlying cancer.
Although the CNA2Subpathway method has realized the identification of specific dysregulated SPs driven by copy number variation in cancer, our method can be improved from the following aspects. The study of the impact of CNAs on GE in cancer is novel but not comprehensive and should be combined with other omics data, such as epigenomics. In the follow-up, we will use network information and other omics data to further improve our method. To provide the users with convenient analytical tools, CNA2Subpathway was developed into an available R package on GitHub (https://github.com/hanjunwei-lab/CNA2Subpathway). In the future, the CNA2Subpathway method will be developed as an online tool. In summary, our CNA2Subpathway method used SP crosstalk provides new ideas for pathway research in cancer and will be a new tool for the development of potential drug targets for cancer therapy.
Biological pathways are models containing the gene interaction networks that dictate disease states, drug response and altered cellular function. Subpathways defined as local gene subregions within a biological pathway reflect more specific and precision biological functions.
In the system biology level, the pathways are not isolated but interact with each other. In the study, CNA2Subpathway provides a novel way of subpathway analysis by applying the subpathway crosstalk.
CNA2Subpathway is developed to identify dysfunctional subpathways driven by somatic copy number alterations (CNAs) in cancer through integrating pathway topology information, multi-omics data and subpathway crosstalk network.
Funding
This work was supported in part by the National Natural Science Foundation of China (grant nos. 62072145, 81804158), the Natural Science Foundation of Heilongjiang Province (grant no. LH2019C042), the China Postdoctoral Science Foundation (grant nos. 2016M591566).
Conflict of Interest
None declared.
Yuqi Sheng is a master at the College of Bioinformatics Science and Technology, Harbin Medical University. Her research interest focuses on bioinformatics.
Ying Jiang is an associate professor at the College of Basic Medical Science, Heilongjiang University of Chinese Medicine. She is also a postdoctoral fellow at the traditional Chinese medicine research station, Heilongjiang University of Chinese Medicine. Her research interests focus on the molecular biology and cell biology of cancer.
Yang Yang is a master at the College of Bioinformatics Science and Technology, Harbin Medical University. Her research interest focuses on bioinformatics.
Xiangmei Li is a master at the College of Bioinformatics Science and Technology, Harbin Medical University. Her research interest focuses on bioinformatics.
Jiayue Qiu is a master at the College of Bioinformatics Science and Technology, Harbin Medical University. Her research interest focuses on computational system biology.
Jiashuo Wu is a master at the College of Bioinformatics Science and Technology, Harbin Medical University. His research interest focuses on computational system biology.
Liang Cheng is a professor and principal investigator at the College of Bioinformatics Science and Technology, Harbin Medical University. His research interest focuses on bioinformatics.
Junwei Han is a professor and principal investigator at the College of Bioinformatics Science and Technology, Harbin Medical University. His research interests focus on bioinformatics and computational system biology.
References
Author notes
Yuqi Sheng, Ying Jiang and Yang Yang authors contributed equally to this work.
