


Abstract
Topologically associated domains (TADs) are spatial and functional units of metazoan chromatin structure. Interpretation of the interplay between regulatory factors and chromatin structure within TADs is crucial to understand the spatial and temporal regulation of gene expression. However, a computational metric for the sensitive characterization of TAD regulatory landscape is lacking. Here, we present the spatial density of open chromatin (SDOC) metric as a quantitative measurement of intra-TAD chromatin state and structure. SDOC sensitively reflects epigenetic properties and gene transcriptional activity in TADs. During mouse T-cell development, we found that TADs with decreased SDOC are enriched in repressed developmental genes, and the joint effect of SDOC-decreasing and TAD clustering corresponds to the highest level of gene repression. In addition, we revealed a pervasive preference for TADs with similar SDOC to interact with each other, which may reflect the principle of chromatin organization.
Introduction
Topologically associated domains (TADs) comprise a series of square self-interacting domains, identified on contact maps derived from high-resolution chromosome conformation capture (Hi-C) [1–3]. The linear positions of TADs are conserved across cell types [1, 3], while intra-TAD chromatin state and structure can alter significantly, which underlie the regulation of key genes during cell differentiation [4–6] and reprogramming [7, 8]. Recent study showed that transformation of open chromatin into repressive state is often accompanied with the alteration of chromatin structure and plays important roles in gene silencing and cell fate commitment [9]. Despite the large variety of TAD-calling algorithms [10], a computational tool for the sensitive quantification of TAD repression is lacking, hindering the identification of TADs that undergo functional significant alteration over time. Here, we propose the spatial density of open chromatin (SDOC) which is a quantitative measurement of the degree of spatial aggregation of accessible regulatory elements within a TAD. SDOC enables the sensitive identification of TAD heterogeneity in terms of epigenetic modification strength and transcriptional activity. We performed SDOC simulation using multiple Hi-C and DNase-seq datasets and demonstrated that the simulated SDOC values are reliable for the identification of TAD variation in terms of histone modification, enhancer activity and gene transcription activity with higher sensitivity compared with existing metrics. Appling our metric to T-cell differentiation, we identified 302 SDOC-decreasing TADs, where key developmental genes are repressed and the degree of repression is related to the level of increase in TAD-TAD contact to other SDOC-decreasing TADs. Finally, we revealed a pervasive preference for TADs to interact with distal TADs that share similar SDOC in each developmental stage.
Results
Implementation of SDOC
We defined the SDOC as the ratio of the total number of accessible chromatin regions in a TAD to the entire 3D space taken up by the physical structure of the TAD. To demonstrate the power of SDOC in reflecting functional heterogeneity of TADs, we first performed comprehensive analysis based on the simulation of SDOC in various cell lines. These analyses were conducted using publicly available high-resolution Hi-C data provided by Rao et al. [11] and DNase-seq data downloaded from ENCODE [12]. TADs were detected from normalized Hi-C contact maps using the insulation score [13]. Chromatin structure of each TAD was simulated using the Pastis-PM2 method [14]. 3D coordinates of all loci in each TAD were used to calculate a convex hull whose volume was defined as the TAD volume (Figure 1A). Then, the raw SDOC was calculated by dividing the number of DNase-seq peaks in a given TAD by the TAD volume (Figure 1B). We performed quantile normalization to raw SDOC in four datasets (Figure S1). The distributions of normalized SDOC are subjected to normal distribution and thus are similar across different datasets (Figure S1A), which facilitate comparison between the SDOC of different datasets for the subsequent analysis. The expression level of genes in TADs of high normalized SDOC is similar to those of high raw SDOC, while normalized SDOC is more spread out for TADs with low SDOC (Figure S1C). In addition, we tested Pastis-MDS and Pastis-NMDS on the GM12878 Hi-C dataset at 10 kb resolution, and similar SDOC values were produced when these chromatin conformation reconstruction algorithms were used (Figure S1D).
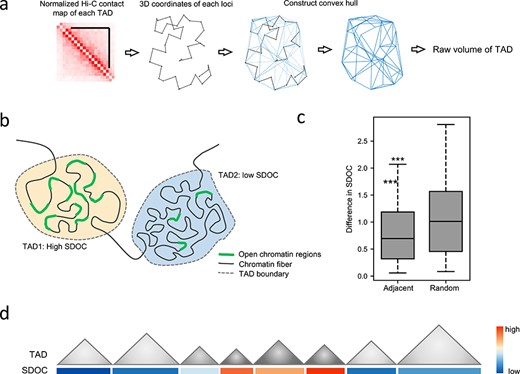
SDOC calculation and properties. (A) Schematic diagram of TAD volume calculation. (B) Illustration showing TADs with different SDOC levels. (C) SDOC differences between adjacent TADs and randomly selected TADs. Log-2 ratios for high SDOC and low SDOC levels are shown. ***P < 0.001, Welch’s t test. (D) Illustration showing the tendency for adjacent TADs to have similar SDOC levels.
We next investigated whether the reconstructed TAD structure and the simulated TAD volume reflect the properties of TADs including TAD length and interaction pattern within TADs on the GM12878 dataset at 10 kb resolution. We found that the volumes of TADs of shorter lengths (10–12 bins) are predominantly smaller than the volumes of TADs of intermediate length (20–24 bins). The results are similar when comparing TADs of intermediate length to those of longer lengths (40–48 bins) (Figure S2A). There is also a strong linear correlation between genomic lengths of TADs and volume of reconstructed TADs in all cell types we tested (Figure S2B). Therefore, simulated TAD volume indeed reflects TAD length. To investigate if the simulated structure and the corresponding volume of TADs reflect different interaction patterns of TADs, we performed analysis on GM12878 dataset at 10 kb resolution to demonstrate that different interaction patterns of TAD correspond to different TAD volumes. To do this, we first need to exclude the factor of TAD length in TAD volume. For each TAD length, if there are more than 5 TADs of this length, we did z-score normalization on the volumes of these TADs. Thus, the z-score normalized TAD volume represents the relative volume of a TAD compared with other TADs of the same length. We found that TADs with low z-score normalized volume (z score < −0.5) correspond to TADs with higher interaction frequency compared with those with high z-score normalized volume (z score > 0.5) (Figure S2C and D).
The volumes of TADs were implemented in SDOC to provide the spatial information of TADs that may be lost if using 1D or 2D features of TADs. To illustrate this, we created a new TAD that is simulated based on an existing TAD (chr1: 16 120 000–16 390 000) by reorganizing its Hi-C interaction counts while maintaining the sum of contact in each genomic distances of the original TAD (Figure S3A). Specifically, all contact counts of all cells in the contact matrix at each genomic distance were randomly reassigned to these cells. In this way, the interaction pattern is different between the original TAD and the simulated TAD, but the total sum of Hi-C contact in each genomic distance of the two TADs and the total sum of all Hi-C contact in the two TADs remains the same. We generated 100 simulated TADs by performing the simulation for 100 times. First, we calculated SDOC of the original TAD and simulated TADs based on the volume of 3D structure of TADs as described in this section. Then, we recalculated SDOC by replacing the 3D TAD volume to (i) the total sum of Hi-C contact counts within the TAD and (ii) the 1D TAD length, respectively. When the 3D structure of TADs was used, SDOC reflected the differences of the intra-TAD structure, and the SDOC value is different between the original TAD and simulated TADs (Figure S3B), whereas when using the 2D and 1D feature of the TADs, the SDOC values are equal between the original TAD and the simulated TADs (Figure S3C) and thus do not reflect the difference in the spatial structure.
To assess the degree that known critical factors of Hi-C data, including sequencing depth, resolution and different normalization methods may influence the SDOC value, we calculated SDOC on Hi-C data of lower coverage by downsampling the original Hi-C data of GM12878 cell line to 1/16 as described in recent studies [15, 16]. Correlation of SDOC calculated based on original Hi-C and downsampled Hi-C is above 0.99 (Figure S4A), showing relatively weak influence of sequencing depth on SDOC. We recalculated SDOC using Hi-C data of GM12878 cell line in 10, 25 and 50 kb resolution, respectively, and the correlation between SDOC in different datasets is all above 0.98 (Figure S4B–D), showing relatively weak influence of Hi-C data resolution on SDOC. We have added the comparison of two sets of SDOC calculated based on the Knight-Ruiz normalization and the Vanilla-Coverage method, respectively. The correlation of SDOC value is 0.98 (Figure S4E), which also showed relatively low influence on SDOC.
SDOC reflects genetic and epigenetic diversity of TADs
We calculated genome-wide SDOC in four cell types (GM12878, IMR90, K562 and HUVEC) to demonstrate the properties of the SDOC metric and its relationship to genetic, epigenetic characteristics and level of gene transcriptional activity of TADs. We believe that data for these four cell types are representative of typical high-resolution Hi-C data, as coverage differs significantly among them. To demonstrate that SDOC simulation can be conducted based on a wide range of Hi-C matrix binning sizes, we used 5, 10, 25 and 50 kb binning sizes for each cell type and generated a total of 16 SDOC datasets. SDOC values for linearly adjacent TADs are more similar than those of randomly selected TADs (results for the GM12878 cell line at 10 kb binning size are shown in Figure 1C), supporting a non-random distribution of SDOC throughout the genome, which may related to a larger scale of genome arrangement like A/B compartment (Figure 1D).
We used the SDOC dataset for the GM12878 cell line at 10 kb resolution to demonstrate the ability of SDOC to characterize the regulatory and functional properties of TADs. We categorized TADs into five groups based on preset cutoffs (−1.5 ×, −0.5 ×, 0.5 × and 1.5 × standard deviation of normalized SDOC). TADs in each group differed significantly in multiple features (Figures 2 and S5), showing that SDOC reflects various genetic and epigenetic properties of TADs. In each TAD group, the densities of H3K4me3 active histone modification marks and RNA-seq read scaled with SDOC, showing that TADs of high degree of SDOC correspond to actively transcribed regions [17]. SDOC is related to the density of Alu elements, TAD length, methylation level and H3K27me3 histone modification level (Figures 2A and S5A–C). TADs with higher SDOC levels contain more genes (Figure S5D) and more chromatin loops (Figure S5E) than did those with lower SDOC levels. The fractions of TADs in A compartment were also related to SDOC (Figure 2B). In addition, super-enhancers are significantly enriched in TADs group corresponding to the highest SDOC (Figure 2C). This is consistent in all four cell types (Figure S6). These observations show that SDOC reflects the heterogeneity of TADs in terms of variety of genetic and epigenetic properties and gene transcriptional activity.
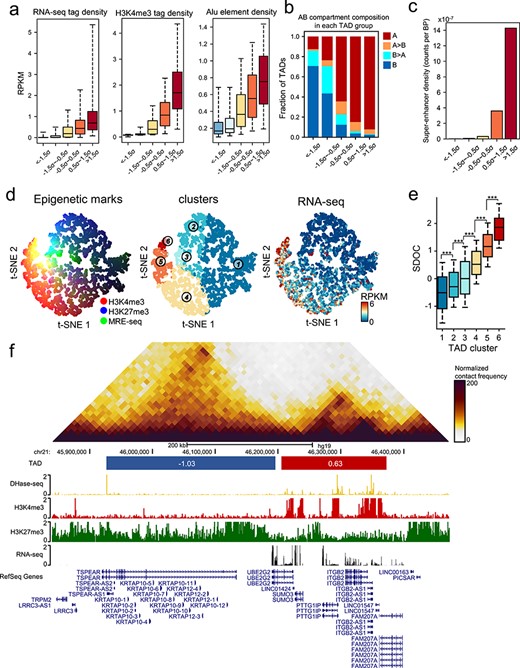
Properties of SDOC. (A) Genetic and epigenetic characteristics of different groups of TADs, defined by ascending SDOC. (B) Fraction of TADs with different compartment composition in different groups of TADs. Blue bars denote the fraction of TADs in compartment B. Cyan bars denote the fraction of TADs with mixed compartment (compartment B > 50% of TAD region). Orange bars denote the fraction of TADs with mixed compartment (compartment A ≥ 50% of TAD region). Red bars denote the fraction of TADs in compartment A. (C) Barplot showing the density of super-enhancers in each group of TADs. (D) Visualization of TADs using t-SNE. Left panel: Strength of red, green and blue corresponds to H3K4me3 ChIP-seq tag density, MRE-seq tag density and H3K27me3 ChIP-seq tag density in each TAD. Middle panel: TAD clusters. Right panel: RNA-seq tag density in each TAD. Clustering of TADs was performed using K-means based on four epigenetic features. The labels of the K-means TAD clusters has been renumbered according to the mean SDOC value in each cluster. (E) SDOC of TADs in K-means cluster. Significance: ***P < 0.001, t test. (F) An example of adjacent TADs with different SDOC.
To further illustrate that SDOC can be used to characterize TAD epigenetic states in detail, we clustered all TADs into six groups using k-means based on H3K4me3, H3K27me3 and MRE-seq read densities in reads per kilobase of exon model per million reads (RPKM) (Figure 2D). Each cluster corresponds to a different TAD epigenetic state (Figure S7). TADs were visualized in two dimensions based on their epigenetic features using t-SNE, with different colors representing different types of epigenetic mark and the strengths of colors corresponding to the epigenetic feature levels (Figure 2D). The variety of colors showed the diversity of TAD epigenetic states, supporting the function of TADs as regulatory units. We found that SDOC values differed significantly between all clusters (Figures 2E and S8), which further supports the ability of SDOC that characterizes different epigenetic states.
Benchmarking of SDOC
We next benchmark the sensitivity of SDOC in reflecting heterogeneity of gene transcriptional activity within TADs. Several studies have shown that the D score, a quantitative parameter reflecting the degree of intra-TAD connectivity, is relevant to transcriptional activity within TADs [5, 7, 18]. The D score was defined as the ratio of intra-TAD contacts to all cis contacts. The aggregation preference (AP) was defined based on aggregation patterns of significant interactions on Hi-C contact maps; this parameter has been shown to be related significantly to epigenetic and functional properties of TADs [19]. We compared the capability of the D score, AP and SDOC to sensitively reflect the levels of transcriptional activity within TADs, and found that SDOC showed the strongest correlations (P-value < 10−300 for all SDOC datasets) in multiple cell types and at various Hi-C resolutions (Figure 3A). SDOC also surpassed the D score and AP value in terms of their correlation to difference in gene expression level between different cell types (Figure 3B). Overall, D score corresponds to higher correlation compared with AP and lower correlation compared with SDOC. We also performed these analyses to examine the performance of SDOC using 1D and 2D features of TADs as in Figure S3. The results showed that SDOC with the use of 1D, 2D and 3D features is all higher in the correlation to gene expression level compared with D score and AP (Figure S9). We also noticed that SDOC calculated using 2D features of TADs corresponds to slightly lower correlation compared with SDOC with the use of 1D or 3D features of TADs (Figure S9). In addition, SDOC with the use of 1D and 3D features of TADs showed comparable correlation (Figure S9). All Spearman correlation coefficients shown in Figures 3 and S9 are presented in Table S1. To determine whether the alteration of TADs identified by SDOC but not by D score represents functional significant changes within TADs, we selected genes with expression alteration that accompanied with unilateral increase in SDOC or in D score, respectively, for gene ontology (GO) analysis to check for cell-type-related functional enrichment. As expected, we found that there were more genes that showed coherent increase in gene expression level and in SDOC than genes with coherent increase in gene expression and in D score in most combination of datasets (Figure S10A). We then performed GO analysis to each of these gene groups. As cell function for GM12878 and HUVEC is distinctive and thus readily anticipated, we focused on gene expression increase in these two cell types as proof of concept. As expected, we found that genes with coherently increased SDOC and expression level while with decreased D score are enriched in cell-type-related functional terms (Figure S10B). For example, when comparing GM12878 to IMR90, we identified genes with functional enrichment in ‘regulation of lymphocyte activation’. When comparing HUVEC to GM12878, we identified genes with functional enrichment in ‘tube development’. On the contrary, fewer functional enrichment terms for genes with coherent increase in D score and expression level were identified if there was any. Finally, to assess the potential effect of different TAD detection algorithms, we calculated SDOC, D score and AP values using TADs detected by different TAD detection methods including insulation score, Arrowhead [11], directionality index [1] and OnTAD [20]. We found that SDOC was the most robust against different TAD-calling methods and different layers of hierarchical TADs detected by OnTAD (Figure S10C). These results show that SDOC can reflect the transcriptional activity level of TADs more sensitively than existing methods and is least affected by the use of different TAD detection methods.
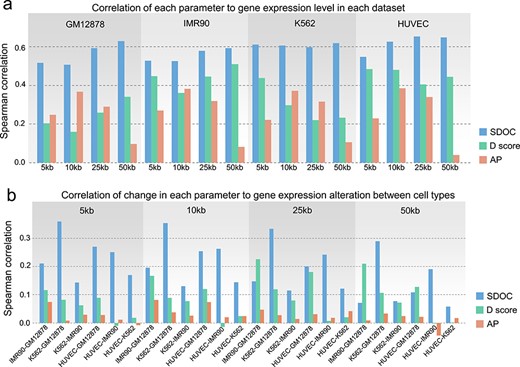
SDOC is more sensitive in reflecting heterogeneity and alteration of gene activity in TADs than previous methods. (A) Correlations of SDOC values, D scores and AP values with the mean normalized expression of genes in each TAD. (B) Correlations of differences in SDOC values, D scores and AP values with gene expression differences in each TAD between different cell types.
SDOC identifies TADs undergoing functional significant alteration during T-cell differentiation
SDOC is a sensitive measure of intra-TAD chromatin state and structure, we demonstrate that the use of SDOC facilitates the identification of functional relevant alteration of TADs during T-cell differentiation. We identified a total of 4186 TAD boundaries from the eight developmental stages. We calculated SDOC of TADs in all eight developmental stages from HSPCs to T cells and sorted the TADs by the standard deviation of their SDOCs across all stages from low to high, and the standard deviation showed a sharp increase starting from 0.3 (Figure 4A). Thus, we used 0.3 as empirical cutoff to select TADs with altered SDOC during eight development stages and identified 574 TADs with altered SDOC (Figure 4A). Unsupervised clustering using SDOC of these TADs identifies a cluster which is comprised of 302 TADs with decreasing SDOC during differentiation (Figure 4A). As expected, gene expressions in these SDOC-decreasing TADs are significantly down-regulated before and after the DN2-to-DN3 transition which is associated with T lineage commitment (Figure S11A). Another cluster comprising 177 TADs with increasing SDOC corresponds to genes that are up-regulated before and after the DN2-to-DN3 transition (Figure S11B). GO analysis of genes located within SDOC-decreasing TADs shows functional enrichment of development process of lineages other than T-cell, for instance, ‘nervous system development’ (Figure 4B), indicating that the silencing of these genes may reinforces cell differentiation into the T-cell lineage.
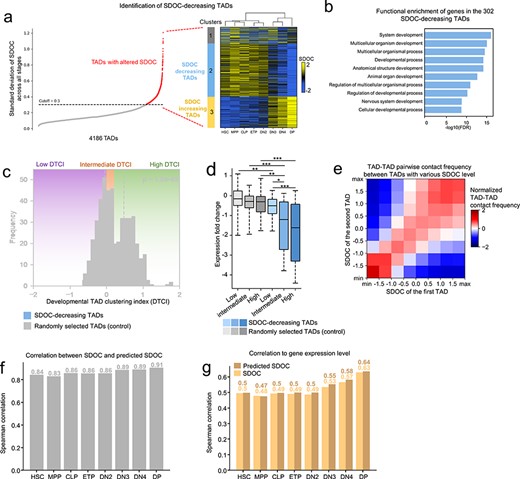
Identification of repressive TAD clusters during T-cell lineage development. (A) Selection of 302 SDOC-decreasing TADs. Left panel: TADs with altered SDOC were first selected by a cutoff of SDOC standard deviation across all developmental stages. Right panel: Heatmap showing the result of unsupervised clustering based on SDOC which identified SDOC-decreasing TADs among the TADs with altered SDOC. Cluster tree shows that the eight development stages were separated to pre- and post-DN2-DN3 stages by unsupervised clustering. (B) Functional enrichment of genes in SDOC-decreasing TADs. (C) Histogram showing difference in DTCI distribution between SDOC-decreasing TADs and random TADs. DTCI groups: ‘low’: DTCI ≤ 0 (violet background), ‘intermediate’: 0 < DTCI < 0.25 (orange background) and ‘high’: DTCI ≥ 0.25 (green background). Black dashed line indicates the median of TCIs for Random TADs. Blue dashed line indicates the median of SDOC-decreasing TADs. Significance: P < 1.5 × 10−45, Kolmogorov–Smirnov test. (D) Boxplot showing expression fold change (DP versus HSC) for each group of TADs. DTCI groups are marked at the x-axis. Significance: *P < 0.05, **P < 0.01, ***P < 0.001, t test. (E) Heatmap showing mean normalized contact frequency between TADs from various SDOC range. (F) Correlation between SDOC and predicted SDOC at the eight developmental stages. (G) Comparison between (i) spearman correlation of SDOC and mean gene expression of TADs and (ii) spearman correlation of predicted SDOC and expression of TADs.
SDOC reveals a synchronization on chromatin environment between local and spatially adjacent TADs
We assume that the SDOC change during T-cell differentiation may also reflect global structural rearrangement of these TADs. We first checked the composition of A/B compartment in each of the 302 SDOC-decreasing TADs. A majority of TADs are located completely within the active A compartment at hematopoietic stem cells (HSCs) stage (196 out of 302, Figure S12A). We found a minor but statistically significant decrease in the number of these TADs that completely located within the active A compartment before and after the double-negative stage 2 (DN2)-to-DN3 transition (P = 0.009, t test, Figure S12A), and more than half of the SDOC-decreasing TADs are still in the A compartment at double-positive (DP) stage (161 out of 302). Hu et al. identified 488 genes that are located in regions exhibiting A-to-B compartment flipping. We found that only a small fraction of these genes are located in the SDOC-decreasing TADs (Figure S12B). Thus, SDOC alteration and compartment flipping reflect associated and different aspect of chromatin reorganization during T-cell differentiation. We then investigated the relative position among SDOC-decreasing TADs based on normalized pairwise contact frequency between intra-chromosomal TAD pairs. Given a group of TADs, we defined developmental TAD clustering index (DTCI) of a TAD in the group to measure the alteration in the pairwise contact frequencies between it and other TADs in the group throughout the eight T-cell developmental stages (see Methods). A TAD of high degree of DTCI indicates an increased spatial proximity to other TADs in the group throughout the differentiation process. We randomly selected 302 TADs as control and calculated DTCI for SDOC-decreasing TADs and for the control group separately, and found that the SDOC-decreasing TADs correspond to higher DTCI (Figure 4C). Therefore, they are prone to increased TAD-TAD contact compared with other TADs, suggesting that SDOC-decreasing TADs tend to be spatially aggregating with each other during T-cell development. We further categorized TADs into ‘low’, ‘intermediate’ and ‘high’ groups based on their DTCI to assess the impact of DTCI to gene silencing. In all three groups, SDOC-decreasing TADs correspond to higher degree of gene silencing compared with randomly selected TADs. Interestingly, although higher DTCI tend to be associated with a higher degree of repression for both SDOC-decreasing TADs and control, TADs with ‘high’ DTCI in the control group correspond to weaker repression compared with SDOC-decreasing TADs with ‘intermediate’ DTCI (Figure 4D). These results suggest that the joint effect of spatial aggregation and decreased SDOC level may underlie the most prominent gene silencing events compared with unilateral change. We further performed the same analysis on SDOC-increasing TADs and we found that, although statistically significant, DTCI of SDOC-increasing TADs was only slightly higher than randomly selected TADs (Figure S13A). In addition, unlike SDOC-decreasing TADs, expression alteration of genes in ‘high’ DTCI group of SDOC-increasing TADs was not significantly higher than genes in ‘low’ and ‘intermediate’ DTCI groups (Figure S13B). Therefore, the clustering of SDOC-increasing TADs during eight T cell development stages was not as prominent as the clustering of SDOC-decreasing TADs, and the relationship between TAD clustering and gene expression was also not observed in SDOC-increasing TAD.
We assume that the clustering of SDOC-decreasing TADs may reflect a pervasive spatial affinity among TADs with similar SDOC at various SDOC level during T cell differentiation. Indeed, chromatin contacts between TADs with similar SDOC are stronger than those between TADs with more divergent SDOC in DP (Figure 4E). This trend is consistent at each developmental stage and at each SDOC level. These results support the connection between local and global chromatin environments. To assess the extent to which local chromatin environment is associated with global chromatin structure, we predicted the SDOC for each TAD based on SDOC of other distal TADs (genomic distance >2 Mb) that tend to be close in 3D based on normalized TAD-TAD pairwise contact in the eight developmental stages (see Methods). We found that the predicted SDOC is strongly correlated to original SDOC as the correlation coefficients are above 0.8 for all stages and reached 0.91 for the DP stage (Figure 4F). This result suggests that the chromatin state and the structure of a TAD could be sufficiently recuperated from other TADs with preferential contact to it. We next assessed if the predicted SDOC, with such high similarity, is as strongly related to transcriptional activity as the original SDOC. The results showed that the predicted SDOC is also highly correlated to mean expression level of TADs, even with a slightly higher correlation coefficient in most developmental stages compared with the original SDOC (Figure 4G). We further asked if SDOC of linearly adjacent TADs is more predictive to the SDOC of preferentially interacting distal TADs. Correlation between original SDOC and predicted SDOC is higher than correlation between original SDOC and average SDOC of two linearly adjacent TADs, even when only one of the TAD in the two adjacent TADs with a closer SDOC is selected (Figure S14A). SDOC of linearly adjacent TADs is also less correlated with gene expression compared with the predicted SDOC (Figure S14B). Altogether, these results suggest a pervasive similarity in chromatin state among preferentially interacted non-contiguous TADs, to the extent that the intra-TAD chromatin state and the structure can be sufficiently recuperated from those of other ‘spatially neighboring’ TADs.
Discussion
We provide SDOC as a quantitative and sensitive measure of intra-TAD chromatin state and structure. Our metric integrates information of both 1D chromatin state and 3D chromatin structure and is closely related to histone modification and gene activity. Decreased SDOC in a subset of TADs during mouse T-cell differentiation is accompanied with spatial aggregation of these TADs, which correspond to silencing of key genes. While decreased SDOC alone is associated with decreased gene expression, the increased spatial contact between these TADs leads to a significantly higher level of repression. Therefore, the interplay between intra- and inter-TAD chromatin state and structure may play a significant regulatory role in T-cell development. We show that TADs with similar SDOC levels tend to be more frequently connected at all SDOC level, suggesting that the chromatin state and the structure of a TAD are strongly related to its chromatin environment. Supporting this, we showed that the SDOC of a TAD can be well predicted based on the SDOC of other ‘spatially adjacent’ TADs. We believe that this preferential clustering that bridges TADs with similar SDOC supports a well-organized chromatin structural landscape that underlies efficient regulation of gene expression.
A recent study revealed that strongly connected TADs form TAD cliques associated with lamina-associated domains and gene repression. Although TAD cliques are enriched in the repressive B compartment, many TADs in TAD cliques are located within A compartment. Using SDOC, we showed that the existence of TAD clique in both compartments is consistent with the tendency of TADs to preferentially contact with other TADs with similar SDOC at all SDOC levels. The enrichment of TAD cliques in B compartment also corresponds to an overall higher TAD-TAD contact frequency observed between low SDOC TADs compared with TADs with higher SDOC level. It is interesting to investigate the mechanisms supporting preferential contact between TADs with similar SDOC, which may also underlie TAD clique formation and the formation of global landscape of chromatin structure.
In conclusion, we proposed SDOC as a quantitative measure of chromatin state and structure of TADs. SDOC is strongly associated with a variety of genetic and epigenetic properties of TADs and is more sensitive than existing method in reflecting gene transcriptional activity. Applying SDOC, we identified a subset of TADs associated with silencing of key genes in T-cell differentiation. Spatial clustering of these TADs is more significant than other TADs, which enhanced the degree of gene repression. In addition, we found that SDOC can be better predicted by preferential interacted distal TADs than by linearly adjacent TADs, showing a strong connection between intra-TAD chromatin state and inter-TAD positioning in nucleus.
The current method of using convex hull for TAD volume approximation is a preliminary attempt and a more advanced computational method may enable more accurate volume approximation. In addition, as the structure of TADs is complex and displays cell-to-cell heterogeneity, modeling TAD structure using data of higher resolution generated by experiment protocol such as Micro-C, or single cell Hi-C data that reflect cell-to-cell variability in chromosome structure may go a long way towards a more accurate TAD structure simulation and further improves the performance of the SDOC metric. We believe SDOC will facilitate future research in deciphering functional changes of chromatin organization in 4D.
Methods
Hi-C data processing
We used Hi-C data for four human cell lines (GM12878, IMR90, K562 and HUVEC; GEO accession number GSE63525) from Rao et al. [11]. Raw Hi-C contact matrix files (in sparse matrix format) were provided directly and were used to construct raw Hi-C contact matrices at four resolutions: 5, 10, 25 and 50 kb. The matrices were corrected using KR normalization factor [21] files provided together with the Hi-C data. Specifically, the raw contact frequencies at the ith and jth loci were divided by the product of the ith and jth lines in the KR normalization factor files.
Hi-C data of mouse T-cell developmental stages were converted to .fastq format using fastq-dump command of SRAtoolkit. Alignment to mouse mm9 genome was performed using Bowtie2. Quality control and creation of Hi-C pair-end tag directory were performed using the makeTagDirectory command of HOMER software. Hi-C contact maps were created using analysisHiC command of HOMER software. Replicates were pooled to increase coverage for each developmental stage. Our analyses are based on human genome assembly GRCh37/hg19.
Detection of contact domains
TADs were detected using the insulation score [13]. The width of the window used when calculating insulation scores was set to five times the Hi-C matrix binning size to better accommodate boundary detection at different resolutions. We computed the delta score using the insulation scores for the five nearest upstream and five nearest downstream loci. We identified TADs as genome regions centered between two adjacent boundaries and excluded regions containing low coverage bins. Data on contact domains detected by Arrowhead [11] at 5 kb resolution were downloaded from GEO accession number GSE63525.
In data analyses in T cell differentiation, a reference set of TADs was used in all development stages. First, TADs detected in all development stages were pooled. Then, adjacent boundaries were merged, and the position of the merged TAD boundary was assigned to one of these genomic regions where the boundaries of the most development stages were located. Boundaries supported by only one development stage were excluded to minimize false positives.
SDOC calculation
Each intra-TAD contact matrix was extracted from normalized Hi-C contact maps as input data for a chromatin conformation reconstruction algorithm. We used the Pastis-PM2 algorithm [14] to reconstruct chromatin structure. Three-dimensional (3D) coordinates of all loci in individual TADs were calculated using Pastis-PM2 with default parameters. These coordinates represented simulated chromatin structures within the TAD and were used to construct the convex hull of each TAD using in-house python scripts (provided in Supplementary Data). The volume of each convex hull was calculated as the raw volume of the TAD. The raw SDOC was calculated as the ratio of open chromatin peaks (total number of DNase-seq peaks in each TAD region) to the raw TAD volume. The number of total DNase-seq peak counts may increase or decrease as sequencing depth changed or different peak-calling algorithms were used. We assume that this effect may generally influence all TADs as a multiplicative noise and can be normalized by performing quantile normalization. Quantile normalization was performed to raw SDOC using the preprocessCore package of R to normalize the SDOC value of each dataset to Gaussian distribution (mean = 0, standard deviation = 1).
Visualization of TADs using t-distributed stochastic neighbor embedding
All TADs were visualized using t-distributed stochastic neighbor embedding (t-SNE) [22]. Each point in the t-SNE plot represents a TAD which was embedded on the 2D space based on four epigenetic features of each TAD: chromatin accessibility level (DNase-seq tag density), H3K4me3 level, H3K27me3 level (ChIP-seq tag density) and methylation level (MRE-seq tag density), where the tag density of each feature was calculated using RPKM normalization method. H3K4me3 modification level, H3K27me3 modification level and MRE-seq tag density of each TAD were marked by the strengths of the red, blue and green color of the corresponding point, respectively. For example, a red dot represents a TAD with strong H3K4me3 modification but very weak H3K27me3 modification and low density of unmethylated PcG islands. T-SNE was performed using t-SNE function of Python scikit-learn library.
Assessment of SDOC metric performance
Based on normalized Hi-C contact maps, we calculated a D score [5, 7, 18] for each TAD by dividing the number of intra-TAD contacts by the total number of intra-chromosomal contacts involving the genome region of the TAD. The gene expression level for each TAD was calculated as the average TPM of all genes in the TAD. The AP [19] was calculated using TADLib-0.3.1 [19] with default parameters. An SDOC value, a D score and an AP value were assigned to all genes with TSSs located within each TAD. These values were used to examine correlations between changes therein and gene expression levels.
As the datasets we downloaded contained Arrowhead-detected TADs at a 5 kb binning size, we performed the comparison with different TAD-detecting algorithms at 5 kb resolution. When two different sets of detected TADs were compared, all 5 kb genomic regions located within TADs of both sets were assigned the SDOC/D score/AP values of the corresponding TAD. Spearman correlation of assigned values of each metric (SDOC, D score and AP) in all shared genomic regions was then calculated and was used to assess the influence of different TAD detection method.
Calculation of normalized pairwise TAD-TAD contact
Grouping TADs based on DTCI
Given a group of TADs, DTCI of each TAD reflects the propensity of it to be more (positive DTCI) or less (negative DTCI) spatially aggregated with other TADs in the group during T cell differentiation. All combinations of two TADs within this group and were in the same chromosome were selected to calculate a linear regression slope that measures the degree of alteration in their normalized pairwise TAD-TAD contact frequency throughout the eight developmental stages. When performing the linear regression, we considered each developmental stage as evenly spaced integers 0, 1, …, 6, 7 in the order of T cell differentiation: HSC, MPP, CLP, ETP, DN2, DN3, DN4 and DP. Linear regression was performed using LinearRegression function in scikit-learn python package. For each TAD, the DTCI is the averaged slope of all TAD pairs in the group of TADs that are associated with this TAD. DTCI is calculated separately in SDOC-decreasing TADs and in random TADs. TADs are categorized into three groups based on their DTCI: ‘low’: DTCI ≤ 0, ‘intermediate’: 0 < DTCI < 0.25 and ‘high’: DTCI ≥ 0.25.
Unsupervised clustering
Unsupervised clustering of the 574 TADs with altered SDOC was performed using the KMeans function of Scikit-learn python package with the following parameters: n_clusters = 3 the SDOC of each TAD in all developmental stages.
Predicting SDOC based on preferentially interacted TADs
GO analysis
GO analysis was performed using the PANTHER web-based platform at http://geneontology.org/
Data availability
Human gene expression (polyA RNA-seq) data were downloaded from ENCODE under accession numbers ENCSR000COQ (GM12878), ENCSR000CTQ (IMR-90), ENCSR000CPH (K562) and ENCSR000COZ (HUVEC).
Data of super-enhancers in the GM12878, IMR90, K562 and HUVEC cell lines were downloaded from https://www.cell.com/cell/fulltext/S0092-8674(13)01227-0
Hi-C data including raw Hi-C contact matrix files, normalization vector files, TADs detected using Arrowhead and annotations of chromatin loops for human cell lines (GM12878, IMR90, K562 and HUVEC) were downloaded from GEO dataset GSE63525.
ChIP-seq, DNase-seq, total RNA-seq and MRE-seq data for the human GM12878 and IMR90 cell lines were downloaded from ENCODE under accession numbers ENCSR000DRY (GM12878 H3K4me3 ChIP-seq), ENCSR000DRX (GM12878 H3K27me3 ChIP-seq), ENCSR000EMT (GM12878 DNase-seq), ENCSR000AEE (GM12878 total RNA-seq) and ENCSR398TCH (GM12878 MRE-seq). DNase-seq peaks, compartment PC1 value and Hi-C data are downloaded from GEO dataset GSE74222. Code and related data for reproducing main results in this study have been uploaded to the GitHub repository (https://github.com/birmjiangs/Code-for-main-results).
Authors’ contributions
J.S., C.H. and B.X. proposed the method; J.S., C.Y., C.H. and B.X. designed the research. J.S. prepared the data. J.S. analyzed the data and wrote the manuscript with input from all authors. All authors read and approved the final manuscript.
We proposed SDOC, a quantitative measurement for chromatin state and structure of TADs, with higher sensitivity and robustness compared with previous methods.
Appling SDOC, we identified 302 TADs with repressive structural alteration that underlie silencing of key genes to reinforce differentiation to T cell lineage, and we found that the most prominent gene repression was associated with spatial clustering of a subset of these TADs.
We revealed a propensity of TADs with similar SDOC to be spatially adjacent in 3D as an organization principle of spatial positioning of TADs in mammalian nucleus.
Funding
National Natural Science Foundation of China (nos 31801112, 61873276); Beijing Nova Program of Science and Technology (no. Z191100001119064).
