


Abstract
Increasing use of therapeutic peptides for treating cancer has received considerable attention of the scientific community in the recent years. The present study describes the in silico model developed for predicting and designing anticancer peptides (ACPs). ACPs residue composition analysis show the preference of A, F, K, L and W. Positional preference analysis revealed that residues A, F and K are favored at N-terminus and residues L and K are preferred at C-terminus. Motif analysis revealed the presence of motifs like LAKLA, AKLAK, FAKL and LAKL in ACPs. Machine learning models were developed using various input features and implementing different machine learning classifiers on two datasets main and alternate dataset. In the case of main dataset, dipeptide composition based ETree classifier model achieved maximum Matthews correlation coefficient (MCC) of 0.51 and 0.83 area under receiver operating characteristics (AUROC) on the training dataset. In the case of alternate dataset, amino acid composition based ETree classifier performed best and achieved the highest MCC of 0.80 and AUROC of 0.97 on the training dataset. Five-fold cross-validation technique was implemented for model training and testing, and their performance was also evaluated on the validation dataset. Best models were implemented in the webserver AntiCP 2.0, which is freely available at https://webs.iiitd.edu.in/raghava/anticp2/. The webserver is compatible with multiple screens such as iPhone, iPad, laptop and android phones. The standalone version of the software is available at GitHub; docker-based container also developed.
Introduction
Cancer is the second most dangerous disease, leading to deaths globally, after cardiovascular diseases. According to WHO report, in 2017, 9.56 million people died prematurely due to cancer, worldwide, which states that every sixth person dying in the world is because of cancer. The detection of cancer at an early stage is one of the major challenges. If the cancer is diagnosed at an early stage, then there are higher possibilities of surviving and less morbidity. However, the lack of early diagnosis of cancer is one of the major barriers in treating the patients [1]. Due to the inadequacy of accurate and non-invasive markers, the detection of cancer is usually biased [2]. Recent advancements in the field of genomics and proteomics have led to the discovery of peptide-based biomarkers, which has enhanced the detection of cancer at an early stage [3]. After diagnosing cancer, the next step involves its treatment. Currently, chemotherapy, radiation therapy, hormonal therapy and surgery are the conventional treatments available for treating cancer. Adverse side effects and high cost of these conventional methods are the obstacles for effective treatment [4], and even if the treatment is successful, then there are the chances of reoccurrence of cancer [5], which indicates towards the need of better and more effective treatment. In the past few years, peptide-based therapy has emanated as an advanced and novel strategy for treating cancer [6]. It has several advantages like high target specificity, good efficacy, easily synthesized, low toxicity, easily modified chemically [7], less immunogenic when compared to recombinant antibodies [8]. In recent years, therapeutic peptides have appeared as a diagnostic tool and have the ability to treat many diseases [9–14]. More than 7000 natural peptides have been reported in the last decade, which exhibit multiple bioactivities (antifungal, antiviral, antibacterial, anticancer, tumor-homing, etc.) [15]. As per the report, more than 60 drugs have been approved by the FDA, and >500 are under clinical trials [16].
Anticancer peptides (ACPs) are part of the antimicrobial peptide (AMP) group that exhibits anticancer activity. These are small peptides (5–50 amino acids) and cationic in nature. Mostly they possess α-helix as the secondary structure (e.g. LL-37, BMAP-27, BMAP-28, Cercopin A, etc.) or folds into β-sheet (e.g. Lactoferrin, Defensins, etc.). Some peptides have shown extended linear structure such as Tritrpticin and Indolicidin [17, 18]. Cancer cell exhibits different properties in comparison to normal cells. Cancer cells possess larger surface area due to presence of a higher number of microvilli, negatively charged cell membrane, higher fluidity of membrane, etc. [19–21]. These features allow cationic ACPs to interact with the negatively charged membrane via electrostatic interactions ultimately leading to necrosis, i.e. selective killing of cancer cells [22]. Other means by which ACPs exhibit its function includes lysing of mitochondrial membrane (apoptosis), inhibiting angiogenesis pathway or recruiting other immune cells for attacking cancer cells, and activating essential proteins which ultimately lyse cancer cells [23]. Different mechanism of ACP function is shown in Figure 1. In order to explore the novel therapeutic ACPs mechanism of action and development, accurate prediction of ACPs is very essential. As the experimental process is time consuming, labor intensive and costly, there is need for computational tools to do the same. In past, many sequence-based methods have been proposed for predicting and designing ACPs. Some of the popular methods include AntiCP [24], iACP [25], ACPP [26], iACP-GAEnsC [27], MLACP [28], SAP [29], TargetACP [30], ACPred [15], ACP-DL [31], ACPred-FL [32], PTPD [33], Hajisharifi et al.’s method [34], Li and Wang’s method [35], ACPred-Fuse [36] and PEPred-Suite [37]. Detail information for most of these methods is provided in an article by Schaduangrat et al. [15].
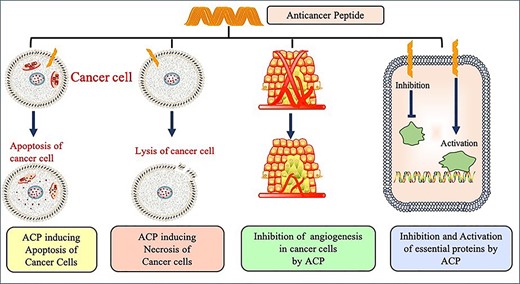
Various mechanism of action of ACPs.
However, there are certain limitations associated with the methods mentioned above. The major limitation includes the selection of dataset both quality and quantity wise for developing the respective methods. This creates a challenging situation for an experimental scientist in selecting the method and the feature for the prediction study. In addition, some of the methods such as iACP-GAEnsC and TargetACP do not provide webserver facility, hence, limiting the utility of these methods for biologists. The other important drawback of the above mentioned methods is their inability to discriminate peptides having similar composition but different activity. Aforementioned issues motivated us to come up with a method that addresses the above mentioned limitations. This manuscript describes a method AntiCP 2.0 developed for predicting ACPs with high precision.
Materials and methods
Datasets preparation
In this study, we created datasets called main and alternate datasets. ACPs were obtained from datasets of previous studies that include ACP-DL, ACPP, ACPred-FL, AntiCP and iACP. In addition, ACPs were also extracted from ACP database CancerPPD [38]. After removing small, long, identical and non-natural peptides, we got 970 unique ACPs having 4 or more residues and 50 or fewer residues. These 970 ACPs were used for creating the following two datasets
(i) Main dataset: In the main dataset, experimentally validated ACPs are taken as positive class and AMPs as non-ACPs or negative class. We obtained AMPs from datasets of previous studies like ACP-DL, ACPP, ACPred-FL, AntiCP and iACP, which did not show any anticancer properties. After removing all peptides having both anticancer and antimicrobial properties, we got 861 peptides. In summary, our main dataset contains 861 experimentally validated ACPs and 861 non-ACPs (or AMPs).
(ii) Alternate dataset: This dataset has anticancer and random peptides; here, we assume that random peptides are non-ACPs. In order to obtain random peptides, we generated random peptides from protein in SwissProt [39, 40]. To create a balanced dataset, we picked 970 random peptides and assigned them as non-ACPs. In simple words, our alternate dataset contains 970 experimentally validated ACPs and 970 non-ACPs (or random peptides).
Internal and external validations
The datasets were partitioned into two parts randomly. The first part, i.e. training dataset, comprises of 80% data, and the second part, i.e. validation dataset comprises remaining 20% data. In case of internal validation, we developed prediction models and evaluated them using 5-fold cross validation technique. In this particular technique, sequences are divided randomly into five parts. Among these five parts, any four parts are used for training and the fifth one is used for testing purposes. The above-mentioned process is repeated five times till each of the five parts is used at least once for testing. In the end, final result is computed by averaging the performance of all five sets. In case of external validation, we evaluated the performance of the model (developed using training dataset) on validation dataset [39–41].
MERCI motifs analysis
MERCI (Motif-EmeRging and with Classes-Identification) software [41] was used for searching the motifs exclusively present in ACPs. Software was run on default parameters. Motif analysis renders the information related to various kind of patterns, which could be present in the ACPs. Default parameters were used for running the MERCI code.
Features for prediction
In order to develop any prediction or classification model, one needs to generate feature for each peptide. In this study, we created and used wide range of features for developing machine learning technique based models that includes composition and binary profile based features. Following is brief description of protocols used for creating different type of features.
Amino acid composition
Dipeptide composition
Terminus composition
We have also computed both the composition (amino acid and dipeptide) for 5, 10 and 15 residues present at N- and C-terminus of the protein/peptide. We have also combined the terminal residues like N5C5, N10C10 and N15C15 and then again computed the composition.
Binary profile
One of the major advantages of binary profile is it provide order of residues in a peptide, which is not possible with composition-based features. Thus, binary profile can also discriminate compositionally similar but functionally different peptides [39, 40]. Since the length of peptides used in this study is variable, it is challenging to generate a fixed-length pattern. To overcome this, and for generating fixed length binary profile, we have extracted the segments of fixed-length from either terminus (N-terminus or C-terminus) [42]. After computing the fixed-length patterns, we have generated the binary profiles for the residues of both the terminus, i.e. N5, N10, N15, C5, C10, C15 and similarly for combined terminal residues N5C5, N10C10 and N15C15.
Hybrid features
In the previous studies, it has been shown that hybrid features improve prediction accuracy and provides better and biologically reliable predictions [43, 44]. In our study, too, we developed two types of SVM-based models using hybrid features. In the first category, we integrated binary profile information of the peptide along with its composition (amino acid and dipeptide). This will maintain both the compositional as well as residue order information of the peptide. In the second category, we used motif information along with amino acid and DPC information. MERCI software was used to extract motifs from the peptides. Motifs were extracted only form the training dataset and not the validation datasets. To predict a given sequence as ACP or non-ACP, we added +1 or −1 in the SVM score if the motif is present in the given sequence from the ACP or non-ACP, respectively.
Machine learning techniques
Number of machine learning techniques has been implemented in this study using Python library scikit-learn [45] and SVM light [46]. Scikit-learn is a python library that allows to develop models using different machine learning techniques. Here, we used six machine learning classifiers from this package namely support vector machine (SVM), random forest (RF), k-nearest neighbors (KNN), extra trees (ETree), artificial neural network (ANN) and ridge classifier. Different parameters present in these classifiers was tuned during the run and reported the results achieved on the best parameters.
Performance measure
Result
In order to understand properties of ACPs, different types of analysis were performed such as composition analysis, residue preference analysis and exclusive motifs present in the peptides. All these analysis were performed on the main dataset.
Compositional analysis
Firstly, percent AAC of ACPs and non-ACPs was computed. Secondly, percent composition of ACPs and non-ACPs were compared to identify type of residues preferred in ACPs. In addition, we also compute percent AAC of proteins in SwissProt. The percent AAC of ACPs, non-ACPs and SwissProt proteins is shown by bar graph in Figure 2. It was observed that residues like A, F, K, L and W are more abundant in ACPs (Figure 2). It was also observed that non-ACPs (or AMPs) rich in residues like C, G, R and S. Comparison with residue composition of SwissProt proteins was made to check that the residue composition of ACPs is not random and can be easily differentiated with normal proteins/peptides. The analysis shows that ACPs are rich in positively charged residue and aromatic amino acids. The positively charged residues of the ACPs interact with the cancer cell membrane negatively charged residues for carrying out its lysis.
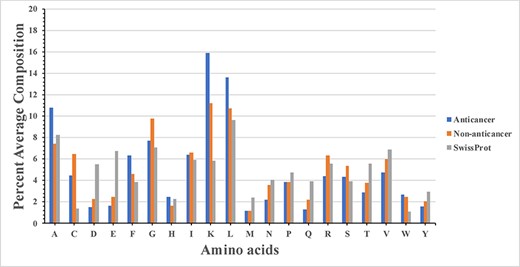
Bar plot shows the percent AAC of anticancer.
Positional preference of residues
In above analysis, it was observed that certain residues are more abundant in ACPs. It was not clear whether preferred residues are equally distributed or preferred at certain position. In order to understand the positional preference of residues, we compute two sample logos for N-terminus and C-terminus residues in peptides. The first 10 residues were taken for generating the logo for N-terminus and last 10 residues were taken for generating the logo for C-terminus residues. As shown in Figure 3A, at N-terminus, following is position wise preference of residues; F at first, A at second and K at third position. Apart from these residues, L was also preferred at other positions. At C-terminus, residues L and K were found to be highly preferred in comparison to other amino acids (Figure 3B).

Two sample logos generated from (A) N-terminus (first 10 residues) and (B) C-terminus (last 10 residues) of peptides.
Motif analysis
In order to identify exclusive motifs present anticancer and AMPs in main dataset, we used MERCI software. It was observed that following motifs ‘LAKLA, AKLAK, FAKL and LAKL’ were fond exclusively in ACPs. It was also observed that following motifs ‘GLW, CKIK, DLV and AGKG’ were exclusively found in non-ACPs. List of exclusive motifs found in ACPs and non-ACPs is provided in Supplementary Table S1.
Development of models on main dataset
As shown in above analysis that ACPs and non-ACPs have different residue composition. Thus, it is possible that residue composition of peptides can be used as feature for developing models that can discriminate ACPs and non-ACPs. First, we developed models based on different machine learning techniques using AAC of peptides. The performance of different models based on composition is shown in Table 1. It was observed that ETree-based model perform better than other models and achieve maximum AUROC 0.82 on the training dataset and AUROC 0.83 on validation dataset (Table 1). AAC provides no information of pairs, thus we also developed model using DPC of peptides. In case of DPC, ETree-based model out-perform other models and achieve maximum AUROC 0.83 on both training and validation dataset (Table 2).
The performance of AAC-based models developed using different machine learning techniques on main dataset
| Techniques (Parameters) | Training dataset | Validation dataset | ||||||||
|---|---|---|---|---|---|---|---|---|---|---|
| Sen | Spc | Acc | MCC | AUROC | Sen | Spc | Acc | MCC | AUROC | |
| SVC (g = 0.001, c = 1) | 72.90 | 68.99 | 70.94 | 0.42 | 0.78 | 73.41 | 65.32 | 69.36 | 0.39 | 0.79 |
| RF (Ntree = 100) | 74.35 | 73.33 | 73.84 | 0.48 | 0.82 | 78.03 | 68.21 | 73.12 | 0.46 | 0.83 |
| ETree (Ntree = 400) | 74.78 | 74.06 | 74.42 | 0.49 | 0.82 | 79.19 | 68.79 | 73.99 | 0.48 | 0.83 |
| MLP (activation = logistic) | 63.91 | 69.86 | 66.88 | 0.34 | 0.73 | 61.85 | 69.94 | 65.90 | 0.32 | 0.71 |
| KNN (neighbors = 10) | 67.54 | 70.29 | 68.91 | 0.38 | 0.76 | 71.10 | 69.36 | 70.23 | 0.40 | 0.78 |
| Ridge (alpha = 0) | 67.83 | 57.97 | 62.90 | 0.26 | 0.70 | 69.36 | 58.96 | 64.16 | 0.28 | 0.71 |
Sen: sensitivity, Spc: specificity, Acc: accuracy, MCC: Matthews correlation coefficient, AUROC: area under the receiver operating characteristic curve.
The performance of DPC-based models developed using different machine learning techniques on main dataset
| Techniques (Parameters) | Training dataset | Validation dataset | ||||||||
|---|---|---|---|---|---|---|---|---|---|---|
| Sen | Spc | Acc | MCC | AUROC | Sen | Spc | Acc | MCC | AUROC | |
| SVC (g = 0.001, c = 1) | 75.94 | 68.84 | 72.39 | 0.45 | 0.81 | 75.72 | 66.47 | 71.10 | 0.42 | 0.80 |
| RF (Ntree = 100) | 75.07 | 74.06 | 74.57 | 0.49 | 0.83 | 80.92 | 67.05 | 73.99 | 0.48 | 0.83 |
| ETree (Ntree = 400) | 74.06 | 76.52 | 75.29 | 0.51 | 0.83 | 77.46 | 73.41 | 75.43 | 0.51 | 0.83 |
| MLP (activation = logistic) | 69.71 | 69.13 | 69.42 | 0.39 | 0.78 | 75.72 | 68.79 | 72.25 | 0.45 | 0.80 |
| KNN (neighbors = 10) | 72.46 | 69.13 | 70.80 | 0.42 | 0.79 | 76.88 | 67.63 | 72.25 | 0.45 | 0.81 |
| Ridge (alpha = 0) | 70.43 | 69.42 | 69.93 | 0.40 | 0.75 | 71.68 | 70.52 | 71.10 | 0.42 | 0.76 |
Sen: sensitivity, Spc: specificity, Acc: accuracy, MCC: Matthews correlation coefficient, AUROC: area under the receiver operating characteristic curve.
It was observed in Figure 3, that certain residues are preferred at certain position. In order to capture this information, we developed model using composition of terminal residues. Thus we extract fix number of residues from peptides and compute their composition. For example, we extracted first 5 residues from N-terminus called N5. Similarly, we extract different number of residues from N-terminus and C-terminus and commination (N5, N10, N15, C5, C10, C15, N5C5, N10C10 and N15C15). The model developed using the composition of N5C5 performed achieve highest AUROC 0.83 AUROC on the training dataset and 0.82 AUROC on the validation dataset. The performance of support vector based models developed on different profiles (like N10, N15, N5C5) is shown in Supplementary Table S2. Similarly, support vector based models have been developed using terminus DPC. The model developed using DPC N5 got maximum AUROC of 0.86 on the training dataset and 0.83 on the validation dataset. The performance of support vector based models developed using DPC on different profiles (like N10, N15, N5C5) is shown in Supplementary Table S3.
All models developed above are composition based where they use either composition of whole peptide or composition of peptide terminus residues. One of the challenge with these models is that they cannot discriminate compositionally similar but functionally different peptides. In order to provide solution to this problem, we developed support vector based model using binary profile. The binary profile is an important feature when it comes to classifying two classes of peptides, as shown in previous studies [47]. Models were developed for different lengths of peptides (first 5, 10 and 15) from N- and C-terminus. Also, models were developed by joining the peptides obtained from both N- and C-terminus i.e., N5C5, N10C10 and N15C15. Models developed using binary profile of N10C10 achieved highest AUROC 0.81 on training dataset and 0.81 on validation dataset (Table 3).
The performance of SVM-based models developed on main dataset; models were developed using binary profile of terminal residues of peptides
| Techniques (Parameters) | Training dataset | Validation dataset | ||||||||
|---|---|---|---|---|---|---|---|---|---|---|
| Sen | Spc | Acc | MCC | AUROC | Sen | Spc | Acc | MCC | AUROC | |
| N5 (g = 0.01, c = 4) | 73.56 | 66.83 | 70.03 | 0.40 | 0.77 | 73.72 | 66.46 | 70.06 | 0.40 | 0.76 |
| N10 (g = 0.01, c = 4) | 73.57 | 66.56 | 70.04 | 0.40 | 0.79 | 77.50 | 64.42 | 70.90 | 0.42 | 0.80 |
| N15 (g = 0.01, c = 4) | 70.09 | 68.14 | 69.00 | 0.38 | 0.78 | 73.45 | 66.91 | 69.84 | 0.40 | 0.76 |
| C5 (g = 0.01, c = 4) | 64.10 | 63.25 | 63.66 | 0.27 | 0.68 | 61.82 | 66.87 | 64.33 | 0.29 | 0.70 |
| C10 (g = 0.01, c = 4) | 68.71 | 63.17 | 65.92 | 0.32 | 0.73 | 73.01 | 58.54 | 65.75 | 0.32 | 0.74 |
| C15 (g = 0.01, c = 4) | 66.52 | 61.69 | 63.83 | 0.28 | 0.72 | 67.83 | 63.12 | 65.23 | 0.31 | 0.74 |
| N5C5 (g = 0.01, c = 4) | 69.76 | 68.65 | 69.20 | 0.38 | 0.77 | 72.35 | 70.41 | 71.39 | 0.43 | 0.79 |
| N10C10 (g = 0.01, c = 4) | 76.32 | 68.61 | 72.44 | 0.45 | 0.81 | 79.39 | 66.27 | 72.81 | 0.46 | 0.81 |
| N15C15(g = 0.01, c = 4) | 73.76 | 70.98 | 72.22 | 0.44 | 0.80 | 72.17 | 65.96 | 68.75 | 0.38 | 0.79 |
Sen: sensitivity, Spc: specificity, Acc: accuracy, MCC: Matthews correlation coefficient, AUROC: area under the receiver operating characteristic curve, N5/N10/N15: First 5/10/15 elements from N-terminal, C5/C10/C15: First 5/10/15 elements from C-terminal, N5C5/N10C10/N15C15: First 5/10/15 elements from N-terminal as well as from C-terminal joined together.
These result indicate that composition-based models perform better than binary-based models, whereas binary profile have ability to discriminate compositionally similar peptides. In order to utilize strength of two techniques, we developed hybrid models that combine two approaches. The performance of various hybrid models developed using compositional and binary profile (N10C10) is shown in Table 4. In addition, we also developed model that combine composition-based models using motif-based approach. As shown in Table 4, AAC + motif model achieved AUROC 0.83 and 0.82 on the training and validation dataset, respectively.
The performance of models developed on main dataset using hybrid features that combines composition with binary profiles and motif
| Feature (Parameters) | Training dataset | Validation dataset | ||||||||
|---|---|---|---|---|---|---|---|---|---|---|
| Sen | Spc | Acc | MCC | AUROC | Sen | Spc | Acc | MCC | AUROC | |
| AAC (ETree Ntree = 400) | 74.78 | 74.06 | 74.42 | 0.49 | 0.82 | 79.19 | 68.79 | 73.99 | 0.48 | 0.83 |
| DPC (ETree Ntree = 400) | 74.06 | 76.52 | 75.29 | 0.51 | 0.83 | 77.46 | 73.41 | 75.43 | 0.51 | 0.83 |
| AAC + Bin_N10C10 (g = 0.01, c = 4) | 75.81 | 70.03 | 72.91 | 0.46 | 0.80 | 81.71 | 66.67 | 74.16 | 0.49 | 0.82 |
| DPC + Bin_N10C10 (g = 0.001, c = 10) | 73.81 | 72.78 | 73.29 | 0.47 | 0.81 | 76.83 | 71.52 | 74.16 | 0.48 | 0.81 |
| AAC + motif (g = 0.005, c = 1) | 74.89 | 73.88 | 74.38 | 0.49 | 0.83 | 79.07 | 65.70 | 72.38 | 0.45 | 0.82 |
| DPC + motif (g = 0.001, c = 10) | 75.47 | 72.28 | 73.88 | 0.48 | 0.81 | 78.49 | 68.60 | 73.55 | 0.47 | 0.79 |
Sen: sensitivity, Spc: specificity, Acc: accuracy, MCC: Matthews correlation coefficient, AUROC: area under the receiver operating characteristic curve.
Model developed on alternate dataset
In addition, we also developed models on alternate dataset where model discriminate anticancer and random peptides. It was observed that ETree-based model developed using AAC outperform models developed using other machine learning techniques. We also get best performance on models developed using ETree on main dataset. Our ETree-based model developed using AAC obtained AUROC 0.97 on training as well as on validation dataset. The performance of model developed using different machine learning techniques is shown Table 5. In case of DPC, our ETree-based model achieve maximum AUROC 0.96 on both training and validation dataset (Table 6).
The performance of AAC-based models developed using different machine learning techniques on alternate dataset
| Techniques (Parameters) | Training dataset | Validation dataset | ||||||||
|---|---|---|---|---|---|---|---|---|---|---|
| Sen | Spc | Acc | MCC | AUROC | Sen | Spc | Acc | MCC | AUROC | |
| SVC (g = 0.01, c = 10) | 89.46 | 88.95 | 89.20 | 0.78 | 0.97 | 89.18 | 96.39 | 92.78 | 0.86 | 0.97 |
| RF (Ntree = 200) | 90.62 | 88.17 | 89.40 | 0.79 | 0.97 | 91.24 | 92.27 | 91.75 | 0.84 | 0.97 |
| ETree (Ntree = 400) | 90.23 | 89.97 | 90.10 | 0.80 | 0.97 | 92.27 | 91.75 | 92.01 | 0.84 | 0.97 |
| MLP (activation = tanh) | 88.69 | 85.86 | 87.28 | 0.75 | 0.94 | 87.11 | 89.69 | 88.40 | 0.77 | 0.94 |
| KNN (neighbors = 10) | 88.82 | 88.30 | 88.56 | 0.77 | 0.95 | 92.27 | 89.18 | 90.72 | 0.81 | 0.96 |
| Ridge (alpha = 0) | 87.15 | 86.25 | 86.70 | 0.73 | 0.92 | 89.18 | 87.63 | 88.40 | 0.77 | 0.94 |
Sen: sensitivity, Spc: specificity, Acc: accuracy, MCC: Matthews correlation coefficient, AUROC: area under the receiver operating characteristic curve.
The performance of DPC-based models developed using different machine learning techniques on alternate dataset
| Techniques (Parameters) | Training dataset | Validation dataset | ||||||||
|---|---|---|---|---|---|---|---|---|---|---|
| Sen | Spc | Acc | MCC | AUROC | Sen | Spc | Acc | MCC | AUROC | |
| SVC (g = 0.001, c = 2) | 90.36 | 87.53 | 88.95 | 0.78 | 0.96 | 90.72 | 87.11 | 88.92 | 0.78 | 0.95 |
| RF (Ntree = 1000) | 88.56 | 87.53 | 88.05 | 0.76 | 0.95 | 89.18 | 87.63 | 88.40 | 0.77 | 0.95 |
| ETree (Ntree = 400) | 90.75 | 88.82 | 89.78 | 0.80 | 0.96 | 90.72 | 90.21 | 90.46 | 0.81 | 0.96 |
| MLP (activation = logistic) | 87.79 | 85.22 | 86.50 | 0.73 | 0.93 | 86.08 | 88.66 | 87.37 | 0.75 | 0.94 |
| KNN (neighbors = 9) | 91.77 | 80.46 | 86.12 | 0.73 | 0.94 | 94.33 | 74.23 | 84.28 | 0.70 | 0.94 |
| Ridge (alpha = 0) | 84.19 | 84.96 | 84.58 | 0.69 | 0.90 | 85.05 | 83.51 | 84.28 | 0.69 | 0.91 |
Sen: sensitivity, Spc: specificity, Acc: accuracy, MCC: Matthews correlation coefficient, AUROC: area under the receiver operating characteristic curve.
Similar to the main dataset, support vector based models were also developed for alternate dataset using the terminus AAC for various patterns. The model developed using the N15C15 pattern performed best with 0.84 MCC, and 0.97 AUROC on the training dataset and 0.89 MCC, and 0.97 AUROC on the validation dataset. A detailed result for other patterns is provided in Supplementary Table S4. Likewise, in the case of support vector based models developed using terminus DPC, the model developed using the N15C15 pattern performed best. It achieved the highest MCC of 0.81, and AUROC of 0.96 on the training dataset and MCC of 0.84 and AUROC of 0.95 on the validation dataset. The performance of models developed using DPC is shown in Supplementary Table S5.
In the case of binary profile based models for the alternate dataset, the model developed using N15C15 pattern performed best among all models. We achieved MCC of 0.75, and AUROC of 0.95 on training and MCC, of 0.76 and AUROC of 0.95 on validation dataset. The result for all other profiles for the alternate dataset is provided in Table 7.
The performance of SVM-based models developed on alternate dataset; models were developed using binary profile of terminal residues of peptides
| Techniques (Parameters) | Training dataset | Validation dataset | ||||||||
|---|---|---|---|---|---|---|---|---|---|---|
| Sen | Spc | Acc | MCC | AUROC | Sen | Spc | Acc | MCC | AUROC | |
| N5 (g = 0.5, c = 4) | 84.50 | 83.29 | 83.39 | 0.68 | 0.92 | 88.14 | 87.63 | 87.89 | 0.76 | 0.93 |
| N10 (g = 0.01, c = 3) | 85.95 | 83.14 | 84.58 | 0.69 | 0.92 | 88.48 | 86.63 | 87.60 | 0.75 | 0.94 |
| N15 (g = 0.01, c = 3) | 85.09 | 84.74 | 84.90 | 0.70 | 0.93 | 87.50 | 85.53 | 86.49 | 0.73 | 0.94 |
| C5 (g = 0.5, c = 1) | 82.30 | 75.84 | 79.06 | 0.58 | 0.88 | 83.51 | 86.08 | 84.79 | 0.70 | 0.90 |
| C10 (g = 0.01, c = 3) | 81.04 | 79.14 | 80.11 | 0.60 | 0.88 | 80.63 | 82.56 | 81.54 | 0.63 | 0.89 |
| C15 (g = 0.01, c = 3) | 83.02 | 84.90 | 84.03 | 0.68 | 0.90 | 81.25 | 88.82 | 85.14 | 0.70 | 0.91 |
| N5C5 (g = 0.01, c = 3) | 84.88 | 81.75 | 83.31 | 0.67 | 0.91 | 86.08 | 84.54 | 85.31 | 0.71 | 0.93 |
| N10C10 (g = 0.01, c = 4) | 87.99 | 87.43 | 87.72 | 0.75 | 0.94 | 85.34 | 91.28 | 88.15 | 0.77 | 0.95 |
| N15C15 (g = 0.01, c = 1) | 88.68 | 86.36 | 87.43 | 0.75 | 0.95 | 88.19 | 88.16 | 88.18 | 0.76 | 0.95 |
Sen: sensitivity, Spc: specificity, Acc: accuracy, MCC: Matthews correlation coefficient, AUROC: area under the receiver operating characteristic curve, N5/N10/N15: First 5/10/15 elements from N-terminal, C5/C10/C15: First 5/10/15 elements from C-terminal, N5C5/N10C10/N15C15: First 5/10/15 elements from N-terminal as well as from C-terminal joined together.
In case of alternate dataset too, composition-based models perform better than binary-based models whereas binary profile have ability to discriminate compositionally similar peptides. In order to utilize strength of two techniques, we developed hybrid models that combine two approaches. The performance of various hybrid models developed using compositional and binary profile (N15C15) is shown in Table 8. In addition, we also developed model that combine composition-based models using motif-based approach. As shown in Table 8, AAC + motif model achieved AUROC 0.98 and 0.97 on the training and validation dataset, respectively.
The performance of models developed on alternate dataset using hybrid features that combines composition with binary profile and motif
| Features (Parameters) | Training dataset | Validation dataset | ||||||||
|---|---|---|---|---|---|---|---|---|---|---|
| Sen | Spc | Acc | MCC | AUROC | Sen | Spc | Acc | MCC | AUROC | |
| AAC (ETree Ntree = 400) | 90.23 | 89.97 | 90.10 | 0.80 | 0.97 | 92.27 | 91.75 | 92.01 | 0.84 | 0.97 |
| DPC (ETree Ntree = 400) | 90.75 | 88.82 | 89.78 | 0.80 | 0.96 | 90.72 | 90.21 | 90.46 | 0.81 | 0.96 |
| AAC + Bin_N15C15 (g = 0.01, c = 4) | 93.38 | 90.58 | 91.88 | 0.84 | 0.98 | 92.36 | 93.42 | 92.91 | 0.86 | 0.97 |
| DPC + Bin_N15C15 (g = 0.001, c = 10) | 92.06 | 91.40 | 91.70 | 0.83 | 0.97 | 91.67 | 87.50 | 89.53 | 0.79 | 0.95 |
| AAC + Motif (g = 0.005, c = 1) | 92.40 | 91.11 | 91.75 | 0.84 | 0.98 | 91.24 | 89.69 | 90.46 | 0.81 | 0.97 |
| DPC + Motif (g = 0.001, c = 1) | 90.85 | 89.82 | 90.34 | 0.81 | 0.97 | 89.69 | 90.21 | 89.95 | 0.80 | 0.95 |
Sen: sensitivity, Spc: specificity, Acc: accuracy, MCC: Matthews correlation coefficient, AUROC: area under the receiver operating characteristic curve.
Benchmarking with existing methods
We also benchmarked the performance of existing methods with our method on the validation dataset of both datasets (main and alternate). We observed that our model outperformed previously existing methods on both datasets, as shown in Table 9. We observed that other methods were predicting most of the peptides as positive, i.e. indicating higher sensitivity and poor specificity in the case of the main dataset. However, our method discriminates the peptides as positive or negative with balanced sensitivity and specificity. In the case of the alternate dataset, most of the methods were able to distinguish positive peptides from negative peptides with balanced sensitivity and specificity; however, the accuracy of our model among all the methods was highest. The webserver of some of the methods like ACPP was not working. Methods like iACP-GAEnSC, SAP and Hajisharifi et al. do not provide web-based service. MLACP is predicting cell-penetrating peptide potency instead of predicting anticancer potency of a given peptide. Therefore, these methods were excluded during the benchmarking study. Recently, a method ACPred-Fuse has been developed which outperform almost all existing methods [36]. As shown in Table 9, ACPred-Fuse performs better than most of the methods. It is also possible that AntiCP 2.0 perform better than ACPred-Fuse due to dataset used for evaluation. In order to provide unbiased comparison, we compute the performance of AntiCP 2.0 and ACPred-Fuse on independent dataset used in ACPred-Fuse. Our method AntiCP 2.0 got MCC 0.47, whereas ACPred-Fuse got MCC 0.32. This observation indicates the superiority of AntiCP 2.0 over existing methods and reliability.
The performance of existing methods on validation or independent dataset corresponding to our main and alternate dataset
| Main dataset | Alternate dataset | |||||||
|---|---|---|---|---|---|---|---|---|
| Methods | Sen | Spc | Acc | MCC | Sen | Spc | Acc | MCC |
| AntiCP_2.0 | 77.46 | 73.41 | 75.43 | 0.51 | 92.27 | 91.75 | 92.01 | 0.84 |
| AntiCP | 100.0 | 01.16 | 50.58 | 0.07 | 89.69 | 90.20 | 89.95 | 0.80 |
| ACPred | 85.55 | 21.39 | 53.47 | 0.09 | 87.11 | 83.51 | 85.31 | 0.71 |
| ACPred-FL | 67.05 | 22.54 | 44.80 | -0.12 | 60.21 | 25.58 | 43.80 | -0.15 |
| ACPpred-Fuse | 69.19 | 68.60 | 68.90 | 0.38 | 64.43 | 93.30 | 78.87 | 0.60 |
| PEPred-Suite | 33.14 | 73.84 | 53.49 | 0.08 | 40.21 | 74.74 | 57.47 | 0.16 |
| iACP | 77.91 | 32.16 | 55.10 | 0.11 | 78.35 | 76.80 | 77.58 | 0.55 |
Sen: sensitivity, Spc: specificity, Acc: accuracy, MCC: Matthews correlation coefficient.
Implementation of webserver
We have developed a web-based server called AntiCP 2.0 (https://webs.iiitd.edu.in/raghava/anticp2/), which implements our two best models (Model-1 and Model-2) and hybrid models for predicting ACPs. Model-1 was trained on main dataset that discriminate anticancer and AMPs. Model-2 was developed on alternate dataset and developed to predict ACPs, discriminates from random peptides. Our server is a sequence-based method, so it does not provides the facility to incorporate information of features like disulfide bonds, modification information such as terminus or post-translational modifications. Also, there is length check in the webserver during prediction. The minimum length of sequence should be 4 and maximum should be 50. Major modules implemented in web server includes (a) PREDICT; (b) DESIGN; (c) Protein Scan; (d) Motif Scan and (e) Download. Detail description of these modules is provided below.
Predict
This module predicts the anticancer potency of the submitted peptides. Users can submit multiple peptides in FASTA format in the box or can upload the file containing the same. The server will provide the result in the form of ‘ACP’ or ‘non-ACP,’ along with prediction score and physiochemical properties selected during submission. In this module, we have provided four different models for prediction. Model-1 is a DPC-based model developed using the main dataset. Model-2 is an AAC-based model developed using the alternate dataset. The range of peptide length for models 1 and 2 is in between 4 and 50. Hybrid_DS1 model is a hybrid model developed using DPC and N10C10 binary profile as a feature on the main dataset. The minimum peptide length for this model should be 10, as it incorporates the N10C10 binary profile. Likewise, Hybrid_DS2 is also a hybrid model developed using AAC and N15C15 binary profile as a feature on the main dataset. The minimum peptide length for this model should be 15 as it incorporates the N15C15 binary profile.
Design
This module allows the user to design novel ACPs with better activity. Users can enhance the activity by selecting the peptide with the best mutation and prediction score. The input is given in the form of a single line (no FASTA). Once input sequence is provided, all possible mutants of the peptides with a single mutation are generated by the server. These mutants peptides will further get predicted by the selected model. The prediction score, along with the prediction result, will be provided based on the chosen threshold value. In the next step, the user can chose the best mutant peptides and use it further for generating new mutant peptides.
Protein scan
In this module, the user needs to submit the protein sequence in a single line. The server will generate overlapping protein patterns by choosing the appropriate size. Next, based on the selected threshold value, the server will predict the anticancer potency of all the generated overlapping patterns. The result page will provide the sequence information, the prediction score and the prediction result, i.e. whether the peptide is ACP or non-ACP. This facility allows users to scan the possible anticancer region in the given protein sequence.
Motif scan
This module allows users to scan whether their protein/peptide sequence comprises of motifs exclusively present in ACPs. This will enable the user to identify whether their protein/peptide is capable of being ACP or not.
Download
Users can download the datasets used in this study. The sequences are present in the FASTA file format.
Standalone
In order to serve the community, we have developed the standalone of the software in Python. Users can download the code and other required files from our GitHub account https://github.com/raghavagps/anticp2/. We have also provided a standalone facility in the form of docker technology. This standalone is integrated into our package ‘GPSRDocker,’ which can be downloaded from the site https://webs.iiitd.edu.in/gpsrdocker/ [48].
Discussion
Peptide-based therapeutics has gained tremendous attention in the last few decades. This is reflected by the increasing number of publications, development of in silico tools and databases. Due to several advantages over traditional small molecule based drugs; in the past, several peptide-based drugs have been approved by FDA. In the same context, peptide-based anticancer drugs have shown promising effects in treating cancer [49]. Some of the cancer treating peptide-based drugs reported in literature includes GnRH-targeting peptides [50], LY2510924 [51], ATSP-7041 [52]. As identification and screening of potential ACPs in the wet lab is time-consuming, costly and labor-intensive process, there is a need of in silico tools that can predict ACPs with high reliability. In last 5 years, several methods have been developed that can predict and design novel ACPs.
We analyzed the residue composition of ACPs and found that they are rich in residues like A, F, H, K, L and W. It has been shown in the literature that ACPs are rich in cationic residues which agrees with our study. As the order of the residues present in the peptide is strongly related to their activity, we analyzed the residue preference in the ACPs. We observed that at N-terminus residues like F, A and K are highly preferred, and at C-terminus residues like L and K are preferred. Thus apart from the composition, the order of the residue is an important feature and might be a key feature in determining their activity. We utilized the properties of the experimentally validated ACPs present in the literature for developing various prediction models. These features include composition (amino acid and dipeptide), terminus composition, binary profiles and hybrid models. In our study, we observed that among all models, the DPC-based feature performed best in the case of the main dataset. In contrast, in the case of the alternate dataset, the AAC-based model performed best.
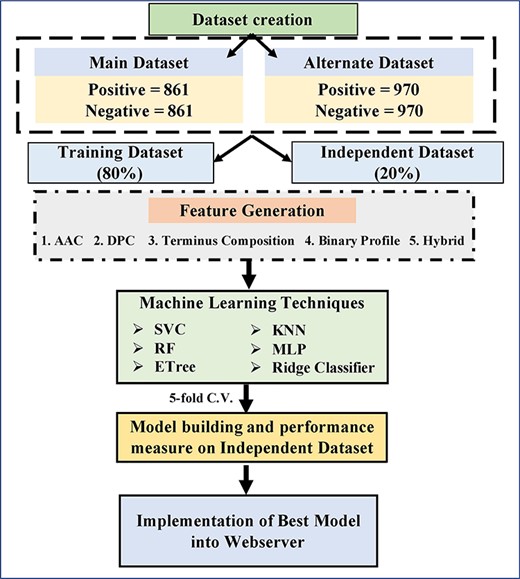
Flowchart shows steps involved in developing AntiCP 2.0.
Interestingly, we observed, that prediction models developed using alternate dataset achieved higher accuracy in comparison to main dataset. The potential reason for this is the high degree of similarity in between ACPs and AMPs. It has been shown that many of the AMPs exhibit anticancer activity, for example, Aurein 1.2 [53], HNP-1 [54], etc. These peptides share similar properties such as similar mechanism of action due to cancer cell surface membrane phenotype, lesser time for interaction, lower toxicity, solubility, specificity and better tumor penetration [23, 55]. However, the alternate dataset comprises of random peptides, having very different composition and properties with respect to ACPs. Therefore, it is easy for a model to distinguish random peptides with ACPs with higher accuracy. In the benchmarking study, we found that our model outperformed other methods.
Despite of several improvements, there are several limitations associated with this study. First being, the non-consideration of structural properties. Some of these important structural features include secondary structure information, surface accessibility value and disulfide bond information. Secondly, this model does not consider post-translational modification (e.g. terminus modification, addition of chemical moieties, glycosylation, phosphorylation, etc.) information while prediction. These points can be addressed in future studies for better prediction.
In order to help biologists, we developed a web server and standalone app and incorporated our best models. The webserver is freely accessible and provides several facilities to the user. The server is user-friendly and compatible with multiple screens such as laptops, android mobile phones, iPhone, iPad, etc. The complete architecture of the AntiCP 2.0 is shown in Figure 4.
Preprint of AntiCP 2.0
Preprint of the paper is available at bioRxiv with doi 10.1101/2020.03.23.003780
Conflict of Interest Statement
The authors declare that they have no conflict of interest.
Author’s Contribution
MM, DB and PA collected and compiled the datasets. MM, DB and PA performed the experiments. NS and PA developed the web interface and docker image. DB and PA developed the python-based standalone software. PA, NS and GPSR analyzed the data and prepared the manuscript. GPSR conceived the idea and coordinated the project. All authors read and approved the final paper.
An updated version of AntiCP for predicting anticancer peptides with high accuracy.
Classifiers trained on largest possible dataset using machine learning techniques.
The performance of AntiCP 2.0 is better than existing methods.
In addition to composition, it also uses binary profile for developing models.
It is available as web server, standalone software and Docker container.
Acknowledgement
Authors are thankful to J.C. Bose National Fellowship, Department of Science and Technology (DST), Government of India, and DST-INSPIRE for fellowships and the financial support. We are also thankful to Mr Sumeet Patiyal for his last moment help with the webserver.
Piyush Agrawal completed this PhD in bioinformatics from CSIR-IMTECH, Chandigarh, India and is now currently working as Research Associate-I in the Department of Computational Biology, Indraprastha Institute of Information Technology, New Delhi, India.
Dhruv Bhagat is currently pursuing his BTech in computer science and Engineering from Indraprastha Institute of Information Technology, New Delhi, India.
Manish Mahalwal is currently pursuing his BTech in computer science and Engineering from Indraprastha Institute of Information Technology, New Delhi, India.
Neelam Sharma is currently working as PhD in bioinformatics from Department of Computational Biology, Indraprastha Institute of Information Technology, New Delhi, India.
G.P.S. Raghava is currently working as professor and Head of Department of Computational Biology, Indraprastha Institute of Information Technology, New Delhi, India.
