


Abstract
Drug similarity studies are driven by the hypothesis that similar drugs should display similar therapeutic actions and thus can potentially treat a similar constellation of diseases. Drug–drug similarity has been derived by variety of direct and indirect sources of evidence and frequently shown high predictive power in discovering validated repositioning candidates as well as other in-silico drug development applications. Yet, existing resources either have limited coverage or rely on an individual source of evidence, overlooking the wealth and diversity of drug-related data sources. Hence, there has been an unmet need for a comprehensive resource integrating diverse drug-related information to derive multi-evidenced drug–drug similarities. We addressed this resource gap by compiling heterogenous information for an exhaustive set of small-molecule drugs (total of 10 367 in the current version) and systematically integrated multiple sources of evidence to derive a multi-modal drug–drug similarity network. The resulting database, ‘DrugSimDB’ currently includes 238 635 drug pairs with significant aggregated similarity, complemented with an interactive user-friendly web interface (http://vafaeelab.com/drugSimDB.html), which not only enables database ease of access, search, filtration and export, but also provides a variety of complementary information on queried drugs and interactions. The integration approach can flexibly incorporate further drug information into the similarity network, providing an easily extendable platform. The database compilation and construction source-code has been well-documented and semi-automated for any-time upgrade to account for new drugs and up-to-date drug information.
Introduction
Drug similarity studies rely on the assumption that drugs with similar pharmacological properties are similar in their mechanism of action, share similar side-effects and are indicated for the treatment of similar diseases [1, 2]. In-silico drug–drug similarity has been derived for a variety of applications including drug-target identification [3–7], side-effect prediction [8–10], drug–drug interaction prediction [11–15] and drug repositioning [1, 16–19]. The latter, i.e. repositioning existing drugs for new indications, has received an escalated interest in the research and pharmaceutical industries as an innovative drug development strategy offering the possibility of reductions in cost, time and risk as several phases of de-novo drug discovery can be bypassed for repositioning candidates [20]. Drug similarity estimation can be directly incorporated into the repositioning pipeline to prioritize repositioning candidates based on the extent of their similarity with the drug of interest.
A variety of drug-related sources of evidence—e.g. chemical structure characteristics [7, 21], protein targets [22, 23], side-effect profiles [6, 24], gene expression profiles [17, 25] and clinical information [2]—have been previously applied in drug–drug similarity analytics. Heterogeneous data sources provide a multi-view perspective for predicting similar drugs and can compensate for missing data across individual data sources. Hence, incorporating diverse data sources can boost the coverage and accuracy of the prediction and provide new insights into drug repositioning and other applications. Despite the current availability of several drug-related data sources, there is a need for a comprehensive, contemporary knowledgebase integrating diverse information from a wide array of evidence sources to derive multi-modal drug–drug similarities.
We addressed this resource gap by developing ‘DrugSimDB’ which incorporates into similarity measures, multiple sources of direct and indirect information compiled on a comprehensive list of drugs. DrugSimDB covers 10 317 small molecule drugs—including 2466 approved and 7212 experimental, illicit or withdrawn—and provides 238 635 pairs of drugs with significant, multi-modal similarity. Chemical structure descriptors, drug-induced pathways, drug–protein and protein–protein relationships as well as protein sequences and their functional annotations were compiled from diverse public datasets and used to estimate structure-, pathway-, target- and function-based similarity between each pair of drugs. Similarity measures across modalities were aggregated and assessed for statistical significance. Comparing against a drug repositioning gold standard of approved and failed drugs, we have shown that diversifying sources of similarity evidence improve the specificity and sensitivity of candidate prioritization for repositioning, which corroborates the necessity of multi-modal approaches and the utility of DrugSimDB for drug development.
We implemented an inclusive web-application (http://vafaeelab.com/drugSimDB.html) enabling users to browse DrugSimDB for a drug of interest or download the full database or any intermediately processed important files, e.g. individual pairwise similarity matrices. For each queried drug, in addition to a prioritized list of similar drugs, the web application provides information on a drug’s physicochemical and pharmacological properties as well as an interactive view of the drug’s 3D structure. More importantly, the web application provides an interactive visualization of an induced subnetwork of the drug–drug similarity network including the queried drug and its interacting partners. A batch query is also supported, where users can upload a list of drugs (names/IDs) to retrieve their similarity information. Users can select any node on the subnetwork to probe a drug’s side-effects or select any edge to explore PubMed articles with evidence of the association. For improved reusability and maintenance of data coverage, we implemented the whole framework as a well-documented and semi-automated, parallelized pipeline. Users can follow simple instructions to retrieve up-to-date data sources and update the database accordingly.
Overall, DrugSimDB and its web application provide an exhaustive and reusable resource for multi-modal drug similarity investigation enriched with drug side-effect, indications and literature evidence, which together form a unique starting point for drug-repositioning and beyond.
Materials and methods
Data sources
Drug names, identifiers, physicochemical and pharmacological properties and links to external databases were retrieved from ‘DrugBank’ [26], a comprehensive, frequently updated drug encyclopedia. Drug chemical structures in SDF format, protein targets and their primary structure in FASTA format were also retrieved from DrugBank. Drug-induced pathways and their constituent genes were obtained from ‘Kyoto Encyclopedia of Genes and Genomes’ (KEGG) [27]. Protein–protein interactions (PPIs) in humans were downloaded from ‘Interologous Interaction Database’ (I2D) [28], comprising validated and predicted PPIs compiled from over 35 databases and literature. Gene ontology (GO) annotations (cellular components, biological processes [BP] and molecular functions) of protein targets were obtained from the enrichR [29] web server which provides up-to-date GO annotations for gene-set enrichment analyses. Drug indications, i.e. drug to disease mapping and its clinical status, were downloaded from the Drug Repositioning Database (repoDB) [30]. Information on recorded adverse marketed drug reactions were obtained from SIDER, a database of drugs and side effects [31].
System design and implementation
The whole pipeline—including data retrieval, filtration and quality control, similarity estimation, validation and visualization—was implemented in R providing a unified platform for ease of reuse and ongoing maintenance. Drug similarity matrix computation was implemented using parallel computing in R, enabling intensive and repetitive similarity computations to be efficiently run over multiple processors and cores on local and remote clusters. An interactive web interface was developed using R Shiny [32]. Three-dimensional visualization of a queried drug’s molecular structure was implemented using the MolView [33] API. An interactive network view of an induced subnetwork comprising the queried drug and its interacting partners (i.e. significantly similar drugs) were visualized using the visNetwork R package, which offers all the features available in vis.js library for Shiny R applications [34]. Records of drug-pair co-occurrence in PubMed abstracts were retrieved and processed using the easyPubMed R package. The pipeline implementation is available to the public, properly commented and well-documented for usage instructions. We recommend using a web browser that supports 3D graphics for MolView rendering. The web interface has been tested on Firefox, Google Chrome and Internet Explorer.
Drug similarity estimation
Chemical structure similarity
Target protein sequence-based similarity
Target Protein functional similarity
In addition to sequence similarity, protein targets overrepresented by similar cellular functions would imply similarities in a drug’s mechanisms and downstream effects [41]. To that purpose, sets of GO terms of all three categories—i.e. cellular components (CC), molecular functions (MF) and BP—associated with each protein were retrieved from enrichR [29] libraries, version 2018. GO terms which were very specific (with ≤15 associated genes) or very general (with ≥100 genes) were filtered out. The set of proteins associated with a drug was enriched including targets as well as their interacting proteins on the PPI network. The latter are functionally relevant proteins, the inclusion of which would enrich GO annotations and improve subsequent statistical analyses. The Human PPI network was downloaded from I2D [28], version 2.9, and queried against the set of all protein targets; protein-to-gene mapping was performed using the AnnotationDbi package in R [42].
A GO term was then associated with a drug |${d}_i$| if ‘overrepresented’ by its protein targets and their immediate interacting partners. In other words, a term would be enriched if there were a high enough number of |${d}_i$|-related proteins annotated with the GO term implying that the functional association is statistically significant (P-value < 0.05 using Fisher’s exact test).
Once each drug was annotated with enriched GO terms, the functional similarity between any two drugs, i.e. |${\delta}_f\big({d}_i,{d}_j\big)$|, was determined by the semantic similarity of their associated GO terms as proposed by Wang et al. [43] using the topology of the GO graph structure. Pairwise semantic similarities between any two GO terms associated drug |${d}_i$| and |${d}_j$| were combined into a single semantic similarity measure using a best-match average strategy [43] and reported into a final similarity matrix. Semantic similarity estimation was performed using the mgoSim function from the GOSemSim R package [44].
Drug-induced pathway similarity
A drug-pair that induces identical or overlapping pathways implies similarities in mechanisms of drug actions providing relevant information for the study of drug similarities and repositioning [45]. Pathways induced by each small molecule drug were retrieved from KEGG, Release 91.0 [27]. The KEGGREST R package [46] (v 1.26.1) was used to invoke KEGG Restful APIs for collecting the list of KEGG pathways induced by each drug; ID mapping between DrugBank and KEGG Drug identifiers was performed using DrugBank external links, version 5.1.3.
Results and discussion
Database overview and statistics
Figure 1 shows the overall scheme and construction of DrugSimDB and the web application. Table 1 summarizes data sources used to generate the database and web interface along with statistics on retrieved data. Overall, 10 317 small-molecule drugs available in DrugBank, version 5.1.3 were considered and six distinct drug–drug similarity matrices were generated estimating measures based on similarities of chemical structures, target protein sequences, induced pathways and target protein function (cellular component, BP and molecular functions). The size of each similarity matrix is 10 317 × 10 317 = 106 440 489 and values range from 0 to 1. Missing values indicate no relevant information is available about the comparing drugs and were retained for consistency in dimensions. The individual matrices were mean-aggregated to form a combined-score similarity matrix. To report relevant pairs, the combined matrix was filtered to exclude drugs with missing values across all individual matrices (496 out of 10 317) and those with no SMILE structure (639 out of 10 317). Additionally, drug pairs were excluded if neither of the two drugs were marketed/approved (resulting 23 865 948 drug pairs) with the assumption that repurposing would make sense only if the candidate had not failed to be approved for the disease of interest. The final database was then organized as a data-table, where each row records a drug pair and columns correspond to individual similarity measures (×6), the mean-aggregated score, its associated P-value (based on standardized z-score) and the corresponding false discovery rate [48] adjusted P-value. The final data-table reports drug pairs with adjusted P-value < 0.05, yielding a total of 238 635 unique pairs.
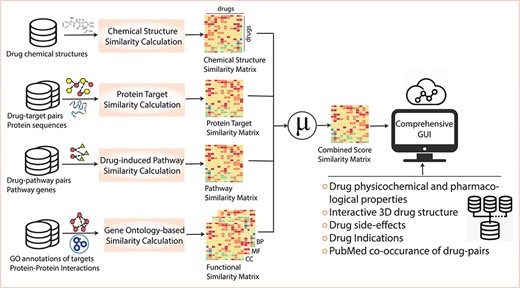
Database content and construction. For 10 317 small-molecule drugs, DrugSimDB collects information on (i) drug chemical structures to estimate drug pairwise chemical similarity, (ii) drug protein targets and protein sequences to estimate sequence-based target similarity, (iii) drug-induced pathways and their constituent genes to estimate pathway-based similarities, and (iv) GO annotations of protein targets and PPIs to identify functional similarities. The similarity scores are then mean-aggregated and filtered into a single matrix of combined similarities, i.e. DrugSimDB, which is made accessible and analyzable via a user-friendly and interactive graphical user interface and complemented with other information for in-place drug investigation. Abbreviations: GO: Gene Ontology, CC: Cellular Component, MF: Molecular Function, BP: Biological Process.
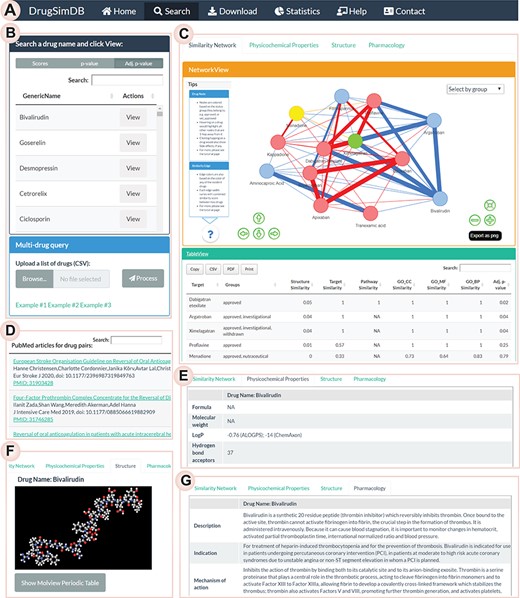
Database interface and access. (A) The navigation bar, (B) Users query any drug name for information on its similarity information with other approved drugs and can choose to view the type of combined statistics (i.e. mean-aggregated score, P-value or adjusted P-value). A batch query is also supported, where users can upload a list of drug names or DrugBank IDs to view similarities among them. (C) An interactive tabular view of a DrugSimDB induced sub-network comprising the query drug and its interacting pairs; users can filter, sort, export and print the table. An interactive network view of the induced sub-network of the queried drug would also be rendered. (D) A tabular view of PubMed-curated literature list involving a drug-pair when the user selects their corresponding edge in the network view. Panels describing/rendering the (E) physiochemical, (F) interactive 3D structure and the (G) pharmacological properties of the queried drug are shown. Users can also view a color-coded ‘periodic table’ of chemical elements to aid in the understanding of its chemical structure in the Structure tab.
Data types, statistics and details of data sources used to generate DrugSimDB and interface
| Data type | Statistics | Details | Data source |
|---|---|---|---|
| Drug identifiers, drug names and clinical status | 10 317 small-molecule drugs including 2466 approved drugs | — | DrugBank [26] |
| Drug physicochemical properties | 16 distinct properties per drug | Molecular weight, hydrogen bond acceptors/donors, ring count, molecular refractivity and polarizability, CAS number, SMILES, lnChl, IUPAC name, etc. | “ |
| Drug pharmacological properties | 16 distinct properties per drug | Description, indication, mechanism of action, target names, toxicity, pharmacodynamics, metabolism, half-life, route of elimination, etc. | “ |
| Drug chemical structures | 9678 structures | SDF format | “ |
| Drug protein targets and protein sequence | 4986 unique protein sequences and 20 061 drug-target pairs | FASTA format | “ |
| Drug-induced pathways | 243 pathways and 3888 drug-pathway associations | — | KEGG [27] |
| GO terms and annotations | 446 CC, 1151 MF, and 5103 BP terms, and a total of 250 734 protein-GO term associations | GO terms across categories of Cellular components (CC), molecular functions (MF) and BP | Enrichr [29] |
| PPIs | 469 515 PPIs | Validated and computationally predicted human PPIs | I2D [28] |
| Drug indications and clinical status | 10 562 drug-indication associations including 6677 ‘approved’ and 3885 ‘non-approved’ | RepoDB was considered as the drug repositioning gold standard and used for technical validation | RepoDB [30] |
| Drug side effects | 139 756 drug-side effect associations | Information on marketed medicines and their recorded adverse drug reactions | SIDER [31] |
Database access and usage notes
A search interface for drug-similarity network
We have developed a web application (http://vafaeelab.com/drugSimDB.html) using the Shiny R Studio project [32] to enable easy access to the DrugSimDB database and in-place investigation of drugs of interest (Figure 2A–G). With this application, users can query a drug (or list of drugs) and view similarity information on its interacting drugs retrieved from DrugSimDB (Figure 2B). The queried network—i.e. an induced sub-network comprising the queried drug and its interacting partners—would be displayed in an exportable ‘tabular-view’ as well as an interactive ‘network-view’ (Figure 2C). For a batch query, users can upload a text file containing drug names or DrugBank IDs and similarities among queried drugs would be shown in the tabular and network views. The tabular-view is sortable and includes information on interacting drug names, clinical statuses, individual and combined similarity measures with the queried drug(s), P-values and adjusted P-values of the combined similarity scores. The induced sub-network of the queried drug(s) in the network-view is interactive and query-able; the edge width corresponds to the combined similarity score, and upon selecting an edge, a PubMed query is made with its incident drugs, and the search results are displayed as a table in a modal window (Figure 2D). Additionally, when a drug node is selected, it displays its side-effect information from the SIDER database. For any queried drug, in separate tabs, users can observe physiochemical properties of the queried drug (Figure 2E), its chemical structure in an interactive 3D view (Figure 2F), and its pharmacological properties (Figure 2G) providing an all-in-one view for further investigation of the drug of interest. For a multi-drug query, the structure view as well as physiochemical and pharmacological properties of each drug would be organized into a toggle list expandable upon clicking. Some example files are also provided to assist users on preparing input files for a batch query.
Data download and statistics
The interface enables users to bulk download the full DrugSimDB database as well as individual similarity matrices and other intermediately processed relevant files. Links to downloads are available in the ‘Download’ page. Users can also view summary statistics of the database in the ‘Statistics’ page and use the ‘Help’ and ‘Contact’ pages to get information on how to use the application and how to cite the database or contact producers for reporting any bugs/issues.
Technical validation and relevance
Drug–drug similarity network is scale-free
Despite the phenomenal diversity of networks in nature, their architecture is usually governed by a few simple principlescommon to most real networks [49]. The most remarkable property of a network is characterized by the degree or connectivity of its nodes. Networks with ‘power-law degree distribution’ are called ‘scale-free’ where most nodes have only a few links and a few nodes, often called hubs, have huge numbers of links holding the network together. Remarkably, biological networks among others show a strong level of evidence for a scale-free structure [50].
We have shown that the DrugSimDB similarity network, where nodes are drugs and links represent pairwise similarity, illustrates scale-free topology (Figure 3A). The DrugSimDB network constitutes 4141 unique drugs or nodes and 238 635 edges of similarity associations with P-value < 0.05. We performed a bootstrapping hypothesis test (using the poweRlaw package in R [51]) to statistically determine whether DrugSimDB’s network architecture follows a power-law distribution and received P-value = 0.6, which does not reject the null hypothesis, indicating that the degree distribution is likely to be power-law.
![Technical validation and relevance. (A) This drug–drug similarity network illustrates a scale-free topology as observed in most of biological networks. (B) Integration of heterogenous data sources enhances information coverage reducing the number of missing values (i.e. drugs with no information) when compared to individual data sources. (C, D) Validated against RepoDB [30], a database of drug repositioning successes and failures, the combined similarity score of DrugSimDB drug-pairs yields a competitive AUC value of 0.708 which outperforms the predicting power obtained from individual data sources. It retains a similar score compared to target-based similarity yet with substantially improved coverage.](https://oup.silverchair-cdn.com/oup/backfile/Content_public/Journal/bib/22/3/10.1093_bib_bbaa126/1/m_bbaa126f3.jpeg?Expires=1749262690&Signature=LpUI6p6ByEjgXvlYvqSzHkPiNsWg14GQV6E5pmdUY7I6z3HBFELO919eRXIscIHGBAA5LzyKtnhuqQrSW5q3QBbrzZ5nRMLGtCp3vQhYmmB9Tve5kOSzBSIrkbMx0gOgTAmLRz97txNOzTegt8jdmIMLCKGO2g2DeqsM9ZzQbsbAWewhIy-lDd6cZfd6q7qr0ky2e1KcJfGuiLYz8F6CzX366-GB6MBTPhblNPfSlozAwWOx2qvAQEx0pC3vvGOJTf4zHdO88sLW~H1KRzGALw0WS2DHdh2yZzdFf0F5M~f18OSWVSv9itVmzL6DCmDCi3CGP9oDC2W1oxCjLS3rrw__&Key-Pair-Id=APKAIE5G5CRDK6RD3PGA)
Technical validation and relevance. (A) This drug–drug similarity network illustrates a scale-free topology as observed in most of biological networks. (B) Integration of heterogenous data sources enhances information coverage reducing the number of missing values (i.e. drugs with no information) when compared to individual data sources. (C, D) Validated against RepoDB [30], a database of drug repositioning successes and failures, the combined similarity score of DrugSimDB drug-pairs yields a competitive AUC value of 0.708 which outperforms the predicting power obtained from individual data sources. It retains a similar score compared to target-based similarity yet with substantially improved coverage.
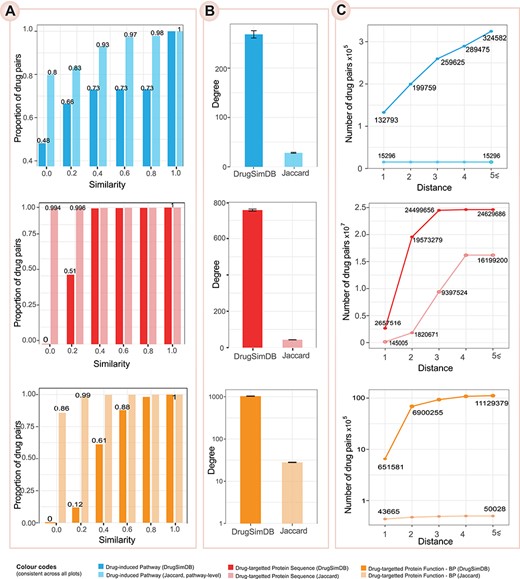
Comparison with Jaccard Index based on network-based properties. (A) The proportion of drug pairs whose similarity measure is ‘equal or less’ than the given thresholds. (B) The mean degree of nodes in the DrugSimDB networks and the corresponding Jaccard-based network; the error bar shows the standard error. (C) The number of drug pairs that are connected within the given distances (i.e. the number of links/edges between the two drugs is equal or less than the given threshold). Only the top 5% of similarity measures in target sequence-based and functional similarity matrices were retained in the DrugSimDB network and used for the calculation of degrees and distances. For each comparison, the pale color corresponds to the Jaccard-based approach. For functional similarity, only the GO category of BP was included in this visualization; similar results obtained using other categories (i.e. MF and CC) as visualized in Supplementary Figure S1, available online at https://dbpia.nl.go.kr/bib.
Aggregation of heterogeneous data improves the network coverage
Integrating heterogeneous multisource biomedical data on drugs would adjust for missing information across individual data sources and increase the data coverage. This potentially alleviates the sparsity challenge and difficulty of handling drugs with no information [52].
Figure 3B shows the proportion of drugs with no information across individual data sources and confirms that integration would reduce data sparsity. Drugs commonly have known valid chemical structures, resulting a minimum rate of missing values (7.4% out of 10 317) for chemical similarity. Other information sources, however, show substantial proportions of missing values with drug-induced pathways being at the extreme range (90.3%). The latter can be further improved by incorporating other databases as well as predictions on drug-pathway associations [45, 53], gene-expression profiles [54, 55] and protein interactions [28].
Drug–drug similarity network predicts repositioning candidates
Drug similarity networks can be readily used for repositioning purposes upon the assumption that similar drugs are potentially repositionable for same indication(s). To validate this assumption, we used repoDB [30], as a standard database of drug repositioning successes and failures which contains 6677 approved drug-indication pairs and 4123 failed drug-indication pairs extracted from DrugCentral [56] and ClinicalTrials.gov [57]. DrugSimDB drug pairs (total of 238 635) were sorted ascendingly by their combined similarity scores; a pair is considered as a ‘true positive’ (TP) when both drugs were approved for the same indication(s), and as a ‘false positive’ (FP) if, for a same indication, one drug was approved and the other was not. We then plotted ‘true positive rate,’ TPR (sensitivity) and ‘false positive rate,’ FPR (1-specificity) at multiple cut-off values as implemented by the ROCit R package [58] and estimated the ‘area under the receiver operating characteristic (ROC) curve’ (AUC) as shown in Figure 3C. We received a competitive AUC value of 0.708 using the combined similarity as the predicted score which outperforms scoring based on individual similarity measures (Figure 3D). This corroborates previous observations that integrating heterogeneous data sources can improve repositioning performance [3, 59].
Related works and comparison with Jaccard Index
Drug–drug similarity networks have been frequently used in a variety of in-silico drug development applications. Supplementary Table S1, available online at https://dbpia.nl.go.kr/bib, provides an illustrative list of recent studies where drug similarities were adopted as part of a larger computational pipeline to predict drug targets, identify drug–drug interactions and reposition drugs for new indications, among others. Regardless of the application, a mainstream approach to derive drug–drug similarities has been Jaccard similarity coefficient comparing properties (e.g. side-effects, targets, pathways) associated with any two drugs. While Jaccard-based similarity is a standard approach for comparing drugs across well-annotated properties (e.g. structural fingerprints), it has a limited capacity in deriving similarities for new or poorly annotated compounds. Additionally, when considering drug properties with a limited annotation coverage (e.g. induced pathways), drug pairs with overlapping properties are scarce, and thus the corresponding Jaccard based similarity matrix is extremely sparse upon studying a comprehensive set of compounds.
DugSimDB improves upon baseline Jaccard similarity coefficient by comparing pathways at the gene level, by estimating targets’ sequence similarities and by integrating PPI information with GO semantic similarities. Figure 4 demonstrates that the adopted approaches enhance the coverage and connectivity of drug–drug similarity networks compared with Jaccard-driven alternatives. Figure 4A illustrates the distribution of similarity measures (after removing missing values) as the proportion of drug pairs whose similarities are less than the given cut-off. For instance, Jaccard Index on the pathway level shows 80% of zero similarity while this value reduces to 48% when comparing pathways at the gene level. Additionally, on the functional similarity, 99% of drug pairs have Jaccard similarity of less than 0.2 (i.e. similarity percentile), while in the DrugSimDB network, the percentile raises to 0.8 indicating that the adopted approach not only increased the coverage but also improved the strength of the similarity evidence. Figure 4B shows the mean degree of nodes. Figure 4C shows the number of drug pairs that are connected within the given distances where the shortest distance between any two nodes were estimated using breadth-first search algorithm as implemented by the igraph package in R [60]. In the Jaccard-based pathway similarity, for instance, nodes are merely reachable from their immediate partners forming several disconnected islands. Together, the plots clearly show the improved connectivity of the DrugSimDB networks which can enhance subsequent network diffusion approaches frequently used in different drug development applications (see Supplementary Table S1 available online at https://dbpia.nl.go.kr/bib).
Code and data availability
To ensure the reproducibility of DrugSimDB, we have made the whole codebase (including any intermediate curation, processing and the web application) freely available for non-commercial uses in GitHub (https://github.com/VafaeeLab/drugSimDB). The code and interface are well documented, and the database update is implemented as a semi-automated pipeline. This would enable any-time upgrade by users to accommodate for updates in source databases. The pipeline has been efficiently implemented for parallel processing and it is recommended to be run on high-performance computing platforms to accelerate computations on large similarity matrices.
Conclusions
The DrugSimDB repository and its interface provide a comprehensive and easy-to-use resource to probe drug–drug similarities for a variety of drug development studies including, but not limited to, drug repositioning. The interface not only facilitates easy access to pairwise similarities via autocomplete browsing, exportable tables and interactive network visualizations, but also provides complementary information on the physiochemical properties, side-effects and pharmacology of queried drugs as well as PubMed evidence of any interacting, i.e. similar, drug pairs. Together, it provides an inclusive platform for similarity-based in-silico drug studies, all in one view. We have developed a semi-automated, well-commented upgrade-pipeline to enable easy and periodic database upgrade not only for developers but also for users who are willing to access to the latest version of data sources at any time.
Multiple lines of evidence regarding drug-related information have been derived from heterogeneous data sources to improve the coverage and prediction performance. Yet, DrugSimDB’s score-based prioritization platform has the capacity to incorporate a multitude of other drug-related information—e.g. drug adverse effects, pharmacodynamics, drug-target secondary structures and drug-induced molecular omics, which are all within our future perspective to further enhance the current resource. In contrast to supervised computational methods, the score-based, unsupervised prediction as adopted by DrugSimDB, is not biased to training composition, is not affected by an unbalanced training set and can simply incorporate any rare and sparse feature with substantial missing values. DrugSimDB is basically a weighted, multi-modal scale-free network of drug-drug associations which offers the scope for various network-based analyses [52], such as community detection, network-based inference and computing graph properties useful for drug repositioning and beyond.
DrugSimDB provides a comprehensive, integrative and extendable resource of drug–drug similarities complemented with an interactive user-friendly web interface.
DrugSimDB networks and individual similarity matrices cover an exhaustive list of currently approved and investigational drugs. The platform is easily updatable (by users and developers) to account for new drugs and information.
DrugSimDB currently integrates information on drug chemical structures, protein targets and their primary structure, drug-induced pathways, gene ontology annotations of protein targets and protein–protein interactions.
The web interface facilitates access to further information on drugs’ pharmacology, physiochemical properties and side-effects as well as peer-reviewed evidence from the PubMed literature search engine on drug-pair co-occurrence.
Authors Contribution
F.V. conceived and supervised the project. F.V., A.A., M.D. and A.N. developed the methodological framework. F.V. and A.A. generated the results and figures. A.A. developed the online platform. F.V. and A.A. wrote the manuscript. J.S. and L.L.M. contributed in project conception. All authors reviewed and approved the final manuscript.
AKM Azad, PhD, is a postdoctoral research fellow in bioinformatics and computational biology at UNSW Sydney, the School of BABS.
Mojdeh Dinarvand, PhD, is a research associate in drug discovery and microbiology at UNSW Sydney, the School of BABS.
Alireza Nematollahi, PhD, has been a research associate in pharmacology at UNSW Sydney, the School of BABS.
Joshua Swift, PhD, received his PhD in molecular oncology (2018) from the School of BABS at UNSW Sydney and is the founder of ZiggyLabs, an animal health company which utilizes drug repositioning to identify novel anti-cancer therapies for dogs.
Louise Lutze-Mann, PhD, is an associate professor in molecular and cell biology at UNSW Sydney, the School of BABS.
Fatemeh Vafaee, PhD, is senior lecturer and team leader in bioinformatics and computational biomedicine at University of New South Wales (UNSW Sydney), the School of Biotechnology and Biomolecular Sciences (BABS).
References
Carlson, Marc RJ, et al. ``
