


Abstract
DNA repeats are abundant in eukaryotic genomes and have been proved to play a vital role in genome evolution and regulation. A large number of approaches have been proposed to identify various repeats in the genome. Some de novo repeat identification tools can efficiently generate sequence repetitive scores based on k-mer counting for repeat detection. However, we noticed that these tools can still be improved in terms of repetitive score calculation, sensitivity to segmental duplications and detection specificity. Therefore, here, we present a new computational approach named Repeat Locator (RepLoc), which is based on weighted k-mer coverage to quantify the genome sequence repetitiveness and locate the repetitive sequences. According to the repetitiveness map of the human genome generated by RepLoc, we found that there may be relationships between sequence repetitiveness and genome structures. A comprehensive benchmark shows that RepLoc is a more efficient k-mer counting based tool for de novo repeat detection. The RepLoc software is freely available at http://bis.zju.edu.cn/reploc.
Introduction
Fast upgrade of the sequencing technology enables much more comprehensive and sophisticated genome research. It has already been unraveled that repetitive DNA or DNA repeats are strikingly shaping a significant proportion of the entire eukaryotic genomes. For example, ~85% of the maize genome consists of DNA repeats [1]. A newer study suggests that repeats may cover over 66% of the human genome [2] though it was considered to be ~50% according to the results of the Human Genome Project [3]. DNA repeats were originally referred to as junk or ‘selfish’ DNA [4] since most of them are located in noncoding regions. However, a large number of subsequent studies have shown that these overlooked sequences can contribute to genome evolution and regulation [5, 6]. Many human diseases also have been attributed to the disorders of DNA repeats [7]. With the improvement of sequencing technology, especially the third-generation sequencing, more complete genomes can be obtained by using much longer read length. This allows some unassembled dark regions of the genome to be revealed [8], where some novel repeats may remain to be detected. Meanwhile, the increasing number of sequenced genomes of various species also makes it urgent to be able to comprehensively detect and analyze DNA repeats in the genomes.
Common repeats (CRs) can be divided into two major classes: tandem repeats (TRs) and transposable elements (TEs). TRs are multiple adjacent copies of a pattern of several nucleotides. Some useful programs such as TRF [9] and TANTAN [10] are specially designed for de novo identification of TRs. These tools do not apply to TEs, which are also known as jumping genes discovered in the maize genome by McClintock [11]. Due to the transposition ability, TEs are the main source of high copy repeats in eukaryotic genomes. For example, Alu and L1 elements are two kinds of short interspersed nuclear elements and long interspersed nuclear elements, both containing over 1 million copies dispersed throughout the human genome and comprising ~11% [12] and 17% [3] of the whole genome, respectively. The high transferability and evolutionary divergence of TEs make it difficult to fully identify them. Most existing tools for CRs (especially TEs) identification can be grouped into two main categories: library-based methods and de novo methods. RepeatMasker [13] is the most widely used library-based tool that identifies repeats by homology searching with a manually curated repetitive element database—Repbase [14]. The main drawback of library-based tools is their lack of the ability to identify unannotated repeats. To make up for this deficiency, de novo repeat identification approaches that do not rely on the annotated library were proposed (listed in Table 1). Two main strategies have been utilized for de novo methods: self-comparison and k-mer counting. Repeat Pattern Toolkit [15], RECON [16] and PILER [17] are three self-comparison tools that can distinguish repeat families by pairwise alignment. These tools are relatively more accurate but also time consuming. K-mer counting, also known as word counting, refers to compute the number of exact matches of any word in the genome. Reputer [18] is the first complete k-mer-based software for detecting all the exact repeats in the genome. RepeatMatch [19] and Vmatch [20] are two programs that subsume Reputer. The RepeatFinder [21] constructs repeat families based on the exact repeats detected by Reputer or RepeatMatch. Since most DNA repeats undergo variations during evolution, it is inappropriate to use Reputer to detect those diverged repeats. To identify approximate repeats, some tools like RepeatScout [22] and Repseek [23] use high frequency k-mers as seeds and extend them to consensus repeats to determine the repeat families. However, RepeatScout does not detect all the repetitive sequences directly. The consensus repeats should be used as a library for RepeatMasker to search the whole genome to get the positions of repeats. Spectral Repeat Finder [24] and RepeatGluer [25] are also two tools that generate consensus sequences based on the Fourier transform and de Bruijn graph, respectively. The FORRepeats [26] program uses a data structure named factor oracle to detect exact repeats first and then computes approximate repeats. Some more recent tools like RAIDER [27] and its newer version phRAIDER [28] use a new algorithm incorporating the PatternHunter spaced seed model to improve the identification of elementary repeats (defined by Zheng and Lonardi [29]), which is similar to the mosaic patterns used by RepeatGluer. Generic Repeat Finder (GRF) [30] is designed to identify terminal inverted repeats, terminal direct repeats and interspersed repeats based on fast numerical calculation algorithms and dynamic programming strategies.
De novo methods for detecting all kinds of repeats from assembled sequences
| Methods | Strategies/data structures | Final results | Citations |
|---|---|---|---|
| Self-comparison-based methods | |||
| Repeat Pattern Toolkit (1994) | BLAST | Repeat families | [15] |
| RECON (2002) | BLAST | Repeat families | [16] |
| PILER (2005) | Pairwise alignment of long sequences | Repeat families and consensus sequences | [17] |
| K-mer-based methods | |||
| Reputer (1999) | Suffix tree | Exact repeat locations | [18] |
| RepeatMatch (1999) | Suffix tree | Exact repeat locations | [19] |
| RepeatFinder (2001) | Suffix tree (based on RepeatMatch and Reputer) | Repeat families | [21] |
| Vmatch (2003) | Suffix tree | Exact repeat locations | [20] |
| mer-engine (2003) | Burrows–Wheeler transform and suffix array | Repeat locations | [31] |
| FORRepeats (2003) | Factor oracle and automaton construction | Repeat locations | [26] |
| Spectral Repeat Finder (2004) | Fourier transform | Consensus sequences | [24] |
| RepeatGluer (2004) | de Bruijn graph | Repeat families and consensus sequences | [25] |
| RAP (2004) | Multi-array for counting dsDNA | Repeat locations | [35] |
| RepeatScout (2005) | Exact word match and seeds extension | Repeat families and consensus sequences | [22] |
| WindowMasker (2005) | Word counting and window-based mask | Repeat locations | [32] |
| Repseek (2006) | KMR and seeds extension | Repeat families and repeat locations | [23] |
| P-clouds (2008) | Mixed method (combining bit array and hash storage) | Repeat locations | [36] |
| Tallymer (2008) | Enhanced suffix array | Repeat locations | [33] |
| Red (2015) | Hash table and HMM | Repeat locations | [34] |
| Other tools | |||
| RAIDER (2013) | Elementary repeat determination | Repeat families and repeat locations | [27] |
| phRAIDER (2016) | PatternHunter spaced seed model | Repeat families and repeat locations | [28] |
| GRF (2019) | Numerical calculation and dynamic programming | Repeat families and repeat locations | [30] |
Note: Pipelines combining a set of programs above are not listed in this table.
Furthermore, another kind of de novo tool including mer-engine [31], WindowMasker [32], Tallymer [33] and Red [34] can generate repetitive scores transformed from k-mer frequencies to determine the repetitive sequences directly. To our knowledge, mer-engine is the first k-mer counting based method to depict the sequence repetitiveness map (Rmap) as well as the ‘genome terrain’. There are three key steps for these de novo tools: k-mer counting, repetitive score calculation and repeat determination. The primary task of this kind of tool is the k-mer counting step, aiming to compute the frequencies of all k-mers in acceptable time and space. Traditionally, k-mer counting can be achieved by hash methods. For example, Red uses a time-efficient hash algorithm to get the counts of all DNA words of a specific length. Although the word length of the hash method is usually limited, it is sufficient for the use of repeat detection. The suffix tree is also a commonly used data structure for counting k-mers but its space requirement is high, especially for large genomes. Therefore, some algorithms are proposed to enhance the performance of the suffix tree on k-mer counting. For example, Reputer utilizes an optimized suffix tree that reduces the space usage, making it possible to analyze word counts at the genome level. Suffix array is recommended as a space-saving alternative to the suffix tree, which is used by mer-engine and Tallymer. Furthermore, RAP [35] uses a multi-array data structure for counting double-stranded DNA (dsDNA) and P-clouds [36] uses a mixed method that combines bit array and hash storage to count exact k-mers. Besides, some other efficient k-mer counting tools (e.g. Jellyfish [37]) are used as part of the methods like RepARK [38] to identify repeats from short sequencing reads. Note that although our tool can also locate the repetitive regions in every sequencing read, it is unable to merge these short repetitive units into true repeats. Therefore, we mainly focus on detecting repeats from assembled sequences in this study.
To determine the repetitive sequences, the k-mer frequencies are transformed into repetitive scores after the k-mer counting step. The mer-engine program does not provide a complete pipeline to detect repeats based on k-mer counting results, and the software is no longer available. WindowMasker allocates predefined mer-scores for k-mers that satisfy the cutoff, then scans all windows of length k + 4 in the sequence and assigns each window a win-score calculated by the average of mer-scores of the k-mers within the window. The window will be masked if the win-score is greater than the threshold. Tallymer provides an efficient algorithm for k-mer frequency calculating but no complete guideline is provided for repeat detection from assembled sequences. Therefore, a pipeline based on Tallymer was developed by Dan Bolser [39] to identify repeats in large genomes. For convenience, the pipeline is still called Tallymer in this article. Tallymer uses the frequency of the k-mer starting at the nucleotide as its repetitive score, and those k-mers with scores over the threshold are determined as repetitive regions. Overlapping and nearby k-mers are merged to get the final repetitive sequences. Red uses a Gaussian mask to smooth the k-mer frequencies and automatically labels the repetitive and nonrepetitive regions based on the smoothed scores. The hidden Markov model (HMM) is trained on the labeled regions and then the entire genome is scanned for repeats. According to Girgis’s paper, Red runs much faster than RepeatScout and RECON, while it can still achieve reasonable or even better sensitivity and specificity to CRs. Considering the efficiency and performance of the programs, all subsequent comparisons versus Repeat Locator (RepLoc) are focused on three k-mer counting based tools (Tallymer, Red and WindowMasker) and two newer tools (phRAIDER and GRF).
Despite these existing k-mer counting based tools are time and memory efficient and can achieve good performance, there are still several deficiencies that can be improved. First, the way to calculate repetitive scores is not intuitive enough. For example, Tallymer just uses the k-mer frequencies as repetitive scores, which are sometimes lower than the true repetitiveness according to our analysis (see Materials and methods). WindowMasker uses average scores in a window and Red uses a Gaussian smoothing to modify the repetitive scores. The smoothing strategy can avoid the underestimation to a certain extent but the repetitive scores at the flanking nonrepetitive regions close to the true repeats may also be misestimated. It is worth noting that although all three tools have proposed ways to quantify repetitive scores, they do not provide direct output for visualization analysis. Second, the methods used by these tools to detect repeats are mainly based on repetitive score filtering to obtain regions with higher scores. WindowMasker selects the repetitive units with high repetitive scores as repeats without merging, making the results too fragmented. Tallymer and Red would merge two adjacent repetitive units with a gap below the threshold but they do not consider the repetitiveness difference between adjacent units. This causes those nearby repetitive units that belong to different real repeats to be merged, reducing the ability to distinguish the boundaries of different repeats (i.e. the detection specificity). Moreover, we found that these de novo repeat identification tools hardly discussed the detection of segmental duplications (SDs), which are defined as segments of DNA sequence with ≥1 kb in length and ≥90% in sequence identity [40]. SDs can be specially identified by WGAC [41] or other practical tools such as SEDEF [42]. Of the three k-mer counting based tools, WindowMasker is not sensitive to SDs because it filters the regions with low repetitive scores. Tallymer and Red can detect part of SDs but the low copy SDs will be ignored because of the filtering of k-mers with low copy number. Besides, the CRs embedded in SDs also lead to difficulties in controlling the balance between sensitivity to SDs and specificity to embedded repeats (ERs). The machine learning approach used by Red improves the ability to detect the ERs in the SDs with relatively low copy number but also sacrifices the ability to detect the full length of SDs.
To address the problems mentioned above, we provide RepLoc, a new computational pipeline based on weighted k-mer coverage for sequence repetitiveness quantification and de novo detection of DNA repeats. The workflow of RepLoc consists of three main modules (Figure 1): (1) k-mer counting; (2) sequence repetitiveness computing and (3) repeat locating and merging. Details of the three modules are described in Materials and methods. According to our analysis, RepLoc has the following advantages: RepLoc uses a more intuitive scoring method to quantify sequence repetitiveness; RepLoc outputs the Rmap file in BedGraph format for visualization and analysis; the locating and merging module of RepLoc considers both gap size and repetitiveness difference to improve the detection specificity; RepLoc is sensitive to both CRs and SDs; RepLoc provides a method (RepEM) to extract the ERs inside the SDs; RepLoc has moderately low false positives while detecting more potential repeats (PRs) and RepLoc supports multiple processes to reduce the program runtime. The RepLoc program is freely available at http://bis.zju.edu.cn/reploc.
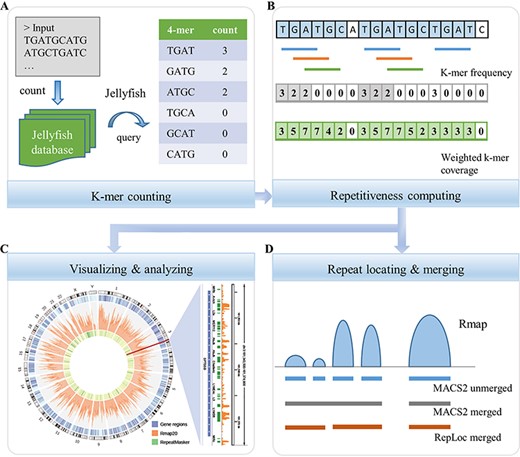
The workflow of RepLoc. (A) The k-mer counting step consists of two parts. First, count the frequencies of all k-mers in the input genome sequence by using Jellyfish. A database will be generated for the next step. Second, query the frequencies of all k-mers in input sequences from beginning to end. The final results of this step are lists of k-mers (left column) and their counts (right column). Unique k-mers are counted as 0 in this study. (B) Sequence repetitiveness computing. The results of traditional k-mer frequency and weighted k-mer coverage are shown on a sequence with a length of 18 bp. The sequence contains a two copy repeat ‘TGATGC’ and a repeat segment ‘TGAT’ (shown in light blue). Horizontal bars are three high frequency k-mers (count ≥ 2) in the sequence. The repeat regions that can be detected by k-mer frequency method and weighted k-mer coverage are highlighted with light gray and light green, respectively. (C) Examples of visualization and analysis of the Rmap generated by RepLoc. (D) Call peaks and merge them from the Rmap file. The blue horizontal bars are gapped peaks called by MACS2 bdgpeakcall without merging. The peaks merged by MACS2 are shown in gray. The red bars are the results of RepLoc by considering the fold change of repetitiveness between adjacent peaks.
Materials and methods
Genome data
All genome sequences of seven species were downloaded from NCBI in October 2019. The human genome annotation (GRCh38.p13) was downloaded from GENCODE [43].
K-mer counting
The count and query functions in Jellyfish are used to generate the k-mer counting list, also known as k-mer frequency, which contains the sequence (left column) and count (right column) of the k-mer that starting at each nucleotide from the beginning of the sequence to the end (Figure 1A). For any k-mer, the count of itself and its reverse-complement are both considered. The k-mers that including ‘N’ are not counted. The counts of unique k-mers are counted as 0 by filtering the k-mers that occur less than two times in the input sequence. Note that the k-mer counting step is independent of the subsequent steps, and thus can be replaced by other practical tools. For example, the tools KMC3 [44], DSK [45] and Gerbil [46] are recommended to be more efficient for k-mer counting according to a comprehensive benchmark [47]. While we use Jellyfish as the k-mer counting tool in our method because it has already been used by some de novo repeat identification methods like RepARK [38]. Moreover, Jellyfish provides the query function that is very useful for further repetitiveness computing step of our method.
Sequence repetitiveness computing
Here, mij represents the k-mer that includes the sequence position i, n is the total number of mij and |${\mathrm{count}}_{m_{\mathrm{ij}}}$| denotes the number of repetitions of mij in the sequence. The weighted k-mer coverage method is inspired by the way of sequencing coverage depth calculation [48], which computes the sequencing depth of a genome position by counting the total number of unique reads that include the given position. A simple example in Figure 1B shows the comparison between weighted k-mer coverage and k-mer frequency. In a sequence with a length of 18 and contains three 4-mers that occur more than once, the k-mer frequencies of positions 4–7, 11–13 and 15–18 are 0 because no repetitive 4-mers starting at these positions. The repetitive scores at the last three nucleotides of the two copy repeat ‘TGATGC’ are underestimated as 0 by k-mer frequency method. In our method, the repetitive scores for all positions on the ‘TGATGC’ repeat are greater than 0, which helps to locate the complete repetitive sequence. The repetitive scores calculated by weighted k-mer coverage show peak shapes on the real repeat regions, similar to Red’s Gaussian smoothing method. Note that the repetitive scores generated by RepLoc can reflect the relative repetitive level of the sequence, but may not equal to the copy number of the repeat. The Rmap composed of repetitive scores is output in BedGraph format, which can be easily converted to the BigWig format for visualization and analysis in various ways (Figure 1C).
Repeat locating and merging
Adjacent peaks are merged only when g and f are both below the user-set thresholds. We adopt g = 50 and f = 100 as default parameters of the program (see details in Discussion). An overall average rscore s is calculated by using BEDTools [50] for those merged peaks, which can be used for further filtering of potential false positives. Ideally, the average rscore values of those unique k-mers are equal to 1. Therefore, the default value of s is set to 1 to filter out repetitive fragments with average rscore values below 1, which are more likely to be false positives. Besides, we set s to 4 for those repetitive sequences shorter than 2 k in length to further reduce the false positives in this study.
Evaluation criteria
Gold standard
The repeats annotated by RepeatMasker are usually regarded as the gold standard for evaluation of the performance of the de novo tools (e.g. Red). Although RepeatMasker can identify almost all annotated repeats in the genome, it still lacks the ability to identify unknown repeats. Besides, some uncommon repeats like SDs are not annotated by RepeatMasker. Therefore, we use the results of RepeatMasker as the gold standard for CRs. With regard to SDs detection, the performance of SEDEF is not worse than the most recognized gold standard WGAC, but the computation speed is way quicker by using sophisticated filtering strategies based on Jaccard similarity and local chaining. Therefore, the results of SEDEF are regarded as the gold standard for SDs in this study.
Sensitivity and specificity
Here, OLclass is the overlap between de novo detected repeats and annotated repeats and RPclass is the total length of the annotated repeats (class = CRs, SDs or ARs). The dataset of ARs is obtained by merging CRs and SDs and removing the overlapping parts. The specificity is referred to as the ability of the tools to distinguish different repeats in this study. If a de novo detected repeat (A) covers more than 80% of the annotated repeat (B), and B also covers more than 80% of A, then this repeat is specific. Based on that, the specificities of the de novo tools are measured by the total number of the specific repeats (SPNum).
Potential repeat length (PRL) and false discovery rate (FDR)
Time and memory evaluation
To evaluate the performance on time and memory consumption, all the programs were run on a computing server with 20 core Intel Xeon E5-2640 v4 processors at 2.40 GHz and 256 GB of RAM.
Results
The Rmap of the human genome
The RepLoc method is applied to the human genome to generate the Rmap with a k-mer length of 20 (Rmap20). The circular plot of Rmap20 illustrates the global repetitive level of 23 human chromosomes in a quantitative way (Figure 2A). The gene distribution, Rmap20 and repeats annotated by RepeatMasker in a 31 kb region (chr3: 161 343 500–161 374 900) of chromosome 3 are shown on the right panel. The Rmap20 generated by RepLoc can reveal the repetitiveness of any genomic region but RepeatMasker and other tools do not provide such quantitative information. Although some de novo identification tools have defined similar repetitive scores, they do not output quantitative files for visualization and analysis. The repetitive regions usually show high peaks on the Rmap20, which would be useful to detect DNA repeats (similar to peak calling). Regions with higher gene density also tend to present higher repetitive scores, where there may be some highly repetitive sequences. However, the correlation (cor = 0.08, p = 3.3e-06) between RepeatMasker annotated repeat density and gene density is very low (Figure 2B). This indicates that using the qualitative information annotated by RepeatMasker may not be able to obtain accurate relationships between gene distribution and repetitive sequences. It can be seen in Figure 2C that the repetitive scores show a positive correlation (cor = 0.51, p < 2.2e-16) with the gene density. These results indicate that some high copy number TEs (e.g. Alu [51]) are likely to be involved in the formation of specific genome structures and can be the main reason for the positive correlation between gene and repeat distribution.
![(A) The global plot of gene density, Rmap with a k-mer length of 20 (Rmap20) and repeat density (from outer to inner) in the human genome. A local view in chr3: 161 343 500–161 374 900 is shown on the right. Circos [63] and IGV [64] were used to draw the plot. The gene annotation was downloaded from GENCODE. The repeats were annotated by RepeatMasker. (B) The scatter plot shows the low correlation between gene density and repeat density (cor = 0.08, p = 3.3e-06). Here, the human genome is segmented into 3102 1 Mbp fragments. The gene density and repeat density are the ratios of gene region and repeat region in each fragment, respectively. (C) The figure shows a positive correlation between gene density and sequence repetitiveness (cor = 0.51, p < 2.2e-16). The rscore values are log normalized and scaled for easy comparison. (D) The normalized repetitive scores on gene regions and random regions in the human genome. The random regions are generated by shuffling the gene set (shown in dark blue). The repetitiveness profiles across the coding genes and LncRNA genes are shown in light blue and yellow, respectively. The deepTools [65] is used to draw this plot.](https://oup.silverchair-cdn.com/oup/backfile/Content_public/Journal/bib/22/3/10.1093_bib_bbaa086/1/m_bbaa086f2.jpeg?Expires=1749206347&Signature=GyJBPprYbZ9ejAjyUW9VY-~7nhGu-zu-kAUSIE4skY7LfK7NgWeGFM7AENcF-pikbCvRlOs2mhoR3msTB01DzihzYwCsPM~1k8nY-G9VUxc1zzGwmG2Af2Ej3Bqqg4nJGr7ePUenIQ-uhGiB2AR7~~VxOhlwfdcx2EU~nSrhE~V1uKwfZz5iR1X2F~o-n3CGxoE6XXJ3gM~9SBqAvb4YNAW5FzzRpYXVA7WvgA5-zTuMJnJ9qYCq67soi8izXM0NXDbRAjIlck~yJY6pJ5z73g2pDnGAZPZkde-pvRRpzaSmvX2MTFY3QYz99IjPPMjVoiUy8eQMpuQaQyD2o2zbuA__&Key-Pair-Id=APKAIE5G5CRDK6RD3PGA)
(A) The global plot of gene density, Rmap with a k-mer length of 20 (Rmap20) and repeat density (from outer to inner) in the human genome. A local view in chr3: 161 343 500–161 374 900 is shown on the right. Circos [63] and IGV [64] were used to draw the plot. The gene annotation was downloaded from GENCODE. The repeats were annotated by RepeatMasker. (B) The scatter plot shows the low correlation between gene density and repeat density (cor = 0.08, p = 3.3e-06). Here, the human genome is segmented into 3102 1 Mbp fragments. The gene density and repeat density are the ratios of gene region and repeat region in each fragment, respectively. (C) The figure shows a positive correlation between gene density and sequence repetitiveness (cor = 0.51, p < 2.2e-16). The rscore values are log normalized and scaled for easy comparison. (D) The normalized repetitive scores on gene regions and random regions in the human genome. The random regions are generated by shuffling the gene set (shown in dark blue). The repetitiveness profiles across the coding genes and LncRNA genes are shown in light blue and yellow, respectively. The deepTools [65] is used to draw this plot.
The repetitiveness profile across the gene body regions of the human genome shows a specific pattern that intergenic regions have higher repetitiveness than gene body regions (Figure 2D). In particular, the repetitive scores at TSS and TES positions are the lowest, indicating that high copy number repeats are rarely located near the regions of coding and noncoding boundaries. Keeping the uniqueness and low repetitiveness of these regions may have important biological meanings, for example, to maintain the specificity of transcription. Such uniqueness is reduced at both the starting and ending regions of LncRNA genes. However, the repetitiveness at LncRNA body regions is lower than the protein-coding genes. These characteristics may be related to the special distribution of repetitive sequences along the LncRNA genes [52].
The performance of RepLoc on de novo repeat detection
The previous studies have already proved that Red and GRF are much faster than RepeatScout and RECON, while they still achieve high sensitivities to most kinds of DNA repeats. So, we did not compare RepLoc with RepeatScout and RECON repeatedly in this article. To cover as many repeats as possible, the sensitivities to both CRs and SDs are measured in this study. A comprehensive benchmark of RepLoc and the current state of the art tools are presented in Table 2. The genomes of seven organisms (Arabidopsis thaliana, Drosophila melanogaster, Oryza sativa, Danio rerio, Zea mays, Mus musculus and Homo sapiens) are chosen to evaluate the performance of RepLoc versus Tallymer, Red, WindowMasker, phRAIDER and GRF.
Comparisons of the performance of Red, Tallymer, WindowMasker, phRAIDER, GRF and RepLoc in de novo repeat detection
| Method | SECRs (%) | SESDs (%) | SEARs (%) | DEL (bp) | URL (bp) | PRL (bp) | FDR (%) | SPNum | Time (min) | Mem (GB) |
|---|---|---|---|---|---|---|---|---|---|---|
| Arabidopsis thaliana | ||||||||||
| RepLoc | 75.64 | 62.68 | 66.97 | 27 792 273 | 5 325 883 | 1 412 754 | 14.08 | 7761 | 1.62 | 0.73 |
| Red | 76.99 | 56.29 | 65.41 | 48 266 600 | 26 325 011 | 800 327 | 52.88 | 2728 | 2.78 | 0.91 |
| Tallymer | 63.79 | 38.14 | 49.13 | 21 002 177 | 4 520 842 | 503 480 | 19.13 | 8039 | 1.77 | 0.94 |
| GRF | 55.58 | 35.52 | 43.29 | 15 443 068 | 921 123 | 447 935 | 3.06 | 772 | 8.85 | 2.40 |
| WinMask | 38.07 | 23.60 | 30.48 | 25 335 171 | 15 108 496 | 128 506 | 59.13 | 7177 | 0.60 | 0.32 |
| phRAIDER | 7.82 | 3.31 | 5.36 | 1 810 768 | 11 108 | 5351 | 0.32 | 130 | 1.07 | 3.40 |
| Drosophila melanogaster | ||||||||||
| RepLoc | 86.05 | 95.16 | 86.11 | 30 406 825 | 3 624 759 | 286 476 | 10.98 | 19 411 | 1.75 | 0.73 |
| Red | 83.02 | 83.80 | 80.40 | 30 727 818 | 5 722 087 | 157 730 | 18.11 | 12 160 | 3.28 | 1.00 |
| Tallymer | 82.11 | 82.76 | 79.40 | 28 758 853 | 4 063 921 | 163 671 | 13.56 | 18 812 | 2.25 | 1.08 |
| GRF | 70.02 | 79.47 | 68.18 | 21 619 040 | 412 980 | 148 766 | 1.22 | 1720 | 8.88 | 2.80 |
| WinMask | 49.51 | 39.72 | 47.04 | 29 686 523 | 15 055 682 | 32 444 | 50.61 | 19 381 | 0.68 | 0.32 |
| phRAIDER | 37.23 | 44.81 | 36.74 | 11 491 245 | 64 107 | 46 170 | 0.16 | 1096 | 3.38 | 3.90 |
| Oryza sativa | ||||||||||
| RepLoc | 85.69 | 77.21 | 82.34 | 185 011 071 | 12 032 731 | 4 111 008 | 4.28 | 77 462 | 2.60 | 1.50 |
| Tallymer | 77.13 | 46.63 | 68.42 | 149 613 447 | 5 873 820 | 1 435 182 | 2.97 | 66 576 | 9.32 | 3.00 |
| Red | 73.05 | 41.49 | 64.08 | 137 634 418 | 2 999 845 | 1 071 069 | 1.40 | 55 536 | 9.18 | 2.40 |
| GRF | 72.95 | 50.71 | 66.15 | 143 570 275 | 4 592 364 | 1 807 796 | 1.94 | 22 613 | 11.92 | 8.30 |
| WinMask | 58.07 | 28.41 | 50.40 | 120 138 226 | 14 243 639 | 209 240 | 11.68 | 38 261 | 3.00 | 1.10 |
| phRAIDER | 34.42 | 14.81 | 29.31 | 61 742 598 | 160 949 | 76 377 | 0.14 | 7535 | 10.08 | 5.30 |
| Danio rerio | ||||||||||
| RepLoc | 88.32 | 91.41 | 87.98 | 814 834 122 | 60 910 450 | 8 919 596 | 6.38 | 416 859 | 13.48 | 6.20 |
| Tallymer | 87.27 | 84.12 | 86.33 | 802 714 830 | 62 891 311 | 6 284 038 | 7.05 | 373 038 | 44.67 | 11.50 |
| Red | 74.62 | 75.24 | 73.60 | 644 011 242 | 13 254 572 | 3 338 095 | 1.54 | 334 424 | 38.68 | 6.40 |
| GRF | 73.46 | 78.96 | 72.91 | 648 858 019 | 24 069 790 | 4 677 047 | 2.99 | 130 319 | 65.58 | 37.60 |
| WinMask | 67.41 | 52.17 | 65.75 | 646 304 388 | 82 840 510 | 1 870 446 | 12.53 | 203 965 | 15.52 | 1.30 |
| phRAIDER | 38.70 | 51.68 | 38.70 | 335 782 283 | 4 172 859 | 1 320 276 | 0.85 | 88 898 | 39.62 | 8.60 |
| Zea mays | ||||||||||
| RepLoc | 97.80 | 93.08 | 94.36 | 1 842 724 703 | 23 764 993 | 14 207 796 | 0.52 | 59 019 | 28.90 | 6.20 |
| Tallymer | 97.13 | 89.00 | 91.56 | 1 784 439 413 | 19 397 981 | 10 361 876 | 0.51 | 55 600 | 96.10 | 19.30 |
| GRF | 95.32 | 88.62 | 90.55 | 1 763 611 506 | 18 136 515 | 10 059 994 | 0.46 | 22 173 | 147.48 | 57.80 |
| Red | 93.66 | 82.41 | 85.89 | 1 662 061 491 | 6 330 715 | 5 000 258 | 0.08 | 36 219 | 40.47 | 9.10 |
| WinMask | 82.35 | 68.27 | 72.80 | 1 408 960 379 | 5 668 126 | 971 854 | 0.33 | 15 563 | 22.82 | 1.50 |
| phRAIDER | 84.66 | 70.34 | 74.98 | 1 447 164 002 | 1 868 048 | 1 396 725 | 0.03 | 13 123 | 115.95 | 21.40 |
| Mus musculus | ||||||||||
| RepLoc | 71.57 | 89.44 | 72.42 | 1 034 179 396 | 85 509 557 | 17 027 074 | 6.62 | 613 281 | 23.88 | 11.70 |
| Tallymer | 71.04 | 82.06 | 70.47 | 1 015 198 897 | 92 063 889 | 12 607 092 | 7.83 | 565 209 | 75.32 | 24.00 |
| Red | 66.60 | 76.73 | 65.57 | 918 070 891 | 59 121 015 | 10 459 466 | 5.30 | 527 817 | 78.53 | 8.80 |
| GRF | 60.81 | 79.94 | 61.38 | 900 984 319 | 48 454 914 | 10 742 424 | 4.42 | 270 293 | 149.22 | 64.00 |
| WinMask | 62.45 | 61.75 | 60.03 | 949 478 121 | 163 016 945 | 6 364 910 | 16.50 | 433 330 | 28.93 | 1.40 |
| phRAIDER | 43.76 | 61.26 | 44.04 | 591 931 802 | 14 963 277 | 6 768 816 | 1.38 | 295 621 | 82.30 | 21.80 |
| Homo sapiens | ||||||||||
| RepLoc | 67.30 | 85.57 | 67.89 | 1 190 032 803 | 102 056 428 | 28 757 056 | 6.16 | 716 463 | 24.22 | 11.70 |
| Tallymer | 65.93 | 63.74 | 64.85 | 1 144 451 245 | 105 103 160 | 16 578 923 | 7.74 | 648 553 | 149.47 | 25.70 |
| Red | 65.54 | 57.24 | 63.95 | 1 134 956 885 | 110 011 699 | 12 935 472 | 8.55 | 571 448 | 86.40 | 9.30 |
| GRF | 59.20 | 67.66 | 58.94 | 1 008 246 531 | 63 625 904 | 16 546 626 | 4.67 | 519 015 | 177.80 | 247.70 |
| WinMask | 58.29 | 38.50 | 56.02 | 1 104 198 589 | 206 414 002 | 3 464 958 | 18.38 | 569 385 | 32.47 | 1.50 |
| phRAIDER | 25.29 | 21.04 | 24.34 | 396 065 181 | 5 948 771 | 2 324 105 | 0.92 | 264 128 | 60.03 | 27.20 |
SECRs is the sensitivity to common repeats annotated by RepeatMasker. SESDs is the sensitivity to segmental duplications identified by SEDEF. SEARs is the sensitivity to all repeats merged from CRs and SDs. DEL is the total length of repeats detected by every tool in the table. URL is the total length of repeats detected by de novo tools but are unannotated by RepeatMasker or SEDEF. PRL is the total length of PRs that are not annotated but validated by BLAST. FDR is the false discovery rate. SPNum is the number of specifically detected repeats. WinMask is short for WindowMasker. The symbol ‘bp’ means base pair. ‘min’ is minute. ‘GB’ is gigabyte. The CPU cores used by RepLoc and GRF for A. thaliana, D. melanogaster, O. sativa, D. rerio, Z. mays, M. musculus and H. sapiens are 5, 7, 12, 20, 10, 20 and 20, respectively.
RepLoc outperforms other tools in sensitivities to CRs and SDs
RepLoc has the highest sensitivities to CRs in six species. In A. thaliana, Red achieves a slightly higher SECRs than RepLoc but also accompanied by a much higher FDR. The phRAIDER program has the lowest SECRs, especially in A. thaliana and H. sapiens. Note that in terms of percentage, RepLoc does not achieve much higher sensitivities than other tools, but it still has a considerable improvement in the length of detected repeats. For example, RepLoc can detect over 20 Mbp (~1.37% in proportion) CRs more than Tallymer in the human genome. Concerning the sensitivity to SDs, RepLoc shows consistently the highest SESDs. In A. thaliana, O. sativa and H. sapiens, phRAIDER and WindowMasker have lower SESDs but increased in Z. mays and M. musculus. For the sensitivity to ARs including CRs and SDs, RepLoc shows the highest SEARs in all species. In summary, these results indicate that the RepLoc program outperforms the other five tools in sensitivities to both CRs and SDs.
RepLoc improves the detection specificity
There is no mention in existing k-mer counting based tools of how to distinguish the boundaries of different repetitive sequences, which is critical for the detection specificity. By using a new merging strategy, RepLoc achieves the highest SPNum in six genomes, which would be beneficial for further clustering of repeats. It is found that RepLoc tends to have higher specificity in larger genomes. For instance, RepLoc can identify 716 463 specific repeats in the human genome, which is 67 910 more than the second-best tool, Tallymer. However, in A. thaliana, RepLoc detects fewer specific repeats than Tallymer (7761 versus 8039). Interestingly, the average length of the repetitive sequences specifically identified by RepLoc is ~260 bp longer than that of Tallymer in A. thaliana, so the total length of specific repeats detected by RepLoc is ~1.89 Mbp longer than Tallymer though the SPNum of Tallymer is higher. The genome size and repeat content could be factors affecting the detection specificity of RepLoc. It should be pointed out that in genomes with relatively short lengths and low repeat coverages (such as A. thaliana), RepLoc may not excel in detection specificity. In addition, the repeat composition of the genome may also have an effect on the detection specificity. In the human genome, the vast majority (~84%) of specific repeats detected by RepLoc but not detected by Tallymer belong to TEs, indicating that RepLoc has a certain preference for TEs. However, in the A. thaliana genome, the amount of TEs accounts for only ~31% of all repetitive sequences (~85% in the human genome), which may cause the suboptimal SPNum of RepLoc in A. thaliana. Besides, we also found that by adjusting the parameters of RepLoc, its performance in detection specificity can be improved to some extent (see Supplementary Table S1 available online at https://dbpia.nl.go.kr/bib). The WindowMasker program locates the highly repetitive segments without merging, making it more sensitive to smaller genomes. Therefore, it can be noticed that WindowMasker also shows relatively high SPNum in A. thaliana and D. melanogaster. In contrast, GRF and phRAIDER show relatively poor detection specificity in these two species.
RepLoc detects more PRs while keeping moderately low FDR
Compared with other tools, RepLoc consistently detects the most PRs in all seven species. For example, it can detect ~28.7 Mbp of PRs in the human genome, more than double the novel repeats identified by Red, of which approximately 8.7 Mbp are uniquely found by RepLoc. WindowMasker and phRAIDER detect the least PRL in seven genomes. On the other hand, RepLoc represents lower FDR than Red, Tallymer and WindowMasker in A. thaliana, D. melanogaster and H. sapiens. Red performs well in FDR control in O. sativa, D. rerio and Z. mays. GRF and phRAIDER show consistently low FDR in seven genomes but phRAIDER also produces lower sensitivities and specificities. These results indicate that RepLoc can detect more PRL while maintaining relatively low FDR. It should be noted that the FDR of RepLoc can be further reduced by setting a stringent filtering threshold, but the detection sensitivity may also be reduced.
RepLoc is efficient in runtime and memory usage
RepLoc uses the Python multiprocessing module to speed up the detection. The results show that RepLoc runs continuously faster than Red, Tallymer and GRF by using multiple CPU cores. Note that the RepLoc program will allocate a process for each chromosome, so we recommend running the program with the number of CPU cores that are the same as the number of chromosomes (limited by the amount of CPU cores in our server, we use 20 CPU cores for those genomes with more than 20 chromosomes in this study). In small genomes such as A. thaliana and D. melanogaster, WindowMasker runs the fastest. However, RepLoc becomes the fastest in four larger genomes (O. sativa, D. rerio, M. musculus and H. sapiens). For example, RepLoc needs only ~24 min (by using 20 cores), which is faster than Tallymer and GRF by many folds, to process the whole human genome. The peak memory usage of RepLoc depends on the k-mer counting step of Jellyfish. It requires ~11.7 GB to count 20-mers in the human and mouse genomes. Jellyfish allocates the same initial hash size for human and mouse genomes; thus, the memory usage is the same. The memory usage can be further reduced by using Bloom filters provided by Jellyfish. In larger genomes, Red requires slightly less memory than RepLoc (e.g. 9.3 GB for the human genome), but also runs much slower. WindowMasker shows the least memory consumption in all species but its sensitivities to CRs and SDs are very low. Tallymer and phRAIDER have similar memory consumption, while GRF needs huge memory in larger genomes (e.g. ~247 GB for the human genome). In a word, RepLoc is more efficient in terms of runtime and memory usage among the tools that perform well in detection sensitivity and specificity.
Extracting the ERs in potential SDs of the human genome
There are some ERs in certain SDs of the human genome. These sequences show a specific pattern on the Rmap. That is, some high peaks are inserted in regions with consecutively low repetitive scores. If those low background scores are above the filtering threshold, the ERs in these regions will be difficult to identify. This problem is common in existing k-mer counting based tools but has not been well addressed. Therefore, we provide a useful approach (named RepEM) accompanying RepLoc to extract the ERs (Figure 3A). The first step is to determine the repeat embedded regions (RERs). To achieve that, the locating program is run without –f limit to obtain peaks as long as possible. The abovementioned repetitive pattern causes the distribution of the score vector of the RERs to be skewed, that is, the ratio of the mean score to the median score is very high. Therefore, the peaks with a ratio above the threshold are extracted as RERs. Then, the locating program is run again with appropriate cutoff to remove the regions with low repetitive scores and extract the ERs by overlapping with RERs. With the help of RepEM, RepLoc is not only able to detect almost all repetitive sequences including SDs and CRs, but also can identify the ERs in some SDs. Here, we run the program on the human genome with a ratio of 100 and a cutoff of 24. Regions with a length of ~100 Mbp in the human genome are detected as RERs by RepEM. The RepLoc program can detect more regions (~72 Mbp) in RERs that belongs to SDs (Figure 3B). Initially, RepLoc’s detection specificity for repeats inserted into RERs was also low because all RERs will be output to detect more SDs. After running the RepEM program, only those ERs beyond the cutoff were extracted to improve the detection specificity. The results in Figure 3C show that compared to the other three tools, with RepEM, RepLoc can achieve the highest SPNum (23 100). WindowMasker also produces high SPNum (21 305) close to RepLoc because it always filters out the low repetitiveness regions. In short, the RepLoc program itself can detect more SDs than other tools, while incorporating RepEM, its detection specificity of identifying ERs in those RERs is also improved (Figure 3D).
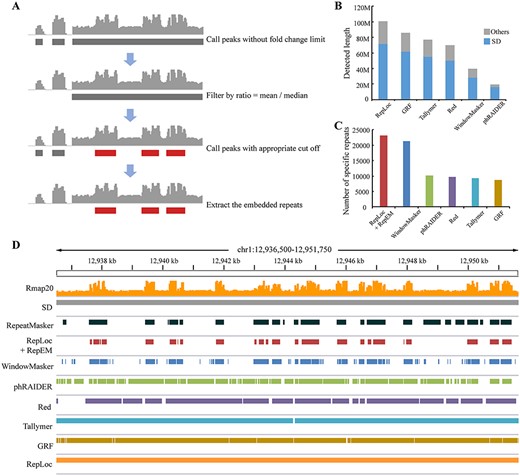
(A) The procedures to identify RERs and extract the ERs. (B) The repeat content detected by four tools in the RERs of the human genome. The SD regions detected are shown in blue and others in gray. (C) The SPNUM detected by RepLoc (incorporating RepEM) and other tools. (D) An example to show the repeats detected in chr1: 12 936 500–12 951 750. The RepEM program improves the detection specificity of RepLoc compared with other tools.
Case study on detecting repeats in human ribosomal protein genes (RPGs)
It has been well researched that the ribosomal RNA genes (rDNA) are containing highly repetitive structures [53]. However, there are few studies on the analysis of repeats in the RPGs, which have been identified more than 2000 copies in the human genome [54, 55]. Here, we retrieved 2527 RPGs (14.32 Mbp in length) in the human genome from NCBI to investigate the repetitive sequences in these genes as a case study. According to the results of de novo detection tools on the human genome, RepLoc detected 5.71 Mbp repetitive sequences in the RPGs (5.20 Mbp by Red, 5.49 Mbp by Tallymer, 4.85 Mbp by WindowMasker, 4.89 Mbp by GRF and 1.84 Mbp by phRAIDER), of which 4.97 Mbp are also annotated by RepeatMasker or SEDEF (4.55 Mbp for Red, 4.75 Mbp for Tallymer, 3.85 Mbp for WindowMasker, 4.37 Mbp for GRF and 1.81 Mbp for phRAIDER). Besides, RepLoc identified 0.34 Mbp Blast-confirmed PRs in these RPGs (0.16 Mbp by Red, 0.26 Mbp by Tallymer, 0.01 Mbp by WindowMasker, 0.23 Mbp by GRF and 0.44 Kbp by phRAIDER). These results prove that RepLoc can achieve high sensitivity with relatively low FDR and can locate more PRL. Compared with other tools involved in this case study, RepLoc is a more efficient tool for de novo repeat detection. Moreover, RepLoc uniquely detected 926 novel repetitive sequences (~69 Kbp in length) in 2527 RPGs, which may benefit further research on structural and functional analysis of RPGs.
Discussion
Key parameters of RepLoc
To choose an appropriate k-mer size and determine the default parameters are helpful for using RepLoc. K-mer size selection is a challenge for most k-mer counting based repeat detection tools. For a sequence of length L, a k-mer length of log4(L) is often used by some methods [34–36]. That is, the k-mer size would be 15–16 bases for the human genome. However, the situation is different for RepLoc and Tallymer. RepLoc and Tallymer will merge adjacent repetitive units whose gap sizes are within the threshold. Therefore, moderately lower k-mer coverage is preferred to reduce false positives. We calculated the genome coverage of repetitive k-mers (count ≥ 2) with different lengths (10–50) for seven organisms (Figure 4A). The genome coverage in the human genome is extremely high in the case of short k-mer length (~95% for k = 16) and most regions will be regarded as repetitive sequences, leading to high false positives. When the k-mer length reaches 20, the coverage is decreased to ~56%. It can be seen in the figure that the coverage of the maize genome is continuously high for the k-mer length in the range of 10–50 because the maize genome is extremely repetitive. According to our analysis, a k-mer length of floor[log4(L)] + 5 would be appropriate for processing most genomes using RepLoc. In this study, the k-mer length of 18 is chosen for A. thaliana and D. melanogaster, 19 for O. sativa and 20 for D. rerio, M. musculus and H. sapiens, respectively. For Z. mays the k-mer size is also set to 20 and the performance of RepLoc is still good though the coverage of 20-mers is ~88% in maize. As a result, RepLoc consistently detects more repeats in seven genomes than other tools by using the above k-mer lengths (Figure 4B). Gap size and fold change thresholds are another two important parameters affecting the sensitivity and specificity of RepLoc. The gap size is set to 3 k (k is the k-mer length) in the Tallymer pipeline but the optimal gap size and fold change values may vary for different species according to our research. To find the appropriate values, we set different combinations of gap size (g = 2 k, 50, 3 k) and fold change (f = 10, 100, 1000) for RepLoc to investigate its performance on seven species (see Supplementary Table S1 available online at https://dbpia.nl.go.kr/bib). The results indicate that larger gap size and fold change thresholds will allow more repetitive segments to be merged, which increases the detection sensitivity but also decreases the accuracy at the same time. For the detection specificity, smaller gap size (g = 2 k) and fold change (f = 10) will generate higher SPNum in smaller species like A. thaliana and D. melanogaster. However, in larger genomes like M. musculus and H. sapiens, higher SPNum is achieved with larger gap size (g = 3 k) and moderate fold change (f = 100). Therefore, to meet most situations, we use 50 (between 2 and 3 k for most species) as the default threshold for gap size and 100 as default for fold change. Besides, although we use the default gap size and fold change for all seven species, the results of RepLoc are consistently good (Figure 4B).
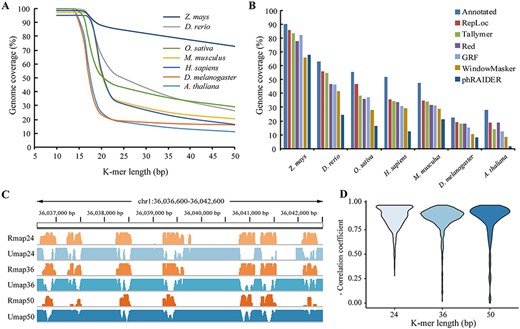
(A) The genome coverage of high frequency k-mers (count ≥ 2) with lengths from 10 to 50 for seven organisms. (B) The percentage of annotated repeats and de novo detected repeats in the genomes. Total annotated repeats are the union of CRs and SDs. Total de novo detected repeats are calculated by DEL − URL + PRL. (C) The Rmap and Umap with k-mer lengths of 24, 36 and 50 on chr1: 36 036 600–36 042 600. (D) The negative correlation coefficients between Rmap and Umap of 2400 randomly generated sequence regions with a length of 1 Kbp.
Classifying different repeat families
Due to the complexity of repeat composition and variance, it is difficult for de novo repeat detection tools to divide the detected repeats into different families. None of WindowMasker, Tallymer and Red can solve this problem. Some of the previous tools, such as RECON and RepeatScout, provide efficient approaches for defining the repeat boundaries to help classify the repeats into families. In this study, we also use a more accurate merging strategy to improve RepLoc’s ability to distinguish repeat boundaries. It should be noted, however, that RepLoc is designed to identify boundaries between adjacent repeats that differ by a certain level of repetitiveness. Those adjacent repeats with similar repetitiveness still cannot be classified by RepLoc. The clustering methods used by GRF and phRAIDER may be useful for further classifying the repeats detected by RepLoc, which will be our future research direction.
Identifying SDs
The results in this study have shown that RepLoc can detect more SDs than other tools in the comparison. One reason is that RepLoc only filters out those k-mers that count less than two times in the genome. In Tallymer and Red, the cutoff is set to 3 so those two copies of SDs cannot be detected by them. Note that although RepLoc can detect a large amount of SDs in the genome, it still cannot distinguish them from CRs. The RERs detected by RepEM can be potential SDs, for example, 72% of the RERs obtained by RepLoc in the human genome belongs to SDs. Despite there are some tools designed to identify SDs specifically [42, 56, 57], all of them need to use the RepeatMasker to mask the genome first. Therefore, the Rmap generated by RepLoc may provide an independent approach to identify SDs. The binary segmentation strategy in time series analysis may be useful to identify and extract the special pattern of SDs on the Rmap.
Association with genome mappability
One of the advantages of RepLoc is the quantitative Rmap that reveals the sequence repetitiveness of the whole genome. We have shown that gene body regions are showing specific repetitiveness patterns, indicating potential relationships between sequence repetitiveness and genome structure. It can be noticed that genome mappability may also in correlation with the Rmap. Genome mappability is proposed to measure the extent to which the genome regions can be uniquely mapped [58–61], which is very useful in short reads sequencing data analysis (e.g. ChIP-Seq). It has been noted that repetitive sequences are the main reason for low mappability. Reads generated by repetitive regions are usually mapped to multiple locations in the genome, leading to uncertainty in estimating expression abundance and epigenetic modification signals. We further generated the Rmap (k = 24, 36 and 50) for the human genome and compared them with the Umap tracks generated by Umap [61]. Those regions with high repetitive scores on the Rmap also show low mappability on the Umap (Figure 4C). We randomly selected 2400 regions (100 per chromosome) with a length of 1000 bp in the human genome and calculated the correlation coefficient between Rmap and Umap for each region. The overall results show strong negative correlations between Rmap and Umap (−0.81 for k = 24, −0.80 for k = 36 and −0.78 for k = 50). There are also regions where the correlations between Rmap and Umap are low, especially when the k-mer length is 50 (Figure 4D). One possible reason is that the Rmap is currently calculated based on exact k-mers, but mismatches are allowed when mapping reads to the reference genome. Thus, it may be not appropriate to use the Rmap directly for mappability analysis. To count approximate k-mers [62] can be a possible approach to address this problem.
Conclusion
Analysis of DNA repeats has been going on for decades. The Rmap generated by some k-mer counting tools has been shown to be useful for identifying high copy repeats in the genome. Despite these tools are time and memory efficient and can achieve good performance, their deficiencies in terms of repetitive score calculation, repeat boundary distinguishing, sensitivity to SDs and other areas still can to be improved. To address these concerns, we developed RepLoc, a new computational method for decoding the genome repetitive pattern and de novo repeat detection. The benchmark shows the following advantages of RepLoc: First, RepLoc outperforms other k-mer counting based tools on sensitivities to both CRs and SDs. Second, the new merging strategy helps RepLoc to improve the specificity for detecting repeats. Third, RepLoc can detect more PRL while keeping relatively low FDR. Further, RepLoc runs very fast by using multiple CPU cores, and the memory usage is moderately low while achieving good performance. In conclusion, RepLoc is a more efficient k-mer counting based de novo approach for capturing the repetitive sequences in the genome. In addition, the Rmap generated by RepLoc has shown associations with genome structure and genome mappability. Therefore, we also hope that the application of RepLoc in construction of the sequence Rmap will provide new insights into quantitative genome analysis.
RepLoc is a rapid and memory-efficient approach for sequence repetitiveness quantification and repeat detection.
RepLoc achieves high sensitivities and specificities to both common repeats and segmental duplications based on weighted k-mer coverage and robust repeat merging methods.
The repetitiveness map generated by RepLoc is correlated with genome structures and can be used for quantitative genome analysis.
Funding
This work was supported by the National Key Research and Development Program of China (No. 2018YFC0310602, 2016YFA0501704), National Natural Sciences Foundation of China (No. 31771477, 31571366), the Fundamental Research Funds for the Central Universities, Jiangsu Collaborative Innovation Center for Modern Crop Production and Collaborative Innovation Center for Modern Crop Production co-sponsored by province and ministry.
Conflict of interest
The authors declare that there is no conflict of interest.
Cong Feng is a PhD candidate in Ming Chen’s laboratory in Zhejiang University. His research focuses on DNA repeat detection and genome analysis.
Min Dai is a PhD candidate in the Key Laboratory of Genetic Network Biology, Institute of Genetics and Developmental Biology, Chinese Academy of Sciences. He was a member of Ming Chen’s laboratory in Zhejiang University. His research focuses on repeat analysis and single-cell omics.
Yongjing Liu is a PhD candidate in Ming Chen’s laboratory in Zhejiang University. His research interests include cancer genomics and multi-omics analysis.
Ming Chen is a full professor in the Department of Bioinformatics, College of Life Sciences, Zhejiang University. His current research focuses on establishing useful bioinformatics tools and platforms to help biologists browse and analyze massive biological datasets.
