


Abstract
The analysis of the SARS-CoV-2 genome datasets has significantly advanced our understanding of the biology and genomic adaptability of the virus. However, the plurality of advanced sequencing datasets—such as short and long reads—presents a formidable computational challenge to uniformly perform quantitative, variant or phylogenetic analysis, thus limiting its application in public health laboratories engaged in studying epidemic outbreaks. We present a computational tool, Infectious Pathogen Detector (IPD), to perform integrated analysis of diverse genomic datasets, with a customized analytical module for the SARS-CoV-2 virus. The IPD pipeline quantitates individual occurrences of 1060 pathogens and performs mutation and phylogenetic analysis from heterogeneous sequencing datasets. Using IPD, we demonstrate a varying burden (5.055–999655.7 fragments per million) of SARS-CoV-2 transcripts across 1500 short- and long-read sequencing SARS-CoV-2 datasets and identify 4634 SARS-CoV-2 variants (~3.05 variants per sample), including 449 novel variants, across the genome with distinct hotspot mutations in the ORF1ab and S genes along with their phylogenetic relationships establishing the utility of IPD in tracing the genome isolates from the genomic data (as accessed on 11 June 2020). The IPD predicts the occurrence and dynamics of variability among infectious pathogens—with a potential for direct utility in the COVID-19 pandemic and beyond to help automate the sequencing-based pathogen analysis and in responding to public health threats, efficaciously. A graphical user interface (GUI)-enabled desktop application is freely available for download for the academic users at http://www.actrec.gov.in/pi-webpages/AmitDutt/IPD/IPD.html and for web-based processing at http://ipd.actrec.gov.in/ipdweb/ to generate an automated report without any prior computational know-how.
Introduction
Understanding the genome variability and evolution of pathogens with pandemic potential is fundamental to mount an effective response to contain the pandemic. Several multicenter collaborative sequencing efforts are underway to characterize the COVID-19 pandemic causal agent, severe acute respiratory syndrome coronavirus 2 (SARS-CoV-2), that has resulted in more than 800 000 deaths worldwide [1]. These include the initiatives taken by the SARS-CoV-2 Sequencing for Public Health Emergency Response, Epidemiology and Surveillance (SPHERES), CDC USA [2], Covid-19 Genomics Consortium (COG) UK [3], 1000 genome sequencing of SARS-CoV-2, and DBT-India [4], which have resolved to perform extensive regional sequencing of the viral isolates to understand the transmission dynamics and to derive information on the diagnostic and therapeutic targets, using next-generation sequencing (NGS) technology [5–8].
The NGS-based characterizations have contributed to the growing insights into the SARS-CoV-2 genome organization and transcriptional complexities [9–11]. Short-read–based sequencing is most commonly employed, with COVID-Seq as one of the first FDA-approved NGS-based diagnostic tests [12, 13], for quantitative detection of SARS-CoV-2 [14–16]. Besides, traditional shotgun sequencing-based meta-transcriptome analyses are being used in the context of the microbiomes from human samples [17]. Similarly, Oxford Nanopore and PacBio long-read advanced sequencing techniques with read length >2 Kb RNA stretches (direct RNA method) have allowed elegant assessment of translocations, structural variants and SARS-CoV-2 genome architecture [9].
Accordingly, several computational protocols for quantification and analysis of pathogens/microbes from metagenomic, transcriptomic, as well as human genomic data generated using short-read NGS platforms have been developed to identify known and novel pathogens [18–24]. Similar quantification and variation analysis protocols have also been developed to handle the long-read sequencing data [25]. However, multiple advanced sequencing platforms in use possess a unique challenge of heterogeneity in the type and quality of the data generated, with an unmet need for a tailored computational pipeline with application to the current SARS-CoV-2 pandemic to derive valuable information from the genomic datasets and help understand the viral evolution. Uniform analysis of the heterogeneous advanced sequencing datasets demands development of robust and inclusive computational methods. Here, we introduce the Infectious Pathogen Detector (IPD), an automated pathogen analysis pipeline for seamless analysis of data from a diverse form of advanced sequencing platforms. It is available as a GUI-enabled desktop application as well as a web-based application. IPD performs integrated variants analysis, along with systematic quantification of pathogen genomes. IPD additionally has an in-built SARS-CoV-2 analysis module, for assignment of viral clades of the samples analyzed and an automated report generation. We validate the results obtained from IPD using orthologous quantification technique and benchmark against previously published methods using real and simulated sequencing dataset. We further demonstrate the utility of the IPD for analysis of SARS-CoV-2 samples.
Materials and Methods
Reference database and annotation
The pathogen reference genome is composed of 1060 infectious pathogens, constituting 192 viral strains and 868 bacterial species (detailed list provided in Supplementary Table S1 available online at https://dbpia.nl.go.kr/bib). The pathogen list is mainly derived from FDA-ARGOS database [26] and literature, including the human SARS viruses from NCBI Virus [27]. The complete genomes have been downloaded from NCBI Genomes database in GenBank format and parsed using in-house BioPython [28] scripts to generate genome statistics, a pathogen sequence (FASTA) and an annotation (GFF) file. The human reference genome sequence and annotation was obtained from GENCODE database (GRCh38, version 33.p13) [29]. A database constituting 29 110 reference prokaryotic and viral genomes was obtained from NCBI RefSeq [30] and has been termed as a secondary database in the pipeline. The installed IPD primary database of 1060 pathogens can be further updated to include the pathogen of user’s choice, using the ‘ipdupdatedb.py’ script, provided with the package.
Implementation of IPD desktop and web-based pipeline
IPD pipeline is mainly implemented in python and partly shell programming has been used. Parallel processing of the pathogen quantification and variant calling modules (detailed module description below) is achieved using the multiprocess package [31] in python. The graphic user interface (GUI) for the desktop version is developed using the python Tkinter library [32]. For the web-based IPD application, the server-side scripts have been developed using PHP. The data submitted on the job form (web page) are stored in the SQLite database on the server. A python-based custom job-queuing script performs check on the new job submissions and performs their execution. Upon completion of the job, the analysis results, pathogen counts (TSV), annotated variants (VCF) (and SARS-CoV-2 specific report, if opted for), are sent to the user via email using a custom PHP-based mailer script.
IPD analysis modules
The analysis pipeline consists of the (a) data assessment and alignment module, (b) integrated pathogen quantification and variant calling module, and (c) SARS-CoV-2 analysis module. A detailed pipeline workflow of IPD has been shown in Figure 1 and the GUI in Supplementary Figure S1 is available online at https://dbpia.nl.go.kr/bib.
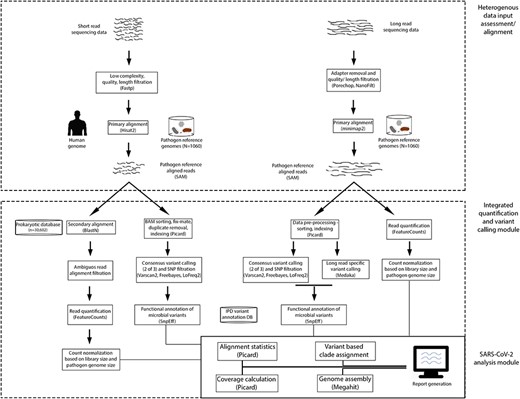
Analytical pipeline of IPD. The pipeline is composed of three modules: (A) heterogeneous data filtration/alignment, (B) integrated variant calling and quantification, and (C) specialized SARS-CoV-2 analysis module.
Data assessment and alignment module
IPD pipeline begins with filtration of reads with low sequencing quality and short length, followed by alignment. For short-read analysis, reads with average Phred quality less than 20, sequence complexity less than 30% and read length below 40 are filtered out using fastp [33]. The reads qualifying these filters are further aligned to the primary reference database consisting of 1060 pathogen and the human genome, using Hisat2 [34]. For long-read analysis, the input data are to adapter trimming using the default library of PoreChop [35]. The trimmed reads having quality less than Q13 and length less than 500 are filtered using NanoFilt [36]. The filtered reads are aligned to the pathogen (1060) genome using minimap2 [37].
Integrated pathogen quantification and variant calling module
Normalized pathogen quantification
For both the short- and long-read data, the aligned SAM files are converted to BAM and are indexed using Samtools (version 1.10) [38]. Since short reads may show multialignments, an additional step of ambiguous alignment filter is introduced. The reads aligned to the pathogen are further subject to secondary alignment to complete NCBI bacterial and viral genomes using BLAST [39]. The reads showing an alignment of comparable or greater identity with genomes other than one reported in primary alignment are filtered. These genus-specific reads are further subject to quantification using FeatureCounts tool [40]. For paired-end data, fragment-based counting option is used, making it theoretically comparable to the single-end count data. The fragment-based counts are further subject to normalization: (a) conversion of the fragment counts to fragments per million (FPM) for each pathogen (i.e. fragments in a feature * 106/total number of fragments sequenced for a sample), (b) FPM divided by the genome length of the pathogen to convert it to FPKM. A tabulation of pathogen name, genome length, number of fragments, FPM and FPKM is provided as an output from this module.
Variant calling module
Broadly, this module is sub-divided into alignment file pre-processing, consensus variant calling and variant annotation. For short-read data, the aligned reads undergo mate fixing (for paired-end data), duplicate removal and re-indexing using the Picard toolkit [41]. Further, the pre-processed files are subject to consensus variant calling with VarScan2 [42], LoFreq [43] and FreeBayes [44]. A variant called by at least two callers out of the three is retained. Selection of these three variant callers, to be used in IPD, was based on the previously reported accuracy assessment on microbial genomic data [45]. For long-read data, the sorted aligned files are subject to consensus variant calling as described for short reads. In addition, we call variants using Medaka [46], which is built for analyzing the long-read data. A variant that is common among the consensus calling process and is also called by Medaka is retained. Among the common variants, the ones having a quality of less than 20, depth of less than 10 and alternate allele fraction of less than 0.75 are filtered. Finally, the filtered variants are annotated using SnpEff [47], using a custom annotation database for the 1060 pathogens.
Identification of closest SARS-COV-2 isolate and phylogenetic clade assignment
To generate a database of the SARS-CoV-2 variants of the isolates from all over the world, we downloaded complete (>29 Kb), high-coverage genomes from the GISAID database (N = 23 367, as of 11 June 2020) [48] and performed variant identification using Snippy [49] by keeping the Wuhan reference isolate genome (RefSeq ID: NC_045512) as the reference. We identified 162 448 (11 739 unique) variants, which constitute the SARS-CoV-2 reference variant database for IPD. We constructed a phylogenetic tree based on the divergence of genomes of isolates from GISAID based on the variants identified by Snippy (Supplementary Figure S2 available online at https://dbpia.nl.go.kr/bib). We obtained the metadata from the GISAID database, which also contains the Pangolin and GISAID clade information for each isolate. Merging the variant database and metadata allowed us to map the specific variants representing a clade. The variants identified from the variant calling module of IPD are used to create a mutation profile for a sample. The mutation profile is compared using Euclidean distance against the variant-based mutation profiles in the database of isolates. The isolate showing the lowest relative distance is selected and its clade is extracted from the database, allowing clade assignment based on the genomic variants. Conceptual algorithm describing the same is represented in Figure 2.
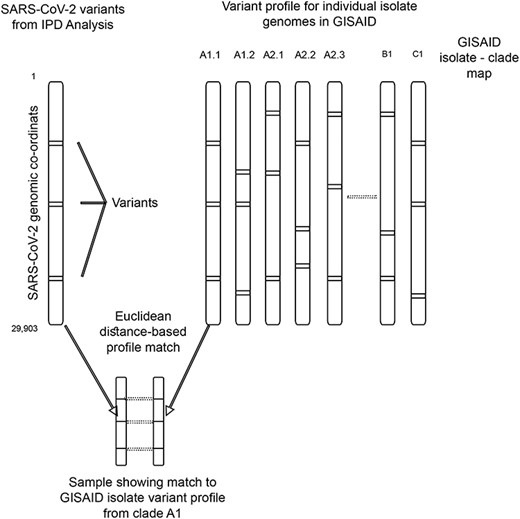
Conceptual algorithm to compute and assign phylogenetic clades based on the variants obtained in a sample, using GISAID-based IPD variation database as reference.
SARS-CoV-2 analysis module and automated report generation
The module is developed to specifically analyze and visualize the SARS-CoV-2 sequencing data. This module takes the files generated by the IPD workflow as input. Mainly the module performs four distinct functions: (a) alignment statistics computation, (b) SARS-CoV-2 genome coverage plot generation, (c) k-mer–based genome assembly and tertiary alignment, (d) variant based clade assignment and isolate distance estimation. The alignment statistics are generated using Picard toolkit and the genome coverage is calculated using bedtools [50]. Matplotlib [51] python package is used for generation of plots in the report. Assembly using the pathogen reads is performed using MEGAHIT tool [52]. Additionally, variants obtained from the variant calling module of the IPD are searched in the IPD SARS-CoV-2 variant database. This module also reports the novel variants obtained in the samples, along with the matching clade and closest isolates, assigned by retrieving the number of common variants among the samples analyzed and the isolates in the SARS-CoV-2 variant database. Finally, the module generates an HTML report of the analysis performed using the python Markdown package [53].
Assessment of IPD quantification and variant calling pipeline
qPCR validation of Fusobacterium nucleatum from in-house primary tumor and cell line samples
We re-analyzed 68 in-house exome and transcriptome data of clinical cancer specimens and four cell lines [54, 55] using IPD pipeline. Of the 68 samples analyzed, qPCR-based F. nucleatum quantification was performed for 33 samples, where adequate RNA was available. We performed IPD quantification on these transcriptome samples to check for the pathogen load. PCR was performed using the primers and protocol described earlier in the study [56], and the protocol for samples procurement and qPCR quantification is detailed in Supplementary Methods available online at https://dbpia.nl.go.kr/bib.
IPD quantification benchmarking
For benchmarking the short-read quantification pipeline of IPD, we analyzed (a) public meta-transcriptomic SARS-CoV-2 (50 positive and 21 negative) sample data from SRA database [57], (b) Fusobacterium-positive in-house oral patient tumor samples (exome + transcriptome) (n = 13) and negative cell lines (n = 4), as confirmed by qPCR and (c) Human Papilloma Virus (HPV) positive (n = 32) and negative (n = 56) head and neck cancer tumor samples from The Cancer Genome Atlas (TCGA-HNSC) [58]. Downloading and pre-processing of the TCGA-HNSC RNA-Seq data have been described in Supplementary Methods available online at https://dbpia.nl.go.kr/bib in detail. IPD pipeline, along with GATK-PathSeq [21], Kraken2 [20] and PathoScope 2.0 [59], has been evaluated based on the truth set of the above three dataset. For long-read quantification evaluation, 29 (20 MERS and 9 SARS-CoV-2) simulated datasets, with varying read length and coverage, were generated using the neat-genreads [60] tool (details in Supplementary Methods available online at https://dbpia.nl.go.kr/bib). The IPD quantification was evaluated against the long-read quantification pipelines NanoSPC [25] and minimap2 + Nanocount [37, 61].
IPD variant analysis benchmarking and clade assignment assessment
In total, 36 simulated samples were generated using the neat-genreads [60], for SARS-CoV-2 genomes representing lineage A (EPI_ISL_404895; GISAID clade ‘S’), lineage B (EPI_ISL_452360; GISAID clade ‘L’) and sub-lineage B.1.1 (EPI_ISL_455479; GISAID clade ‘GR’). For each representative genome, a combination of three varying genome coverages of 10×, 100× and 1000× and four background mutation models (M = 0, 0.0001, 0.0003, 0.0005) to simulate the background mutations that might be acquired by the SARS-CoV-2 genome during the course of evolution, we introduced random mutations (using the -m option in neat-genreads simulation tool) and evaluated its effect on the clade prediction ability of the IPD. Prediction accuracy was measured by scoring the right prediction (exact matching clade) as ‘1’, sub-class match (when the predicted lineage being a sub-lineage of the original clade) as ‘0.5’ and ‘0’ in case of a mismatch. Short-read variant calling of IPD was compared against Snippy [49], PHEnix [62], NovoAlign + GATK [63, 64] and Hisat2 + Strelka [34, 65]. Similarly, we simulated 27 long-read samples (read length = 5000) by using the three mutation models (M = 0, 0.0001, 0.0003) for the above-mentioned SARS-CoV-2 genomes. Long-read variant calling by IPD was compared against four pipelines/tools, namely Snippy [49], Clair [66], Longshot [67] and SNVer [68].
Accuracy evaluation of the pathogen analysis pipelines
Statistical evaluation of the quantification and variant calling accuracy of the IPD was performed and compared using the F-score metric as described below. The total number of true positive (TP), false positive (FP) and false negative (FN) for the presence of pathogen was used to calculate F-score (F), sensitivity (S) and precision (P) in case of comparison of pathogen quantification, as defined in the study [18]. In short, the following calculations were performed: precision = TP/(TP + FP), sensitivity = TP/(TP + FN), F-score = 2/(S−1 + P−1). For variant calling, the metric suggested in this study [69] was used to calculate the F-score for variant analysis, F-score = 2TP/(2TP + FP + FN), and the precision and the sensitivity were calculated in the similar manner as for quantification pipeline.
Analysis of SARS-CoV-2 sequencing dataset
In total, 1500 samples, including 1095 short- and 405 long-read sequencing datasets were analyzed using IPD. The short-read samples consisted of 1035 SARS-CoV-2 positive (meta-genome/transcriptome and human cell line co-culture transcriptome) samples, 16 MERS positive and 44 SARS-CoV-2 negative meta- and in-house human transcriptome samples, constituting the pre-COVID-19 pandemic probands. The 405 long-read data were mainly clinical samples, sequenced using the Nanopore direct transcript sequencing. The literature-based, 1464 sequenced samples used in the analysis were downloaded from the SRA database [57]. Complete list of sample sets (with metadata) included in the analysis has been listed in Supplementary Table S3 available online at https://dbpia.nl.go.kr/bib, and the total sequencing yield for the individual project used in the analysis has been shown in Supplementary Figure S3 available online at https://dbpia.nl.go.kr/bib.
Results
IPD-based quantification of pathogens from short- and long-read sequencing datasets
We analyzed 1095 short- and 405 long-read data, consisting of SARS-CoV-2–positive, MERS-positive and pre-pandemic proband samples using IPD (as accessed on 11 June 2020). The short-read SARS-CoV-2–positive samples were identified to be virus positive by IPD (Figure 3A, left panel), wherein the abundance ranged from 5.055 to 999655.7 FPM (median = 990828.9). Such high viral abundance in the samples is observed, as most of the meta-transcriptome samples have been enriched for the SARS-CoV-2 virus. We also identified background abundance of SARS-CoV virus in the SARS-CoV-2–positive sample set, which could be attributed to the high genome conservation between the two viruses [70]. To check the specificity of the pipeline to differentiate between other members of SARS family of viruses, we included 16 MERS-positive meta-transcriptome samples, showing an abundance in the range of 22.7–455997.7 FPM (median = 583.7) and 44 human transcriptomes comprising the pre-pandemic probands. We observed diverse commensal, opportunistic pathogens across the samples analyzed (Supplementary Figure S4A available online at https://dbpia.nl.go.kr/bib). We performed a correlation of abundance of the background level bacterial pathogens with the SARS-CoV-2 quantification, but no significant correlation was found in the analyzed dataset consistent with a recent report [71]. Since we analyzed SARS-CoV-2–positive samples from different sample sources (nasal/pharyngeal) and also of different sequencing/library types, we performed statistical tests to assess differential burden of background infectious bacteria. However, we did not observe significant enrichment of background infections in the analyzed samples, with respect to either the site of sample collection or sequencing library type. IPD quantification on 416 long-read samples (11 samples failed data quality filters) showed that SARS-CoV-2 abundance in the range of 38161.32 −1.0 × 10⁶ FPM (median = 106 FPM). The long-read samples analyzed showed a specific abundance of the SARS-CoV-2 virus and very little or no abundance of other pathogens in the samples, probably due to target selection/capture protocols (Figure 3A, right panel). In addition, we observed the background traces of multiple pathogenic bacteria in the long-read sample set, which have been shown in Supplementary Figure S4B available online at https://dbpia.nl.go.kr/bib.
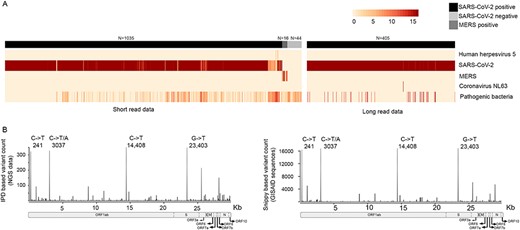
Integrated pathogen quantification and variant analysis using IPD (A) heatmap representation of the pathogens having minimal burden of 1 FPM in at least 1% of the samples in both short-read (left-panel) and long-read (right panel) data. The sample set consisted of 1440 SARS-CoV-2–positive (1035 short and 405 long read), 16 MERS-positive and 44 SARS-CoV-2–negative samples. Left panel shows bacterial pathogens summed up into a single entity in the plot as ‘Pathogenic bacteria’. A detailed heatmap of bacterial pathogens has been provided in Supplementary Figure S3 available online at https://dbpia.nl.go.kr/bib. (B) IPD-based variant analysis of publicly available SARS-CoV-2–positive sequencing samples; left panel shows the position-wise mutation count generated by IPD variant analysis of short- (n = 1095) and long-read (n = 405) sequencing data. The right panel shows the mutation distribution of the Snippy-based variant analysis of the GISAID genomes (n = 23 376). The hotspot mutation positions (241, 3037, 14 408, 23 403) are marked in the plot along with the common mutant alleles observed in the IPD-based and Snippy-based analysis, respectively. X-axis (bottom) shows the overlay of the gene annotations of the SARS-CoV-2 (arrows are used to indicate specific genes in the genome).
IPD-based pathogen variant analysis and phylogenetic clade assignment
In the above-mentioned 1500 (1095 short-read and 405 long-read) sample dataset, IPD variant analysis pipeline identified variants in SARS-CoV-2, Human mastadenovirus, Escherichia spp., Acinetobacter spp., Psychrobacterspp., Prevotella spp. and others (Supplementary Figure S5 available online at https://dbpia.nl.go.kr/bib). Distribution of 4634 SARS-CoV-2 variants (~3.05 variants per sample) across the genome (Figure 3B, left panel) shows hotspot mutations (>300) at the positions 241 in the 5′ leader sequence, 3037 and 14 408 in the ORF1ab gene and 23 403 in the S gene. These mutations have been described as predominant in the population from the early SARS-CoV-2 genome-based analysis [72]. To validate the presence of these mutations in the isolates deposited in the public domain, we compared the mutation distribution of the IPD analyzed samples with the distribution in the IPD variant database (generation of database described in the Materials and methods). The mutation distribution obtained (Figure 3B, right panel) was found to be comparable to the result of the IPD variant analysis pipeline, with identical hotspot mutations. In addition, we identified 449 novel variants (listed in Supplementary Table S4 available online at https://dbpia.nl.go.kr/bib) in the IPD variant analysis of 1500 samples, which were not found in the GISAID viral isolate sequences.
Using the variants generated by analysis of NGS samples using IPD, we further performed phylogenetic clade assignment. From the analyzed 1500 samples, we chose the paired-end high-coverage (N = 100) samples to test the clade assignment in SARS-CoV-2 analysis module. Total data yield for the selected samples ranged from 88 000 to 1.4 million reads. Phylogenetic clade analysis identified 86% of the samples to be of clade B, of which 62 samples have closest SARS-CoV-2 isolate in B.1 branch. When we checked for the source (country/region) of the analyzed samples, we found that 62% of the samples assigned to B1 clade were from the USA and Australia. The predominance of B1 clade has already been reported as one of the most active virus lineages in Europe and North America [73], making our variant-based clade assessment consistent with the literature. Detailed report of the phylogenetic clade assignment for the 100 selected samples is shown in Supplementary Table S5 available online at https://dbpia.nl.go.kr/bib. This result showcases the utility of IPD in tracing the genome isolates by inferring the phylogenetic information from the genomic data.
Validation of the IPD results using orthologous technique and benchmarking against other tools
The IPD pathogen quantification revealed the presence of F. nucleatum, a commensal microbe in the oral cavity and an opportunistic pathogen, across 68 in-house primary tumor samples [74]. Presence of the Fusobacterium was confirmed using qPCR-based quantification, and extended validations were also performed in 24 human cell lines. As anticipated, all the cell lines were negative for F. nucleatum, as they undergo antibiotic treatment as a part of a routine maintenance procedure. Overall, of all the samples called positive (n = 29) by qPCR (CT value <30), IPD could identify all 29 samples to be positive and 0 false negatives. However, IPD did classify three borderlines (Ct-value 30.4–30.5) samples to be positive for Fusobacterium, whereas all the negative cell-line samples (n = 4) were detected to be negative by the IPD. This accounts for sensitivity of 100% and specificity of 90%. The qPCR results for all the in-house tumor samples and cell lines have been tabulated in Supplementary Table S2 available online at https://dbpia.nl.go.kr/bib.
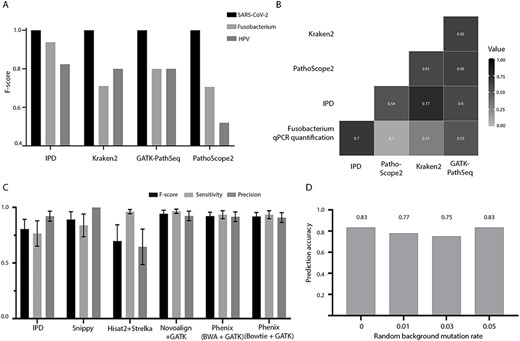
IPD benchmarking (A) F-score plot for short-read quantification for SARS-CoV-2 (N = 71), F. nucleatum (N = 17) and HPV (N = 88) truth set, (B) correlation matrix of the normalized qPCR load of F. nucleatum with the quantification using IPD, PathoScope2, Kraken2 and GATK-PathSeq. Negative correlation between the qPCR data and the quantification by all the tools has been multiplied with minus one for representation of (C) F1-score, sensitivity and precision of different variant calling tools/pipelines on the SARS-CoV-2–simulated short-read dataset (N = 36), (D) accuracy of SARS-CoV-2 lineage prediction by IPD SARS-CoV-2 module, based on the variants derived from short- and long-read samples (N = 53). The X-axis denotes the random background mutation rate introduced in the simulated dataset.
We rigorously evaluated the quantification, variant calling and phylogenetic clade assignment (in case of SARS-CoV-2) ability of IPD and benchmarked against tools/pipelines in the respective segment. As described in Materials and methods, the F-score metric was used to assess the accuracy of each tool. To evaluate the accuracy of IPD to detect different types of pathogens (RNA/DNA virus and bacteria) from NGS data, we analyzed publicly available SARS-CoV-2 transcriptome samples from COVID-19 patients, HPV samples from head and neck tumor transcriptome and in-house oral tumor exome and transcriptome samples with the varying burden of F. nucleatum. All the tools performed with 100% precision and 100% sensitivity (F-score = 1), for the SARS-CoV-2 dataset (Figure 4A). To further assess the quantitative coherence of IPD with the qPCR results, we performed a Spearman correlation between IPD normalized pathogen counts with the normalized Ct values (delta Ct) for F. nucleatum. We observed that IPD showed highest (inverse) correlation with the delta Ct (r = −0.7, P-value < 0.05), followed by PathSeq (r = −0.53, P-value < 0.05) and Kraken2 (r = −0.31, P-value < 0.05) (Figure 4B). In case of long-read quantification pipeline, IPD along with other tools gives the ideal F-score of 1, even with varying genome coverage (10–1000×) and read lengths (1000–4000 bp) (Supplementary Figure S6 available online at https://dbpia.nl.go.kr/bib).
Among the various variant calling pipelines benchmarked against the SARS-CoV-2 simulated samples, Snippy performs the best with a median F-score of 1 and IPD performed moderately well with a median F-score of 0.86 (Figure 4C). In the long-read variant calling of simulated data, Longshot performed the best with median F-score of 0.88. In comparison to other tools, IPD performed second best; however, the median F-score was found to be 0.36. Although IPD showed ~100% precision across all the samples, the sensitivity was very low (~20%), which resulted in this reduction of F-score. This low sensitivity of the pipeline can be attributed to the stringent variant selection based on consensus and further filtration in IPD. Using the variants called from both short- and long-read simulated data, we assessed the phylogenetic clade (lineage) assignment accuracy of the IPD. We surprisingly observed that even at varying background mutation rate (0, 0.01, 0.03 and 0.05% mutations per SARS-CoV-2 genome), the accuracy of lineage prediction of IPD does not alter and is ranged between 0.77 and 0.83 (Figure 4D).
We also compared the features of IPD with the pathogen detection tools used for benchmarking (summarized in Supplementary Table S6 available online at https://dbpia.nl.go.kr/bib). Overall, IPD is a tool that performs both on pathogen quantification and variant calling/annotation from the diverse advanced sequencing dataset and the only tool to our knowledge that can perform both on the short- and long-read data. In addition, IPD has useful features, such as a graphical interface for analysis, an in-built data filtration step, a SARS-CoV-2–specific analysis module that mainly performs the genome variation–based phylogenetic clade assignment and automated report generation. Software runtime and memory usage comparisons show that it performs relatively slower and consumes slightly higher memory as compared to other tools/pipelines (Supplementary Figures S7 and S8 available online at https://dbpia.nl.go.kr/bib), evidently as it performs both quantification and variant calling in the same run, on the genomic data.
IPD SARS-CoV-2 automated report generation
Summarization and visualization of the results is an important aspect of any genomic analysis. We have implemented an automated report generation, for the SARS-CoV-2 pathogen. By providing the custom information for any genome, the same module can be adopted for the generation of reports for other infectious pathogens. A fixed HTML report is generated summarizing the SARS-CoV-2–specific outputs from the different modules of IPD (Figure 5). The automated report includes the following sections: (a) sequencing statistics—which details the number of reads, aligned reads to human/pathogen reference in IPD, % aligned reads and mean read length in the sample; (b) coverage plot section provides the genomic coverage of SARS-CoV-2 genome at a base resolution for a sample; (c) relative abundance section provides the plot for normalized quantification of SARS-CoV-2 and the composition of sequences attributable to human, other pathogens or SARS-CoV-2 in a sample; (d) finally, the report contains information about the novel variants (if any) in a sample, as compared to the database of the reference variants in IPD for SARS-CoV-2. Using the clade assignment algorithm in IPD (Figure 2), we also report the closely related strain from GISAID database and its clade.
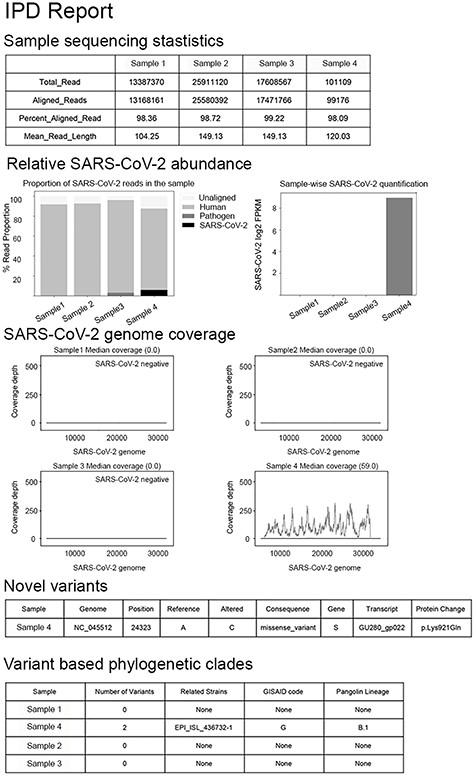
Automated report generation in IPD. HTML report as generated by the IPD SARS-CoV-2 module, containing sequencing statistics, pathogen quantification and genome coverage and variant information, as three major sections.
Discussion
We present IPD, a GUI-enabled pathogen detection and analysis pipeline that can perform uniform processing of heterogeneous datasets generated from advanced sequencing experiments. IPD works on both short- and long-read sequencing data and contains three distinct modules, namely the heterogeneous data filtration/alignment module, integrated pathogen quantification and variant calling and a specialized SARS-CoV-2 analysis module to analyze and visualize the SARS-CoV-2 sequencing data. IPD is also available as a server-based web application, making its usage suitable for the researchers without any informatics background. We performed extensive benchmarking of IPD with real and simulated datasets to establish the validity of the analytical pipeline presented. Pathogen validation using orthologous techniques revealed that IPD shows the highest coherence with orthologous pathogen validation methods. With the different datasets used in the benchmarking experiments, we demonstrate the ability of IPD to perform analysis on data generated not only from different technologies but also from diverse pathogens, which represent bacterial, RNA and DNA viruses. We further applied IPD on 1500 (short- and long-read) SARS-CoV-2–positive and negative sequencing data, resulting in the detection of the virus specifically in the positive sample set. The variant analysis on the same sample set further revealed the mutation hotspots in the SARS-CoV-2 genome, which were then compared with the recurring mutations resulting from analysis of the publicly available genome isolates from GISAID database.
IPD consists of a specialized, SARS-CoV-2 analysis module that is developed to primarily perform phylogenetic clade assignment for the analyzed samples. Using this, we performed a clade assignment for 100 samples using the variants obtained from IPD analysis. The analyses revealed clade B to be the dominant clade in the samples analyzed, wherein the majority of the samples had ‘USA’ as their country of origin. This is consistent with the previous reports, wherein clade B has been designated as the dominant clade in North America [53]. Finally, this specialized module also generates a user-friendly report tabulating the sequencing statistics, SARS-CoV-2 quantification, genome coverage plots for individual samples. The report also lists the novel variants identified in the analysis, as well as the clades assigned based on the known variants from individual samples. The ability of IPD to perform the variant-based phylogenetic clade assignment and sample-wise report generation makes it a pertinent platform to analyze advanced sequencing dataset derived from the SARS-CoV-2–positive clinical samples.
Worldwide several efforts to perform genomic sequencing of the novel coronavirus are underway. The massively parallel sequencing provides detailed information about the viral genome and its evolution at the resolution of a base. In addition to the quantification of the pathogen in clinical samples, sequencing gives us additional insights into the biology of the virus, such as non-canonical transcript identification [10] and genome variations analysis [75]. The diversity in the sequencing methods and data type generated demands use of specific analytical pipelines and tools to handle each data type. To meet these requirements, the IPD is designed for both quantification and variant calling on the heterogeneous dataset.
Overall, the ability of IPD to perform seamless, integrated analysis of the SARS-CoV-2 genomic datasets will help to further the understanding of the variation and evolution of the virus, using the large sequencing datasets. IPD’s unified analytical protocols for the viral genomic dataset are aimed to cater to the vast amount of advanced sequencing data generated during the unprecedented public health crisis. The understanding of the genome variability and evolution of SARS-CoV-2 within different populations will affect the efficacy of the therapeutic and preventive interventions designed globally, with a universal application beyond the COVID-19 pandemic.
Conclusion
NGS-empowered genomics has transformed our approaches to infectious disease surveillance, providing insights into pathogen evolution, host-pathogen interactions and antibiotic resistance to help prevent epidemics and pandemics. We present IPD, a converged analytical platform, to cater to the different types of advanced sequencing data, which otherwise requires the use of specialized tools and pipelines. It is designed to report the occurrence and genomic variability among infectious pathogens from the individual. We demonstrate the use of IPD on the publicly available SARS-CoV-2 sequenced samples and show its potential for direct utility in the COVID-19 pandemic and beyond to help automate the sequencing-based pathogen analysis and in responding to a public health crisis, efficaciously.
IPD: An automated computational pipeline to perform pathogen quantification and variant calling/annotation from short- and long-read sequencing datasets.
IPD has a customized analytical module for the SARS-CoV-2 virus to perform a genome variation–based phylogenetic clade assignment and automated report generation.
IPD is available as both a GUI-enabled desktop application and a web application, allowing researchers without any prior computational know-how to generate an automated report for individual or bulk samples.
Utility of IPD is demonstrated by analyzing 1500 short- and long-read NGS datasets from pre- and post-COVID 19-pandemic probands.
Acknowledgements
Authors wish to thank all the members of Dutt laboratory for critically reading the manuscript. The authors wish to acknowledge the support received intramurally from ACTREC-Tata Memorial Centre. S.D. is supported by Senior Research Fellowship, B.D. is supported by Senior Research Fellowship and A.S. is supported by Junior Research Fellowship at ACTREC. The funders had no role in study design, data collection and analysis, decision to publish or preparation of the study. Authors wish to thank the IT Department, ACTREC, especially Mr Prasad Kanvinde, Mr Anand Jadhav and Mr Sameer Raut, for their help in hosting of the web server. The results shown here are in whole or part based upon data generated by the TCGA Research Network: https://www.cancer.gov/tcga.
Funding
No specific funding sources.
Conflict of interest
None declared.
Data availability
No new data were generated or analysed in support of this research.
Author’s Contribution
S.D., S.R., A.R., A.D. designed the study; S.D., A.R., S.R., B.D. performed research; S.D., S.R., A.R. developed IPD; S.R. developed GUI; S.D., A.S. developed the web-based application of IPD, S.D., S.R., A.R., B.D., A.S., A.D. analyzed data; S.D., A.R., S.R., A.S., A.D. wrote the manuscript.
Sanket Desai is a PhD student at Integrated Cancer Genomics Laboratory, ACTREC, Tata Memorial Centre, Mumbai.
Sonal Rashmi is a Research Fellow at Integrated Cancer Genomics Laboratory, ACTREC, Tata Memorial Centre, Mumbai.
Aishwarya Rane is a Research Fellow at Integrated Cancer Genomics Laboratory, ACTREC, Tata Memorial Centre, Mumbai.
Bhasker Dharavath is a PhD student at Integrated Cancer Genomics Laboratory, ACTREC, Tata Memorial Centre, Mumbai.
Aniket Sawant is a PhD student at Integrated Cancer Genomics Laboratory, ACTREC, Tata Memorial Centre, Mumbai.
Amit Dutt is a Principal Investigator at ACTREC, Tata Memorial Centre, Mumbai, and an Adjunct Faculty at Institute of Advanced Virology, Kerala State Council for Science, Technology and Environment, Kerala.
References
Author notes
Sonal Rashmi and Aishwarya Rane contributed equally to this work.
