


Abstract
Here, 622 imputations were conducted with 394 customized reference panels for Han Chinese and European populations. Besides validating the fact that imputation accuracy could always benefit from the increased panel size when the reference panel was population specific, the results brought two new thoughts. First, when the haplotype size of the reference panel was fixed, the imputation accuracy of common and low-frequency variants (Minor Allele Frequency (MAF) > 0.5%) decreased while the population diversity of the reference panel increased, but for rare variants (MAF < 0.5%), a small fraction of diversity in panel could improve imputation accuracy. Second, when the haplotype size of the reference panel was increased with extra population-diverse samples, the imputation accuracy of common variants (MAF > 5%) for the European population could always benefit from the expanding sample size. However, for the Han Chinese population, the accuracy of all imputed variants reached the highest when reference panel contained a fraction of an extra diverse sample (8–21%). In addition, we evaluated the imputation performances in the existing reference panels, such as the Haplotype Reference Consortium (HRC), 1000 Genomes Project Phase 3 and the China, Oxford and Virginia Commonwealth University Experimental Research on Genetic Epidemiology (CONVERGE). For the European population, the HRC panel showed the best performance in our analysis. For the Han Chinese population, we proposed an optimum imputation reference panel constituent ratio if researchers would like to customize their own sequenced reference panel, but a high-quality and large-scale Chinese reference panel was still needed. Our findings could be generalized to the other populations with conservative genome; a tool was provided to investigate other populations of interest (https://github.com/Abyss-bai/reference-panel-reconstruction).
Introduction
As a cost-efficient way of genotyping variants, imputation has become a standard approach in genome-wide association studies (GWAS) in the past decade. It is achieved by using known haplotypes in a population to infer initially untyped genetic variants for testing association with a trait of interest [1], thereby allowing to overcome one major limitation of single-nucleotide polymorphism (SNP) genotyping arrays. In general, an SNP array only includes 105–106 human genetic variations; genotype imputation makes these low-density genetic-variants arrays become a higher one (107–108). A higher resolution view of a genetic region can provide many advantages for population genetics research, such as guiding fine mapping by increasing the chances of identifying a causal variant [2], facilitating the combination of results across studies in meta-analysis [3, 4] and increasing the power to detect an association signal [5, 6]. Since genotype imputation carries such potentials, the accuracy of an imputed variant is crucial. Many studies have illustrated the accuracy and reliability of genotype imputation in common variants (Minor Allele Frequency (MAF) > 5%) [7–9]. Compared to common variants, rare variants are often population specific and tend to have low levels of pairwise linkage disequilibrium with other sites but are more likely to be associated with dramatic functional consequences [10, 11]. More and more rare and low-frequency variants were discovered to be associated with serious diseases [3, 12–14]. However, keeping the imputation accuracy of rare and low-frequency variants at a reliable level is still a challenge [15].
Several imputation tools have been developed during the last decade; most of them employ the hidden Markov model as their engine, such as the IMPUTE, MaCH and Minimac series [16–18]. Although the algorithms of imputation tools are constantly updated, their main purpose is to reduce the computed pressure of the server; the assistance they can provide in improving accuracy of imputation of rare variants is very limited. The imputation reference panel as the haplotype patterns and information carrier for inference of untyped genetic variants, its composition and size are far more crucial influential factors for imputation accuracy [19].
Since the International HapMap3 Project was accomplished in 2010 [20], more and more whole-genome sequencing (WGS) data were produced for public use. The quality of genotype imputation has benefited from the increase of genetic information in these publicly available reference panel data [21, 22]; one of the most famous and widely used reference panels is from the 1000 Genomes Project (1000G) [23]. The 1000G Project Phase 3 identified more than 84.4 million SNPs from 2504 individuals, which were collected from 26 worldwide populations; each population contains 61–113 individuals. The 26 populations were divided into five groups: African (AFR), Ad Mixed American (AMR), East Asian (EAS), European (EUR) and South Asian (SAS). Besides the 1000G Project, there are some more population-specific reference panels. Examples include the UK10K Project [24] (3781 British sequenced at 7× depth of coverage) and the Genome of the Netherlands [25] (250 Dutch parent–offspring families sequenced at 14× depth). Recently, a large combined haplotype reference panel, named the Haplotype Reference Consortium (HRC), was formed; it consists of 64 976 haplotypes at 39 235 157 SNPs, with the minor allele count greater or equal to 5, and it will collect more WGS data in the future [26]. In 2017, 11 670 genomes of the Chinese sequencing project called the China, Oxford and Virginia Commonwealth University Experimental Research on Genetic Epidemiology (CONVERGE) were published, but only ~22 million high-quality SNPs were identified because of its low-coverage sequencing depth (1.7×) [27].
There are many factors that affect the imputation accuracy of rare variants, such as density of genotyping array, ancestry diversity of GWAS data as well as sequencing depth, haplotype size and diversity of the reference panel [1]. In general, for genetically diverse populations such as Hispanics/Latinos in the United States, a corresponding diverse reference panel will improve imputation accuracy [28]. For an ancestry-specific GWAS data, such as Southeast Asian [29] and African ancestry [8], using the corresponding specific reference would gain more accuracy because of the similar genetic background. However, another study found that the accuracy of imputation of low-frequency variants can benefit from the reference diversity, independent of reference haplotype size [30]. It is widely accepted that the haplotype size is a key factor in a particular reference panel, but most of the time expanding the reference panel size means introducing more population diversity.
Therefore, the relationship between imputation accuracy of rare variants and composition of reference panels and how to maximize the imputation accuracy remains unclear. Here, we proposed a much rigorous and systematic design to evaluate the relationships between imputation performance and haplotype diversity and size of the reference panel for Han Chinese and European populations by using 394 customized reference panels and by performing 622 imputations. Besides, we evaluated the imputation performance of HRC, 1000G and CONVERGE reference panels for both Han Chinese and European populations.
Methods
Sample data sets and genotyping
In this study, we used Han Chinese and European samples as study data sets. All Han Chinese samples, which consist of 2360 individuals, were obtained from multiple regions in central and southern China [31]. The Illumina Human610-Quad (610K) BeadChip was employed for genotyping analysis based on the Genome Reference Consortium Human build 36 (GRCh36), and a total of 598 821 SNPs were identified. The European data set was obtained from the TwinsUK Project (http://www.twinsuk.ac.uk/). All 3461 European individuals were genotyped by using the 610K BeadChip [32], which was the same as the Han Chinese genotyping array, and the genome annotation was based on GRCh36.
Quality control and prephasing
We first updated the genome assembly version of genotyping array variants from build 36 to build 37. For all sample sets, we performed a stringent quality control (QC) with four steps. Step 1: we retained autosomal biallelic SNPs with missing call rates of ≤5% and samples with missing call rates of ≤2% of data by using PLINK v1.9 [33]. Step 2: the pairwise genetic relationship matrix between all samples was calculated by GCTA v1.91 [34] using common variants with MAF > 10%, and individuals with pairwise genetic relationship coefficient > 0.025 will be thought to be cryptically related. We then randomly selected 2000 unrelated individuals for both Han Chinese and European sample sets. Step 3: we downloaded the legend file of 1000G Phase 3 and used the EAS and EUR populations as the reference to check our Han Chinese and European data, respectively, by Perl scripts of checking tool (http://www.well.ox.ac.uk/~wrayner/tools/). We checked if any SNP ID or genome position was mismatched with the reference panel; if yes, the SNP was removed, and we corrected the allele switch and strand flip in the data sets and removed SNPs whose allele frequency difference with reference was larger than 0.2. Last step: we excluded the SNPs with missing call rates of >5% again and excluded those deviating from Hardy–Weinberg equilibrium at P < 1 × 10⁻⁶. In order to study the imputation accuracy of very rare variants, we retained all SNPs in the Han Chinese sample data set. Note that SNPs in the European data set were all with MAF > 0.5%. Finally, 516 410 overlapped variants between Han Chinese and European data sets in total were used as the study data.
To reduce the computed pressure of the subsequent large-scale genotype imputations, we phased Han Chinese and European data sets by using SHAPEIT v2.9 [35] with the default settings in the local server. Then, we checked our data, which passed QC, in the Michigan imputation server [16].
Population structure analysis of two study populations and 1000G populations
We investigated the population structure of the Han Chinese and European populations and 26 subpopulations from 1000G Project Phase 3. We extracted all genotypes of subpopulations of 1000G and two study populations. After QC, we conducted a principal component analysis (PCA) with about 1800 biallelic SNPs for these 28 data sets. In total, 6504 samples were analyzed, of which 2504 were from 1000G and the rest were from Han Chinese and European sample sets (2000 for each population). R package bigstatsr and bigsnpr were employed for the PCA [36]. The 1000G reference panel was reconstructed into a series of small panels for the next evaluation.
Reference panels reconstruction by haplotype size
Twenty-four of the 26 populations in the 1000G Phase 3 reference panel, with a sample size of greater than 85, were selected to study the relationship between haplotype size and imputation accuracy, wherein three were AMR, six were AFR and the other 15 were EAS, SAS and EUR. We randomly and successively extracted 25, 45, 65 and 85 samples from each population alone (Figure 1A) and customized them into four size gradients, which were 50, 90, 130 and 170 haplotypes, and the higher gradient sets contained all haplotypes of the lower one. The bcftools was employed here (https://samtools.Github.io/bcftools/). These customized 96 (24 × 4) panels were then used for imputation of Han Chinese and European sample sets by Minimac3 in the local server (Figure 1A).
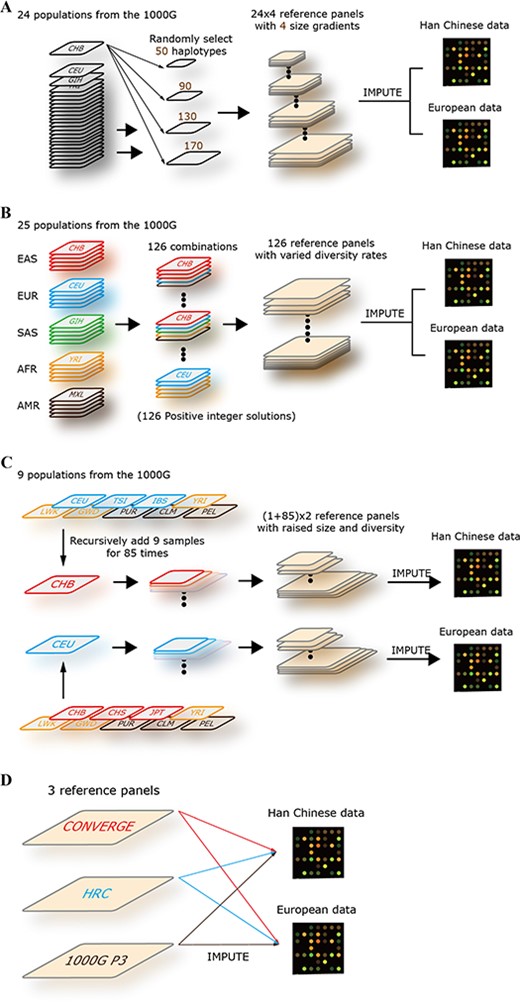
Research design. (A) The design of imputation accuracy versus reference panel size. Twenty-four worldwide population of the 1000G Phase 3 were selected (sample size > 85), such as CHB, CEU and Gujarati Indian from Houston (GIH). For each population, the haplotypes were extracted and customized as reference panels with four size gradients (50, 90, 130 and 170 haplotypes). Totally, 96 reference panels (24 × 4) were formed, and then the imputation was performed for the Han Chinese and European chip data in the local server. (B) The design of imputation accuracy versus reference panel diversity. In this part, the size of reference panels was fixed to 640 haplotypes. Twenty-five populations of the 1000G Phase 3 were selected and categorized into five groups (EAS, EUR, SAS, AFR and AMR; see Methods); each group included five populations, and each population contained 64 samples. The five groups of population that we considered corresponded to a set of vectors (i1–i5) and solved the function of i1 + i2 + i3 + i4 + i5 = 5. We got 126 positive integer solutions in total, which represented 126 combinations. Finally, 126 reference panels were formed, and the imputations were performed for the Han Chinese and European chip data in the local server. (C) The design of imputation accuracy versus reference panel size and diversity. Twelve populations were selected. Nine of them were diverse to Han Chinese and European populations. Then, the CHB and CEU were used as basic panels; the diverse samples were recursively added to them, nine samples per time and 85 times in total. Finally, two reference panel sets were formed, and each group included 86 reference panels (1 + 85). The imputations were then performed for the Han Chinese and European chip data in the local server. (D) Imputation for the Han Chinese and European populations using 1000G, HRC and CONVERGE reference panels.
Reference panel reconstruction by population diversity
We categorized five groups corresponded with EAS, EUR, AFR, AMR and SAS of population distribution in the 1000G Phase 3 to study the relationship between imputation accuracy and diversity of the reference panel (Figure 1B). Each group consists of five populations in sequence, and each population contains 64 samples (Supplementary Table 1). Note that the AFR group has seven populations in the 1000G; we excluded the ASW (Americans of African Ancestry in Southwest United States) in the AFR group because of its small sample size and recategorized the ‘ACB’ (African Caribbeans in Barbados) into the AMR group in this study (see Discussion). The five groups of populations that we considered corresponded to a set of vectors (i1–i5), and then, we solved the function: i1 + i2 + i3 + i4 + i5 = 5.
One hundred twenty-six nonnegative integer solutions were obtained in total. These solutions corresponded to 126 different combinations of 25 populations in five groups; the reference panels were then constructed based on these combinations. For these panels, we set six levels of population diversity based on the number of populations of EAS or EUR; the diversity degree increased from level0 to level5, for example, the solution (i1, i2, i3, i4, i5) = (2, 3, 0, 0, 0) means a reference panel consists of the first two populations in EAS and the first three populations in EUR (Supplementary Table 1), and no AFR, AMR or SAS populations were included. Therefore, this panel was diverse for EAS at level3 and for EUR at level2. Each panel contains 640 haplotypes. The imputations were performed for Han Chinese and European sample sets with 126 different diversity panels (Supplementary Table 2) by using Minimac3 in local.
Reference panels reconstruction by both haplotype size and population diversity
In this part, a series of reference panels were customized with haplotype size and population diversity constantly changed (Figure 1C). We took these two factors together as arguments to investigate the pattern of imputation accuracy variation. First, we extracted CHB (Chinese in Beijing) and CEU (Utah residents with Northern and Western European Ancestry) population samples from 1000G Phase 3 according to the ancestry to our GWAS study sets. Besides, we also extracted other 10 populations, including three AMR populations (PUR, CLM, PEL), three AFR populations (YRI, LWK, GWD), two EUR populations (TSI, IBD) and two EAS populations (CHS, JPT). The CHB and CEU populations contain 103 and 99 samples, respectively, and each of the other 10 populations contains at least 85 samples. Then, we took CHB and CEU samples as two basic panels and added other population samples to them constantly. To ensure that no individuals from the corresponding specific group were involved in CHB-based and CEU-based panels, we used different adding strategies. For the CHB-based panel, we chose the adding populations from AMR, AFR and EUR groups. For the CEU-based panel, we chose the adding populations from AMR, AFR and EAS groups (Figure 1C); each group contained three populations, and then, we respectively took one individual from these nine populations per time and recursively added them to basic panel for 85 times in total (Figure 1C). Finally, we got 172 imputation reference panels; half of them were CHB based, and the other half were CEU based. These panels were then used for Han Chinese and European sample sets imputation by using Minimac3 in the local server, respectively.
HRC, 1000G and CONVERGE reference panels
The HRC was the largest reference panel for genotype imputation currently and mainly consist of European population samples [26]. The 1000G sample was consist of 26 worldwide populations and made it the most diverse reference panel [23]. The CONVERGE was a Chinese-specific panel with 11 670 genomes with low depth (1.7×) [27]. These three reference panels were assessed in our study (Figure 1D). Minimac3 was employed for genotype imputation in our study because of its advanced performance [16]. We converted all reference sets from common VCF format into Minimac3 specialized M3VCF format, which require lesser space and are faster to read than VCF file while importing data.
A basic statistics of variants was performed first between HRC, 1000G and CONVERGE reference panels. We used remote and local ways to impute our data, since the complete haplotype set of the HRC was not available for downloading yet and the CONVERGE-based imputation was performed using Minimac3 in the local server. For consistency of imputation tools, the Michigan imputation server was employed for remote HRC-based imputation. The 1000G-based imputation was performed in both ways (Michigan imputation server and local imputation server) to test the comparability of the results of the two different servers. Note that the 1000G panel had two versions, one included singletons and the other did not; the latter was mainly used here (see Discussion). All imputations were conducted with default settings.
Evaluation of imputation accuracy
For each site that was genotyped in the study samples, Minimac3 can calculate a special imputed dosage by hiding all known genotypes for that site. This imputed value is called leave-one-out dosage (LooDosage) and was used to calculate EmpR2 by directly calculating the Pearson correlation coefficient between LooDosage and known genotypes. Compared to R2, EmpR2 was more powerful and effective in evaluating imputation accuracy and can only be calculated in genotyped sites. In our study, we set a strict threshold for ‘well-imputed’ sites, which the Minimac3 R2 (imputation quality) had to reach at least 0.8 and used Minimac3 EmpR2 to measure the imputation accuracy.
Results
QC and population structure analysis
We conducted a strict QC for Han Chinese and European genotyping array data sets in the local server and checked the data after QC by using the Michigan imputation server. The allele frequency showed a strong correlation between GWAS sets and EAS or EUR data from the 1000G Phase 3 reference panels, where r2 = 0.991 for Han Chinese GWAS data set and r2 = 0.994 for European GWAS data set (Supplementary Figure 1). After QC, 516 410 overlapped sites in 2000 unrelated individuals were retained for both populations. We used about 1800 autosomal biallelic SNPs to perform PCA, and the results showed that Han Chinese samples were clustered with the EAS sample group of 1000G, and European samples were clustered with the EUR sample group of 1000G (Supplementary Figure 2).
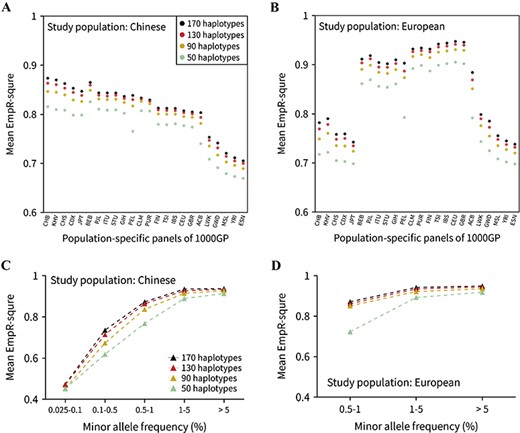
Imputation accuracy for the reference panels with four haplotype size gradients. Overall imputation accuracy for (A) Han Chinese and (B) European populations using 24 worldwide populations of the 1000G Phase 3 as reference panels. For each reference panel, the average EmpR2 (measuring the imputation accuracy) was plotted with four haplotype sizes (50, 90, 130 and 170). (C) Imputation accuracy for the Han Chinese population in five different MAF bins using the CHB (Han Chinese ancestry) population as the reference panel. (D) Imputation accuracy for the European population using the CEU (European ancestry) population as the reference panel. Only three MAF bins of EmpR2 of variants were plotted since the variants with MAF < 0.5% were not available (see Methods).
Imputation accuracy versus haplotype size of the panel
It is generally accepted that genotype imputation accuracy can benefit from increasing haplotype size of the reference panel. In this study, we validated this point in a more systematic approach. We performed 192 imputations for Han Chinese and European GWAS data in this part. Twenty-four worldwide populations from 1000G Phase 3 were customized as reference panel; each population was transformed into four gradients according to the number of haplotypes. All different population panels showed the consistent results that imputation accuracy increased with the panel’s haplotype size for both Chinese and European data sets (Figure 2A and B). For Han Chinese and European samples, the average accuracy of all genotyped variants reached the highest when we used CHB and CEU population samples as the reference panel, respectively. To obtain the more distinct comparison between gradientized reference panels, we divided variants into five MAF bins, including MAF ≥ 5%, 1% ≤ MAF < 5%, 0.5% ≤ MAF < 1%, 0.1% ≤ MAF < 0.5% and 0.025% < MAF < 0.1%. The imputation accuracy values in different MAF bins all showed an increasing trend when the haplotype size was constantly augmented (Figure 2C and D). Besides, we counted well-imputed (R2 > 0.8) number of variants; the results showed that the number of well-imputed variants also increased with haplotype size (Supplementary Figure 3A and B). These results validated the fact that the imputation quality could be improved by the haplotype size of the reference panel.
Comparing the Han Chinese and European data sets, the average imputation EmpR2 showed that the European population could be more accurately imputed when the corresponding population reference panel was used (increasing from 0.82 to 0.87 for Han GWAS and CHB and from 0.91 to 0.95 for European GWAS and CEU while haplotype size increased from 50 to 170). The same pattern was also shown in the heat map, wherein European GWAS imputation using reference panels from EUR was much redder than Han GWAS imputation using reference panels from EAS (Figure 3).
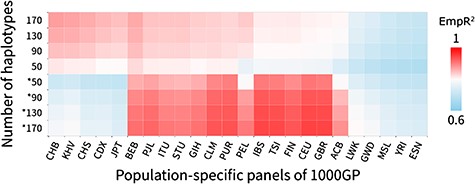
Imputation accuracy heat map for the Han Chinese and European populations with 24 population-specific reference panels. The colors that changed from light blue to red represented the imputation accuracy (measured by EmpR2). The x-axis represented the 24 population-specific reference panels from the 1000G Phase 3. The y-axis represented the four different haplotype sizes of reference panels. The without asterisk marked group (upper) was for the Han Chinese population, and the asterisk marked group (lower) was for the European population.
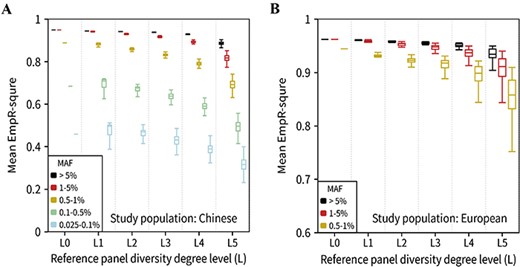
Imputation accuracy for the reference panels with different diversity degrees. (A) The boxplot of the EmpR2 for Han Chinese using the reference panels with different proportion of EAS populations. Since our study was the Han Chinese population, we used the proportions of non-EAS samples of 1000G (~0–100%) represented the diversity degrees (level0 to level5) to the GWAS data. All variants were divided into five MAF bins. The outliers (mean EmpR2 more than Q3 + 1.5 ∗ IQR or less than Q1 − 1.5 ∗ IQR, IQR = Q3 − Q1) were not plotted. This plot was based on the 126 reference panels; the diversity degree level0, level1, level2, level3, level4 and level5 groups respectively contained 1, 4, 10, 20, 35 and 56 reference panels. (B) The boxplot of the EmpR2 for the European population using the reference panels with different proportion of non-EUR populations. Similar to A, but only three MAF bins of EmpR2 of variants were plotted since the variants with MAF < 0.5% were not available (see Methods).
Imputation accuracy versus population diversity of panel
In this part, we constructed 126 ‘diversity’ reference panels using the five population groups of the 1000G (Supplementary Table 2) and performed 252 imputations in total. The haplotype size of each reference panel was fixed to 640. The overall average EmpR2 decreased from 0.92 to 0.84 for Chinese samples and from 0.96 to 0.93 for European samples, while diversity changed from minimum degree to maximum degree (level0 to level5). We further divided imputed variants into five MAF bins, as shown in Figure 4A and B; the imputation accuracy of variants with MAF ≥ 0.5% showed the decreasing trend when diversity degree increased. However, for the rare variant imputation (MAF < 0.5%) in Han Chinese population, the accuracy increased when the diversity degree increased from level0 to level1. These results suggested that, when the haplotype size was fixed, the more that a reference panel was specific to the study population, the more accurately that it could impute for common variants and low-frequency variants. However, for rare variants (MAF < 0.5%), a little population-diverse fraction of samples of the reference panel could benefit the imputation accuracy.
Imputation accuracy versus size and diversity of panel
We knew that the haplotype size and the population diversity of the reference panel were two crucial factors that affect imputation accuracy. From the results above, we showed that the genotype imputation accuracy of the rare variants could benefit from the increasing sample size and an appropriate proportion of the diversity of reference panels. Most of the time, expanding sample size meant to introduce more diverse populations. In this part, we designed a series panel where the haplotype size and population diversity simultaneously increased for 85 times. A total of 172 panels were customized and divided into two groups (Figure 1C), sample size expanding from 103 to 868 for the Han Chinese group (99–864 for European group) while population diversity was augmented from 0 to 88%. We found different imputation accuracy patterns for Han Chinese and European populations. For the Han Chinese population, the overall accuracy had an improvement at the beginning and reached the highest when the panel’s samples increased three step sizes (27 individuals), with 21% population diversity introduced (Figure 5A). After that, the imputation accuracy continually decreased with diverse populations increased, but still higher than the initial panel (0-step panel). However, for the European population, the imputation accuracy showed a constantly increasing trend from step 1 to the end, with growing sample size and diversity; the increases from the first step were the most obvious (Figure 5A). This result suggested that the positive effect of sample size expanding on imputation accuracy was not large enough to neutralize the negative effect of the panel diversity, which introduced for the Han Chinese population after the diversity rate of over 21%. However, it could offset the negative effect for the European population and improve imputation accuracy, which meant that the imputation accuracy for the European population could always benefit from the larger panel.
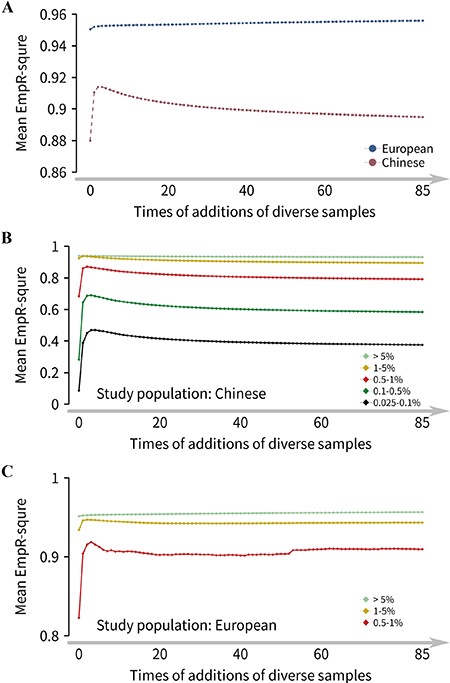
Imputation accuracy for the reference panels with population diversity and sample size constantly increased. (A) Overall imputation accuracy trends for Han Chinese and European populations. For the Han Chinese population, the basic panel (0-step of additions) was CHB (0% diversity, 103 samples with Han Chinese ancestry), and the final reference panel was 85-step of additions panel (88% diversity, 868 samples). For the European population, the basic panel was CEU (0% diversity, 99 samples with European ancestry), and the final reference panel was 85-step of additions panel (88% diversity, 864 samples). (B) Imputation accuracy trend for the Han Chinese population in five MAF bins using the reference panels with population diversity and sample size constantly increased. (C) Imputation accuracy trend for the European population, and only three MAF bins of EmpR2 of variants were plotted since the variants with MAF < 0.5% were not available (see Methods).
In the divided MAF bins of imputed variants, the results showed the more detailed change mode. The imputation accuracy increased rapidly when the diverse population was introduced at the beginning for both populations and then slowly decreased for the variants of the Han Chinese population (Figure 5B) but slowly increased for the common variants of the European population (Figure 5C) with diverse samples increased. Besides, for the variants with different MAF bins to reach its highest accuracy, the diversity rate was increased when the variants got more and more rare. These results suggested that an extra diversity of the reference panel could remarkably improve the imputation accuracy of rare variants and appropriate proportion (15–21%) diversity could maximize it for the Han Chinese population. Besides, we observed that the European population could be more accurately imputed than the Han Chinese population. The summarized results of trends and relationship between genotype imputation accuracy and haplotype size and diversity of the reference panel were displayed in Supplementary Table 3.
Based on the design of this part, we developed a panel reconstruction tool for researchers to investigate the imputation accuracy in other populations of 1000G. Users can set their own study population, diverse populations, step size and adding times in an easy way and customize a series reference panel. This tool/package could be downloaded now from GitHub, and the details about how to use this tool were included (https://github.com/Abyss-bai/reference-panel-reconstruction).
Summary statistics of imputed variants in the Han Chinese and European populations
| Study | Panel | N | Well-imputed variants number (proportion) | Shared variants | *Genotyped variants | ||
|---|---|---|---|---|---|---|---|
| N | Mean R2 (SD) | N | Mean EmpR2 (SD) | ||||
| Han Chinese | HRC | 39,127,690 | 6,228,449 (15.9%) | 10,302,818 | 0.72 (0.19) | 515,754 | 0.89 (0.17) |
| 1000G P3 | 47,109,465 | 7,168,371 (15.2%) | 10,302,818 | 0.68 (0.22) | 516,408 | 0.91 (0.14) | |
| CHB + diversity (21%) | 47,109,431 | 6,275,000 (13.3%) | - | - | 516,408 | 0.91 (0.16) | |
| CONVERGE | 24,114,249 | 5,626,185 (23.3%) | 10,302,818 | 0.58 (0.20) | 511,715 | 0.92 (0.11) | |
| European | HRC | 39,127,690 | 12,871,067 (32.9%) | 10,302,818 | 0.73 (0.12) | 515,754 | 0.98 (0.04) |
| 1000G P3 | 47,109,465 | 9,422,724 (20.0%) | 10,302,818 | 0.69 (0.18) | 516,408 | 0.96 (0.07) | |
| CONVERGE | 24,114,249 | 4,539,069 (18.8%) | 10,302,818 | 0.51 (0.18) | 511,715 | 0.82 (0.21) |
The 1000G-based imputation and CONVERGE-based imputation were performed in local server, and the HRC-based imputation was performed in Michigan Imputation Server. The 1000G Phase3 reference panel we used was the no-singleton version, which was coincident with Michigan imputation server, and the both servers employed Minimac3 as the impute engine. N means the imputed sites number, and we defined the imputed variants with R2 more than 0.8 were the well-imputed variants.
*Variants were genotyped by the Illumina Human610-Quad (610 K) BeadChip, the imputation accuracy was measured by EmpR2 (Empirical-R2, see methods).
Imputation evaluation for the 1000G, HRC and CONVERGE panels
Before actual imputation, the variants overlapping between the three panels and the distribution within the six MAF bins were calculated (Supplementary Figure 4). The Venn diagram showed that 1000G P3, HRC and CONVERGE have 15 524 045, 10 612 366 and 10 550 308 unique sites on autosomes, respectively, and all shared 10 303 072 sites in total (Supplementary Figure 5). The HRC-based imputation was performed in the Michigan server, and the CONVERGE-based imputation was performed in the local server. The 1000G-based imputation was conducted in both ways (local and remote), and we compared the results of 1000G-based imputation of the two servers: the mean EmpR2 and imputed site counts showed perfect consistency (Supplementary Figure 6 and Supplementary Table 4). This result illustrated that the bias caused by the local and Michigan imputation servers’ difference was negligible. Besides these three reference panels, in this part, we also presented the ‘CHB21D’ panel that consisted of CHB population and 21% extra diverse samples (i.e. the 3-step panel for Han Chinese in the last section) to compare its performance with the three big reference panels.
For Han Chinese GWAS sets, the 1000G panel imputed 7 168 371 sites with R2 ≥ 0.8, which was the best. The HRC panel showed the highest imputation quality with mean R2 = 0.72 in shared sites, and the CONVERGE panel showed the highest imputation accuracy with EmpR2 = 0.92. However, because only about 22 million sites in total were contained in the CONVERGE panel, its number of well-imputed sites was the minimum (5 626 185). For European GWAS sets, the HRC panel resulted in 12 871 067 well-imputed (R2 ≥ 0.8) sites, which was the best among the three panels and accounted for 32.9% of total imputed sites. The HRC panel showed the highest imputation quality with mean R2 = 0.73 in 10 302 818 shared imputed sites and showed the highest imputation accuracy with a quite strong mean EmpR2 = 0.98 (Table 1).
We also divided imputed variants by MAF bins as above, but the common variants (MAF > 5%) were not focused. For Han Chinese GWAS dataset, the absolute number of well-imputed SNPs of the HRC and 1000G panels was close and the highest, whereas the CONVERGE panel showed the minimum in four MAF bins and even lower than the CHB21D panel (Figure 6A). The average R2, which represents imputation quality of variants, showed that the CONVERGE panel was slightly better than the 1000G panel while the HRC was still the best (Supplementary Figure 7A). For European GWAS sets, the absolute number of well-imputed variants and mean R2 of the HRC panel in all four MAF bins were obviously higher than the corresponding values of the 1000G and CONVERGE panels (Figure 6B and Supplementary Figure 7B). Moreover, even for the very rare variants whose MAF in 0.025–0.1% bin, the HRC panel could well impute about 2.4 million sites while the 1000G and CONVERGE panels could only well impute 0.4 million and 2021 sites.
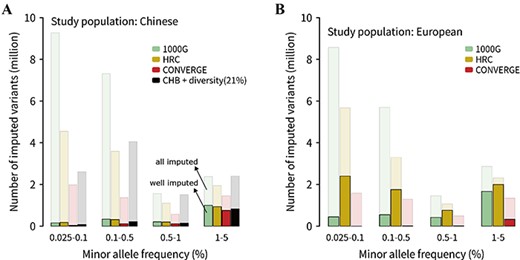
The number of imputed variants for the 1000G, HRC and CONVERGE reference panels. The number of imputed variants of these reference panels for (A) Han Chinese and (B) European populations. The common variants were not focused because of its reliability of imputation. All variants with MAF < 5% were divided into four MAF bins. The different colors represented different reference panels; the light color represented all imputed variants, and the dark color represented well imputed variants (R2 > 0.8). The panel of ‘CHB + diversity (21%)’ was referred to the CHB21D panel, which consisted of CHB population and 21% extra diverse samples (i.e. the 3-step panel for Han Chinese in last section).
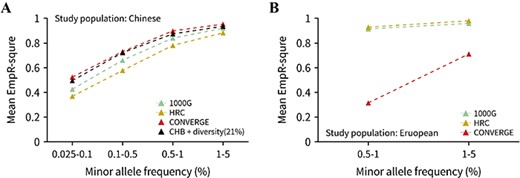
Imputation accuracy for the 1000G, HRC and CONVERGE reference panels. (A) Imputation accuracy for the Han Chinese using four different reference panels. Only the mean EmpR2 of low-frequency and rare variants were plotted, and the variants were divided into four MAF bins. The panel of ‘CHB + diversity (21%)’ was referred to the CHB21D panel, which consisted of CHB population and 21% extra diverse samples (i.e. the 3-step panel for Han Chinese in last section). (B) Imputation accuracy for the European population using three reference panels, and only three MAF bins of EmpR2 of variants were plotted since the variants with MAF < 0.5% were not available (see Methods).
To obtain more comparable results, we extracted the 10 302 818 shared sites by three panels. The HRC panel also showed the largest number of well-imputed variants and the highest average of R2 in four MAF bins for both populations (Supplementary Figure 8). Besides, we found that, for the Han Chinese population, although the HRC imputed the most variants with R2 > 0.8, its EmpR2 was just the lowest among the four panels (Figure 7A). The Chinese-specific panel CONVERGE has the highest imputation accuracy, followed by the CHB21D panel, which only contained 130 samples. The constitution of CHB21D panel showed the great potential at imputation accuracy. For the European population, the imputation EmpR2 of the HRC panel was slightly higher than the 1000G panel; the CONVERGE panel was the lowest (Figure 7B). We could know that HRC has the best imputation performance for our European samples from these results, but for Han Chinese samples, however, each of the three panels had their own advantages, and none of them was the most suitable panel. A high-quality and decent genotype imputation reference panel for the Chinese population was still needed.
Discussion
In this study, by conducting 622 imputations with 394 customized reference panels for Han Chinese and European populations, we found that when the haplotype size of the reference panel was increased with extra population-diverse samples, which was usually the real case, the imputation accuracy of the Chinese population could reach the highest when reference panel contains a fraction of an extra diverse sample (15–21%), but when the size of the reference panel was fixed, the pattern was different. In addition, we first evaluated the performance of the Chinese-specific panel CONVERGE and two frequently used reference panels, HRC and 1000G. In these three panels, no doubt the HRC showed the best performance on both imputation accuracy and quality for European samples. For the Han Chinese population, the performance of HRC and 1000G reference panels on a number of well-imputed variants was better than the CONVERGE panel, but the CONVERGE showed the highest imputation accuracy. However, the large-scale Han Chinese population reference panel with high quality remains needed.
Since the first GWAS published in 2005, scientists showed a fantastic enthusiasm in this powerful design to investigate the genetic risk factors for complex traits. A total of ~3700 GWAS in complex trait/diseases have identified thousands of risk variants over the past 14 years [37], and GWAS will continue to contribute knowledge about population genetics in the future. The cost of one-human-genome sequencing has dropped to 1000 dollars in 2017 [38] and even lower by now; however, it is still too expensive to sequence samples in a large-scale study. With the accomplishment and establishment of large sequencing projects and GWAS databases, such as the 1000G project and the UK Biobank, more and more large-scale and high-depth sequencing data went public and available. With reference panels that build from these high-quality data, such as HRC, genotype imputation delivered an attractive low-cost alternative to sequencing.
Previous efforts have been focused on imputation evaluation for different populations, such as African, Chinese and Southeast Asian, by using publicly available reference panels [7–8, 29]; despite all these efforts, most studies have been conducted in a relatively shallow way because of the tremendous pressure to the computation server, and the main purpose of these studies was to evaluate the percentage of well-imputed SNPs for a suitable reference panel. Less of them investigated how the factors affect the accuracy. Huang et al.'s [19] study designed a series of size-unfixed reference panels using 210 HapMap samples, which consist of four populations, and concluded that a mixed panel could lead to the maximal imputation accuracy for a particular population as its primary component was the same HapMap reference panel. Their works investigated how to maximize the accuracy with the HapMap reference panel and raised the importance of size and composition of the reference panel but was not detailed enough for a systemic study on imputation accuracy of rare variants. The genotype imputation required a high computing power, and the large-scale imputation study was mostly hindered by this requirement.
In this study, we randomly selected 2000 unrelated individuals from the Han Chinese and European samples as study data sets. Actually, the GWAS set sample size would linearly increase the computed pressure. Usually, for a large-scale imputation accuracy study, people would prefer a smaller GWAS sample size, such as less than 1000. Although the sample size we used would produce more computation load, it can reduce the accuracy error and give a more precise and reliable result. The QC we performed was quite strict, besides the common QC steps of imputation (control the high missingness rate of samples and variants, high deviations from Hardy–Weinberg equilibrium, high inbreeding coefficient, etc.), we checked our GWAS data twice in case of the mistake that varied situations may bring in subsequent imputation, such as SNP mismatch, allele switch and strand flip, by the Michigan imputation server and local tools. We believed that the GWAS data with high quality could lead to the results with high accuracy. Note that our European GWAS data had passed QC before; the variants with MAF < 0.5% had been removed, which meant that the imputation performance on rare variants of European population was not available. However, we included all variants in Han Chinese GWAS data, even for singletons. The common variants can be accurately imputed by any existing big reference panel, such as the 1000G and HRC panels. We used the rare variant set in Han Chinese to study the genotyping imputation accuracy change patterns with different compositions of reference panels.
All the customized reference panels in this study were based on the 1000G Phase 3; there were two popular versions for the 1000G panel, one included singletons and the other did not. We found that the Sanger imputation server used singleton-included version and the Michigan imputation server used the nonsingleton version. We investigated the imputation performance of these two versions of the panel on Han Chinese data in the local server and found that the difference between them were negligible (Supplementary Figure 6 and Supplementary Table 4). After all, we decided to use the nonsingleton version and were consistent with the Michigan server since the imputation tool that we both employed was Minimac3. The customized reference panels fell into three categories: (1) Haplotype size changed, and the population diversity ratio was fixed. (2) Population diversity degree changed, and the haplotype size was fixed. (3) Both of them changed with a fixed step size; note that the increased diversity ratio became smaller because the panel size got larger. In the design of our second category panels, we made a simple cluster analysis by the longitude and latitude of populations; the result showed that almost all populations obviously followed by the 1000G groups (EAS, EUR, AFR, AMR and SAS), except the ‘ACB’ population (Supplementary Figure 9). The ‘ACB’ was classified into the AFR group in the 1000G, but it was closer to the AMR group geographically, so we reclassified this population into the AMR group. But in reality, it will not make a nontrivial difference in our study, because our GWAS set was the Han Chinese and European populations, the ‘ACB’ was always diverse to our study sets. Besides the haplotype size and diversity of the reference panel, the sequencing coverage would also affect the imputation accuracy. The high-depth sequencing could result to more accurate genotypes in the reference panel, which in turn improves the accuracy of the inferred haplotypes [1]. We did not systematically evaluate the influence of sequencing coverage since the rest of effective variables could not be completely controlled by the updated public reference panels.
There was a phenomenon that crossed all the imputation results, which is that the imputation performance for the European population was always better than for the Han Chinese population by their best panels. Taking the first category panels as an example (described in the previous paragraph, imputation accuracy versus haplotype size), the results showed that the best panel (the CHB panel) for the Han Chinese population got a 0.874 average accuracy while the European population got a 0.947 average accuracy by its best panel (the CEU panel). The first reason that came to mind that might have caused this gap was that the European data set did not include variants with MAF < 0.5%, but the Han Chinese data set did, even if the variants between them were shared. We then removed all variants with MAF of less than 0.5% than in the Han Chinese data for both sets and found the average imputation accuracy increased to 0.929 and 0.948 for the Han Chinese and European populations, respectively; the gap narrowed but still existed. We could know it from the statistics of variants of different MAF bins as well (Figure 2C and D). Another reason that might have caused the gap was that the Illumina 610K BeadChips was designed for the European population at the beginning.
Another discrepancy of imputation results between the Han Chinese and European populations was that, despite the introduced diversity, the accuracy of imputed common variants of European population could always benefit from the expanding haplotype size of the reference panel, while the corresponding accuracy of the Han Chinese population could benefit only when the diversity of the reference panel remained a small ratio (Figure 5). This result suggested that, in a sense, the genome of the European genome may have a higher ‘diversity acceptability’ than the Chinese genome, which meant it was more diverse. In the course of evolution, the view of intermarriage of Chinese was more conservative than Europeans [39, 40]. And an open intermarriage view may result in the genome becoming more and more diverse across generations.
In the last decade, many cohort studies and WGS projects have been conducted, and several genome reference panels were produced. However, most of these cohorts and reference panels were focused on the European and African American populations, such as the Wellcome Trust Case Control Consortium [41], UK10K [24], HRC [26] and TOPMed program. Few WGS projects were conducted in the Chinese population. The HapMap3 only included 137 native Chinese individuals [20], the 1000G project phase 3 included 301 Chinese individuals, and only 208 were Han Chinese [23]. In 2017, 90 unrelated individuals of Chinese ancestry were sequenced at a high depth (~80×) [42] by the Beijing Genomics Institute (Shenzhen). However, the sample size of these WGS projects was small. Although the CONVERGE project sequenced 11 670 female Han Chinese and provided the largest WGS resource of Chinese [27], it was only able to call ~22 million high-quality variants, and the sequencing coverage of CONVERGE was low (1.7×). At present, we are engaging in a Chinese cohort and have collected 10K samples across 29 provincial regions of China, the sequencing of ~4000 samples at ~17× average coverage is ongoing. We hope to generate a high-quality and decent population-specific reference panel for public use for the largest ethnic group in the world.
In summary, we systematically investigated the relationship between genotype imputation accuracy of rare variants and the composition of the reference panel and proposed an optimum constituent ratio for the reference panel for the genotype imputation of the Han Chinese population. We found the different patterns of imputation accuracy variation between the European and Han Chinese populations. This point enlightened us that we should use more special panels when we impute the Chinese genome, and this could be generalized to the other populations with conservative genome.
The accuracy of imputed variants reached the highest when reference panel contains a fraction of an extra diverse sample (8–21%) for the Han Chinese population if the haplotype size of the reference panel was increased with extra samples, which is the most common case. A 1000G-based reference panel reconstruction tool was provided for the researcher to investigate other populations of interest.
The imputation accuracy showed the different trends between Han Chinese and European populations. In a sense, the European genome may be more diverse than the Han Chinese genome by itself.
Existing imputation reference panels were not the best choice for the Han Chinese population; a high-quality and large-scale Chinese reference panel was still needed.
Acknowledgments
This study was supported by the Zhejiang Provincial Natural Science Foundation for Distinguished Young Scholars of China (LR17H070001) and by the National Natural Science Foundation of China (81871831). The funding agencies had no role in the study design, data collection and analysis and the decision to publish or preparation of the manuscript. We thank the peer reviewers for their thorough and helpful review of this manuscript.
Funding
This study was supported by the Zhejiang Provincial Natural Science Foundation for Distinguished Young Scholars of China (LR17H070001) and by the National Natural Science Foundation of China (81871831).
Hou-Feng Zheng is a founding faculty member of Westlake University, China. He is a member of American Society of Human Genetics.
Wei-Yang Bai and Xiao-Wei Zhu are PhD students.
Pei-Kuan Cong is a Postdoc in Dr. Zheng’s team.
J. Brent Richards is a full professor at McGill University, Canada.
Xue-Jun Zhang is a full professor at Fudan University, China
