


Abstract
Protein fold recognition is critical for studying the structures and functions of proteins. The existing protein fold recognition approaches failed to efficiently calculate the pairwise sequence similarity scores of the proteins in the same fold sharing low sequence similarities. Furthermore, the existing feature vectorization strategies are not able to measure the global relationships among proteins from different protein folds. In this article, we proposed a new computational predictor called DeepSVM-fold for protein fold recognition by introducing a new feature vector based on the pairwise sequence similarity scores calculated from the fold-specific features extracted by deep learning networks. The feature vectors are then fed into a support vector machine to construct the predictor. Experimental results on the benchmark dataset (LE) show that DeepSVM-fold obviously outperforms all the other competing methods.
Introduction
Protein fold recognition is one of the most critical tasks in protein sequence analysis, referring to identify the protein folds only according to their sequence information [1]. Protein fold recognition is critical for protein tertiary structure identification [2], and therefore, several computational methods have been proposed to efficiently identify the protein folds with low cost. These predictors can be divided into alignment methods and machine learning methods.
There are two kinds of alignment methods widely used for protein fold recognition, including sequence alignment methods and profile alignment methods. Sequence alignment methods [3] compute alignment scores between the target protein and the template proteins whose folds are known. The target protein is assigned to the fold of the template proteins with highest alignment scores. For the purpose of improving the sensitivity, the profile alignment methods were proposed, including the profile–sequence alignment methods [4] and the profile–profile alignment methods based hidden Markov model [5] or Markov random fields [6]. The profile alignment methods can reach higher sensitivity than the sequence alignment methods.
In contrast to the alignment methods, the machine learning methods employ discriminative frameworks for fold recognition, using both the information of the positive samples (proteins in the target fold) and the negative samples (proteins outside the target fold). They treat this task as a multiclass classification problem [7–10] or a binary classification problem [11–15]. Because feature extraction methods and machine learning classifiers are two keys to construct a computational predictor, these methods were constructed based on various discriminative features and powerful classifiers, such as support vector machine (SVM) [9, 12], random forest (RF) [13] and deep learning technologies [10, 11]. FOLDpro [12] combined SVM and various features describing the pairwise similarities of any two proteins for fold recognition. Later, the RF classifier and deep learning techniques were used to further improve FOLDpro, and two predictors (RF-Fold [13] and DN-Fold [14]) have been proposed. Recently, the DeepFRpro predictor [11] extracted the fold-specific features from contact maps by convolutional neural network (CNN), and then these features, combined with other pairwise similarity features, were fed into RF classifiers to construct a series of binary classifiers for fold recognition.
All the aforementioned computational methods have contributed to the developments of this very important field, but they are suffering from the following shortcomings: (i) Inaccuracy pairwise sequence similarity score. The existing algorithms failed to efficiently calculate sequence similarity scores of the proteins in the same fold sharing low sequence similarities. (ii) Feature vectors with low discriminative power. The key to improve the predictive performance of the methods based on machine learning techniques is to construct feature vectors with high discriminative power. The exiting feature vectors are not able to measure the global relationships among proteins from different protein folds.
In order to overcome the above disadvantages, in this study, we proposed a computational approach for protein fold recognition, called DeepSVM-fold, by introducing a new feature vector based on the pairwise sequence similarity scores calculated from the fold-specific features. Combined with SVM, experimental results on the benchmark dataset showed that DeepSVM-fold outperformed other existing competing predictors.
Materials and methods
Benchmark dataset
LE dataset
The widely used LE dataset [16] was employed to evaluate the performance of various approaches. It contains 976 proteins belonging to 330 folds derived from SCOPe database, with |$\le$|40% pairwise sequence identity. In this dataset, 321 proteins have at least one match at fold level. It should be pointed out that the LE dataset was partitioned into two subsets at fold level. In order to simulate the protein fold recognition task, any two proteins from different subsets would belong to the same fold, but they are not in the same superfamily or family.
Protein representations
In this study, three protein representations containing predicted structural information and evolutionary information were used, including residue–residue contacts (CCM) by running CCMpred [17], position-specific scoring matrix (PSSM) [4] and position-specific frequency matrix (PSFM) [4]. The CCM contains the predicted structural information of proteins, which is a widely used feature for protein fold recognition [11]. PSSM and PSFM are profile-based features containing the evolutionary information, which are useful for protein sequence analysis, especially for analyzing proteins sharing low sequence similarities [18].
Residue–residue contacts
In order to generate the CCM, the target protein was searched against the uniprot20_2016_02 database through HHblits tool [19] to generate the multiple sequence alignment (MSA) of the target protein. CCMpred [17] with default parameters was performed on the MSA to analyze the coevolution between residues, and then the contact probability for each residue–residue pair was calculated.
Position-specific scoring matrix
PSSM captures the evolutionary information by calculating the frequencies of different amino acids at the same site through the MSAs and plays a key role in fold recognition [20]. In this study, PSSM was generated by searching against the nrdb90 database through PSI-BLAST [4], with the E-value of 0.001 and the number of iterations of 3. For proteins without meaningful PSSMs, the corresponding BLOSUM62 was used following the previous study [21].
Position-specific frequency matrix
Following the same process of generating PSSM, the PSFM was also calculated through MSA generated by PSI-BLAST. The PSFM is used to represent the frequencies of the 20 standard amino acids occurring at specific sequence positions during the evolutionary process. Both the PSSM and PSFM are able to incorporate the evolutionary information.
Extracting fold-specific features by deep learning networks
Previous studies [11, 22] showed that the features automatically generated by deep learning are more accurate than the traditional features. Therefore, three different deep learning networks were constructed to extract the fold-specific features based on CCMs, PSSMs and PSFMs. The extraction of the fold-specific features representing the characteristics of the protein folds is critical for improving the performance of fold recognition as shown in some recent studies [11, 23]. Unfortunately, it is a difficult task because of the various protein folds and the low sequence similarity of proteins in the same fold. Recently, Zhu et al. [11] proposed a new approach called DeepFRpro to extract the fold-specific features by deep convolutional neural network (DCNN) based on the SCOPe database and showed that this approach is able to obviously improve the accuracy of protein fold recognition. However, this method suffers from the following shortcomings: (i) Ignorance of the evolutionary information. Recent studies showed that the evolutionary information extracted from PSSMs and PSFMs are important for protein sequence analysis [1, 3]. Therefore, it is very important to extract the fold-specific features based on these profiles. (ii) Ignorance of the global sequence order effects of all the residues along the protein sequences. DeepFRpro applied DCNN to extract the fold-specific features. DCNN can only incorporate the local sequence composition information and failed to extract the features in a global fashion.
In order to overcome these shortcomings, in this article we employed the convolution neural network–bidirectional long short-term memory (CNN-BLSTM) to extract the fold-specific features from CCMs, PSSMs and PSFMs. CNN-BLSTM combines the two most widely used deep neural networks: CNN [24] and bidirectional long short-term memory (BLSTM) [25], so as to effectively detect the patterns in protein sequences by CNN and capture their global sequence order effects along the proteins by BLSTM [22].
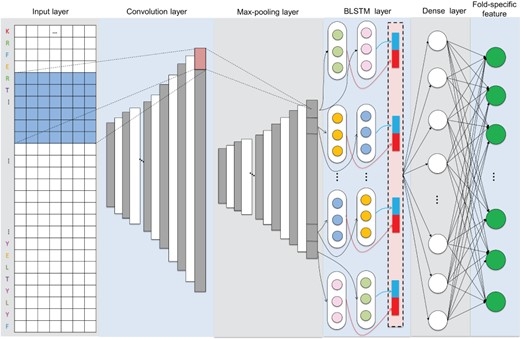
The network architecture of CNN-BLSTM to extract fold-specific features from profiles (PSSMs and PSFMs).
In this study, two different network architectures CNN-BLSTM and DCNN-BLSTM were employed to extract the fold-specific features considering the evolutionary information from profiles (PSSMs and PSFMs) and the fold-specific features considering the structure information from CCMs. Specifically, the CNN-BLSTM takes PSSM or PSFM matrix of a protein as input, the DCNN_BLSTM takes CCM matrix of a protein as input and each protein with its fold type as label was used to evaluate the sensibility of the extracted fold-specific features by deep learning. For the purpose of extracting the fold-specific features of different folds by deep learning techniques, we collected 19 772 proteins covering 1211 folds on SCOPe (version 2.06) as a comprehensive database following [11]. All the proteins in the database share <40% sequence similarity with the proteins on the LE dataset (Supplementary Information S1). Our networks were implemented by Keras (2.0.8) with the backend of Theano (0.9.0) [26]. During learning the fold-specific features process, the protein length was fixed as 400, covering 95.4% of the full-length proteins in the database (Figure S1 in Supplementary Information S2). Ninety percent of the samples in the database were used to generate the fold-specific features, and the remaining 10% of the samples were used to validate the accuracy of these features. Two techniques increased the accuracy and efficiency of neural networks. Batch normalization [27] was employed to accelerate learning by reducing internal covariate shift, and the dropout technique [28] was used to improve performance by reducing the risk of overfitting.
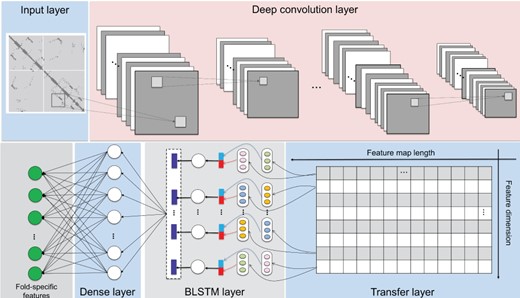
The network architecture of DCNN-BLSTM to extract fold-specific features from CCMs.
These two network architectures will be introduced in the following sections.
Network architecture of CNN-BLSTM to extract the fold-specific features from PSSMs and PSFMs
The architecture of the CNN-BLSTM with eight layers is shown in Figure 1, including an input layer, a convolutional layer, a max-pooling layer, a BLSTM layer, a fatten layer, a dense layer and a fold-specific layer. Their detailed information is:
Convolution layer: The convolution layer is able to extract the hidden features of local protein sequence, such as specific protein function domains and motifs [29] benefited by the multiple feature maps.
Max-pooling layer: The max-pooling layer can perform coarse-grained processing on those local patterns to improve the reliability of detecting local patterns. The function of a max-pooling layer is to reduce the size of the model and noise and improve the calculation speed [30].
BLSTM layer: The BLSTM layer was employed to extract dependencies among extracted hidden features in different local sequence positions and capture different levels of dependency relationships [18].
Dense layer: The dense layer consists a connected layer. The generated hidden values through BLSTM layer were combined into a vector by the flatten layer and then connected to each neuron in a fully connected layers. The nonlinear combination of local patterns can be learned by the fully connected layer.
Fold-specific features layer: The fold-specific features layer was constructed based on the 1024 neurons corresponding to the 1221 fold types in the SCOPe (version 2.06).
The parameters of CNN-BLSTM were given in Supplementary Information S2.
Network architecture of DCNN-BLSTM to extract the fold-specific features from CCMs
Different from the profiles, CCM describes the contact information of any two residues along a protein sequence. In order to extract the complex contact information, following this study [11] we treated CCMs as images [24] and employed the DCNN to extract the local patterns in the CCMs. The dependency information of the local patterns was further extracted by BLSTM. This network architecture is called DCNN-BLSTM (Figure 2).
The architecture of the DCNN-BLSTM is given in Figure 2 with 13 layers, including an input layer, five convolutional layers, two max-pooling layers, a BLSTM layer, a time-distributed dense layer, a fatten layer, a dense layer and a fold-specific features layer.
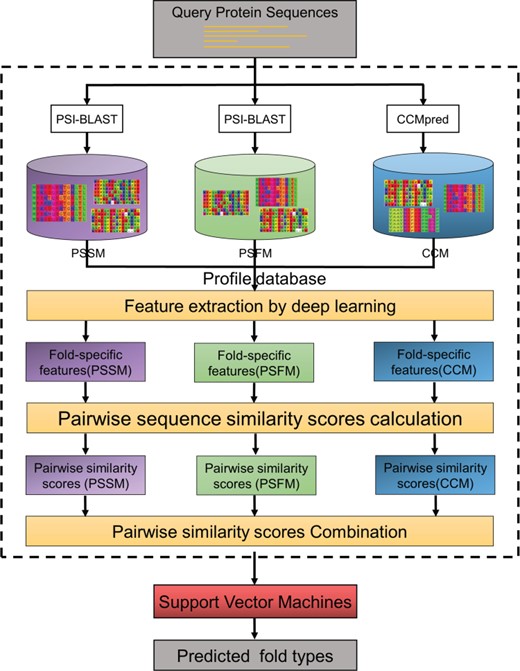
The framework and working process of DeepSVM-fold.
For detailed parameters of DCNN-BLSTM, please refer to Supplementary Information S2.
Pairwise sequence similarity scores based on fold-specific features
Feature vectorization strategy by combining pairwise sequence similarity scores
In order to combine the evolutionary information captured from PSSMs and PSFMs and the protein structure information extracted from CCMs, we employed a feature vectorization strategy [31] by linearly combining pairwise sequence similarity scores from PSSMs, PSFMs and CCMs.
The performance of DeepSVM-fold based on different pairwise sequence similarity scores and their combinations on the LE data set
| Method | Deep learning networka | Accuracy |
|---|---|---|
| DeepSVM-fold (PSSM) | CNN-BLSTM | 38.3% |
| DeepSVM-fold (PSFM) | CNN-BLSTM | 48.9% |
| DeepSVM-fold (CCM) | DCNN-BLSTM | 56.7% |
| DeepSVM-fold (PSSM, CCM) | CNN-BLSTM, DCNN-BLSTM | 61.0% |
| DeepSVM-fold (PSFM, CCM) | CNN-BLSTM, DCNN-BLSTM | 67.3% |
| DeepSVM-fold (PSSM, PSFM, CCM) | CNN-BLSTM, DCNN-BLSTM | 65.8% |
aThe parameters of CNN-BLSTM and DCNN-BLSTM are respectively given in Table S1 and Table S2 in Supplementary Information S2.
Performance of various methods for protein fold recognition on the LE data set via 2-fold cross-validation
| Methods | Accuracy | Source |
|---|---|---|
| PSI-Blast | 4.0% | [16] |
| HMMER | 4.4% | [16] |
| SAM-T98 | 3.4% | [16] |
| BLASTLINK | 6.9% | [16] |
| SSEARCH | 5.6% | [16] |
| SSHMM | 6.9% | [16] |
| THREADER | 14.6% | [16] |
| Fugue | 12.5% | [12] |
| RAPTOR | 25.4% | [12] |
| SPARKS | 28.7% | [12] |
| SP3 | 30.8% | [12] |
| FOLDpro | 26.5% | [12] |
| HHpred | 25.2% | [14] |
| SP4 | 30.8% | [14] |
| SP5 | 37.9% | [14] |
| BoostThreader | 42.6% | [14] |
| SPARKS-X | 45.2% | [14] |
| RF-Fold | 40.8% | [14] |
| DN-Fold | 33.6% | [14] |
| RFDN-Fold | 37.7% | [14] |
| DN-FoldS | 33.3% | [14] |
| DN-FoldR | 27.4% | [14] |
| FFAS-3D | 35.8% | [9] |
| HH-fold | 42.1% | [9] |
| TA-fold | 53.9% | [9] |
| dRHP-PseRA | 34.9% | [35] |
| MT-fold | 59.1% | [35] |
| DeepFR (strategy1) | 44.5% | [11] |
| DeepFR (strategy2) | 56.1% | [11] |
| DeepFRpro (strategy1) | 57.6% | [11] |
| DeepFRpro (strategy2) | 66.0% | [11] |
| DeepSVM-folda | 67.3% | This study |
aRefers to the DeepSVM-fold (PSFM, CCM) in Table 1.
Suppose that |$n$| training sequences and |$m$| test sequences on the benchmark dataset. The training sequences and test sequences belong to the same fold but different superfamilies. The global pairwise similarity scores were calculated between training set and test set by using Equation (1).
Let |${\mathbf{F}}_{tr}$| be the features of training protein sequences on the benchmark dataset and the feature matrix |${\mathbf{F}}_{\boldsymbol{tr}}$| is represented as |${\mathbf{F}}_{\boldsymbol{tr}}={[{\mathbf{F}}_{tr}^1,\cdots, {\mathbf{F}}_{tr}^n]}^{\mathrm{T}}$|, where each element |${\mathbf{F}}_{tr}^i(i\in [1,n])$| is represented as Equations (1)–(3). The |$m$| test protein sequences are represented as |${\mathbf{F}}_{tt}={[{\mathbf{F}}_{tt}^1,\cdots, {\mathbf{F}}_{tt}^m]}^{\mathrm{T}}$|, where each element |${F}_{tt}^i(i\in [1,m])$| is represented as Equations (1)–( 3). When aligning with the sample itself, the corresponding feature value was set as 0.
DeepSVM-fold
SVM [32] is an effective and fast supervised learning model that has been widely used in bioinformatics. Therefore, we proposed a new SVM-based computational predictor for fold recognition called DeepSVM-fold by using the pairwise sequence similarity scores generated by deep learning networks and treats the protein fold recognition as a multiclass classification problem (Figure 3).
In this study, the Python package Scikit-learn [33] was used as the implementation of the SVM classifier with a command line ‘svm.svc (random_state=“0”, max_iter=“1000”, kernel=“linear”, decision_function_shape=“ovr”, gamma=“auto”, c=15)’.
Evaluation strategies
In order to strictly simulate the fold recognition task, on the benchmark dataset the training samples and test samples should be from different superfamilies. Therefore, the LE dataset was partitioned into two subsets at fold level [9] to make sure that any two proteins from different subsets should not be in the same superfamily. The 2-fold cross-validation was employed to evaluate the performance of various methods on the LE dataset.
Results and discussion
Performance of the DeepSVM-fold on the LE dataset
The results of DeepSVM-fold approaches based on different pairwise sequence similarity scores and their combinations on the LE dataset are listed in Table 1. As we can see from it, among the three protein representations, the DeepSVM-fold based on CCM achieves the best performance, which is fully consistent with previous observations that CCMs can improve the performance of fold recognition by considering the predicted structural information of proteins [11]. DeepSVM-fold (PSFM) outperforms DeepSVM-fold (PSSM). The reason is that the deep learning networks can more efficiently fit the frequency values of the amino acids in PSFM than the weighted scores in PSSM. As demonstrated in previous studies [34–36], combining complementary features will improve the predictive performance. As shown in Table 1, DeepSVM-fold can be improved by combining CCM with PSFM or PSSM. However, the performance of DeepSVM-fold (PSSM, PSFM, CCM) is lower than that of DeepSVM-fold (PSFM, CCM). These results are not surprising because both PSFM and PSSM are profile-based features generated from the MSAs, but they capture the evolutionary information in different manners, and the frequency values of the amino acids in PSFM are more powerful than the weighted scores in PSSM for protein fold recognition. Therefore, the noise information is introduced when adding the PSSM as an extra feature.
Performance comparison with competing methods on the LE dataset
The performance of our approach was compared with the other existing 32 state-of-the-art approaches on the LE dataset, including alignment methods (PSI-Blast [4], HMMER [37], SAM-T98 [37], BLASTLINK [16], SSEARCH [38], SSHMM [39], THREADER [40], Fugue [41], RAPTOR [42], SPARKS [43], SPARKS-X [44], SP3 [45], SP4 [46], SP5 [47], HHpred [48], BoostThreader [49], FFAS-3D [50], HH-fold [9], dRHP-PseRA [51]), machine learning methods (RF-Fold [13], FOLDpro [12]), deep learning methods (DN-Fold [14], DeepFR [11]) and ensemble methods (RFDN-Fold [14], DN-FoldS [14], DN-FoldR [14], TA-fold [9], MT-fold [35], DeepFRpro [11]).
The results of different methods on the LE dataset are listed in Table 2. From this table, we can see that DeepSVM-fold outperforms all the other competing methods in terms of accuracy, indicating that it is effective to consider the structural and evolutionary information to extract the fold-specific features by using deep learning networks and the feature vectorization strategy incorporating global interactions among all the samples on the dataset based on the pairwise sequence similarity scores is useful for fold recognition. DeepSVM-fold outperforms the DeepFRpro (strategy 1) by 9.7% and outperforms the second best method DeepFRpro (strategy 2) [11]. DeepFRpro (strategy 2) combines the DeepFR (strategy 2) score and 84 similarity measures proposed in RF-fold [13] and employs the sampling/padding strategy to expand sample size in the training dataset during the training process. In contrast, DeepSVM-fold is more accurate and efficient.
Feature analysis
Discriminative features are the keys to construct an accurate computational predictor. Compared with other existing methods, the proposed DeepSVM-fold has the following two advantages: (i) the fold-specific features extracted by deep learning are accurate representations of proteins and their folds and (ii) a new feature vectorization strategy based on the pairwise protein similarity scores is used to extract the global information. These fold-specific features were further analyzed in the following section.
The fold-specific features layers (Figures 1 and 2) of deep neural networks (CNN-BLSTM, DCNN-BLSTM) were constructed based on the 1024 neurons corresponding to the 1221 fold types in the SCOPe (version 2.06). The 1024 neurons can be considered as the hidden, fold-related features of an input protein, that is, proteins with identical fold type share similar features, while proteins with different fold types have different features. The CCM-based fold-specific features extracted from LE dataset were visualized via a bicluster analysis, as shown in Figure 4. The 91 proteins from protein folds 1–23, 1–4, 3–1 and 7–3 were analyzed. From Figure 4, we can easily see the following: (i) proteins from similar protein folds were grouped into same cluster and (ii) proteins in the same protein fold tend to show similar fold-specific feature values. These results indicate that the fold-specific features are able to represent the patterns of different protein folds.

The bicluster analysis of fold-specific features extracted from CCM on the LE data set.
Conclusion
In this study, we develop a new predictor called DeepSVM-fold for protein fold recognition, which combines SVMs and pairwise sequence similarity scores generated by deep learning. Compared with other existing methods, DeepSVM-fold has the following advantages: (i) The fold-specific features considering the structural and evolutionary information of proteins are extracted by using deep learning networks. Their dependency information can be captured by the BLSTM networks. (ii) The feature vectors are constructed based on the pairwise sequence similarity scores of any two proteins between query proteins and training samples on the benchmark dataset, which is able to calculate the global relationship with training samples on the benchmark dataset, and therefore, DeepSVM-fold shows higher sensitivity and improves the robustness of protein fold recognition.
Recently, some more comprehensive and updated datasets have been constructed, such as YK dataset [35]. The proposed framework would be benefited from these datasets to construct more accurate predictors. Because the extraction of discriminative features are difficult for many biological analysis tasks [52], such as protein disordered region prediction [53], the proposed method would be applied to these fields to improve the predictive performance.
Because existing protein fold recognition predictor failed to efficiently calculate the pairwise sequence similarity scores of the proteins in the same fold sharing low sequence similarities and the exiting feature vectorization strategies cannot measure the global relationships among proteins from different protein folds, it is important to develop an efficient predictor for protein fold recognition.
A predictor called DeepSVM-fold for protein fold recognition was proposed by introducing a new feature vector based on the pairwise sequence similarity scores calculated from the fold-specific features extracted by deep learning networks. The feature vectors are then fed into SVM to construct the predictor.
Experimental results on the benchmark dataset showed that DeepSVM-fold obviously outperforms all the other competing methods, indicating that the pairwise sequence similarity scores generated by deep learning techniques considering the evolutionary information and predicted structure information are useful for protein fold recognition.
Acknowledgments
The authors are very much indebted to the three anonymous reviewers whose constructive comments are very helpful in strengthening the presentation of this article.
Funding
National Natural Science Foundation of China (61672184, 61732012, 61822306), Fok Ying-Tung Education Foundation for Young Teachers in the Higher Education Institutions of China (161063), Shenzhen Overseas High Level Talents Innovation Foundation (KQJSCX20170327161949608) and Scientific Research Foundation in Shenzhen (JCYJ20180306172207178, JCYJ20170307152201596).
Bin Liu, PhD, is a professor at the School of Computer Science and Technology, Beijing Institute of Technology, Beijing, China. His expertise is in bioinformatics, nature language processing and machine learning.
Chen-Chen Li is a master student at the School of Computer Science and Technology, Harbin Institute of Technology, Shenzhen, Guangdong, China. Her expertise is in bioinformatics.
Ke Yan is a is a PhD candidate at the School of Computer Science and Technology, Harbin Institute of Technology, Shenzhen, Guangdong, China. His expertise is in bioinformatics.
