


Abstract
Gene set analysis (GSA) is one of the methods of choice for analyzing the results of current omics studies; however, it has been mainly developed to analyze mRNA (microarray, RNA-Seq) data. The following review includes an update regarding general methods and resources for GSA and then emphasizes GSA methods and tools for non-mRNA omics datasets, specifically genomic range data (ChIP-Seq, SNP and methylation) and ncRNA data (miRNAs, lncRNAs and others). In the end, the state of the GSA field for non-mRNA datasets is discussed, and some current challenges and trends are highlighted, especially the use of network approaches to face complexity issues.
Introduction
In brief, the goal of all gene set analysis (GSA) methods is to take some experimental results [a list or a rank of differentially expressed (DE) genes, for example] and compare them to a database with some annotation that can increase our knowledge of the phenomenon under study. In other words, the input of a GSA is as follows: a query gene list or rank; a pathway, gene set or annotated ontology database; and a statistical procedure to find significant overlap, enrichment, de-regulation or interaction, between the two datasets. The output is usually a rank of significant pathways, gene sets or ontology terms, with their associated statistical significance.
There are multiple statistical methods, tools and web platforms to perform GSA, as well as numerous reviews of the field. We have collected references to 307 papers introducing GSA methods or tools and built a `GSA Reference Database’ with them (see Supplementary Material for the version of the database used in this manuscript and (1) for the current version). Table 1 shows the most popular methods during the last year, according to their citation number. We have also collected 57 papers with GSA reviews or method comparison studies. By far, the most popular GSA review was written in 2008, when many of the currently used GSA software and methods did not exist. Besides that, we found a significantly smaller number of method, software and review papers for most non-mRNA omics datasets, which is the primary motivation of the present study.
Top 25 most cited GSA papers during the last year.
| Rank | Method | Year, author | Title | Citations |
|---|---|---|---|---|
| 1 | GSEA | 2005, Subramanian | Gene set enrichment analysis: a knowledge-based approach for interpreting genome-wide expression profiles | 2476 |
| 2 | GOseq | 2010, Young | Gene ontology analysis for RNA-seq: accounting for selection bias | 524 |
| 3 | GSEA | 2003, Mootha | PGC-1 alpha-responsive genes involved in oxidative phosphorylation are coordinately downregulated in human diabetes | 438 |
| 4 | Enrichr | 2016, Kuleshov | Enrichr: a comprehensive gene set enrichment analysis web server 2016 update | 434 |
| 5 | DAVID | 2003, Dennis | DAVID: Database for Annotation, Visualization, and Integrated Discovery | 430 |
| 6 | ClueGO | 2009, Bindea | ClueGO: a Cytoscape plug-in to decipher functionally grouped gene ontology and pathway annotation networks | 409 |
| 7 | Enrichr | 2013, Chen | Enrichr: interactive and collaborative HTML5 gene list enrichment analysis tool | 364 |
| 8 | GOrilla | 2009, Eden | GOrilla: a tool for discovery and visualization of enriched GO terms in ranked gene lists | 330 |
| 9 | KOBAS | 2011, Xie | KOBAS 2.0: a web server for annotation and identification of enriched pathways and diseases | 295 |
| 10 | BiNGO | 2005, Maere | BiNGO: a Cytoscape plugin to assess overrepresentation of gene ontology categories in biological networks | 286 |
| 11 | WEGO | 2006, Ye | WEGO: a web tool for plotting GO annotations | 248 |
| 12 | ToppGene | 2009, Chen | ToppGene Suite for gene list enrichment analysis and candidate gene prioritization | 243 |
| 13 | KOBAS | 2005, Mao | Automated genome annotation and pathway identification using the KEGG Orthology (KO) as a controlled vocabulary | 234 |
| 14 | agriGO | 2010, Du | agriGO: a GO analysis toolkit for the agricultural community | 197 |
| 15 | WebGestalt | 2013, Wang | WEB-based gene set analysis toolkit (WebGestalt): update 2013 | 190 |
| 16 | DAVID | 2007, Huang | The DAVID Gene Functional Classification Tool: a novel biological module-centric algorithm to functionally analyze large gene lists | 187 |
| 17 | GSVA | 2013, Hanzelmann | GSVA: gene set variation analysis for microarray and RNA-seq data | 173 |
| 18 | SSGSEA | 2009, Barbie | Systematic RNA interference reveals that oncogenic KRAS-driven cancers require TBK1 | 165 |
| 19 | GOstats | 2006, Falcon | Using GOstats to test gene lists for GO term association | 150 |
| 20 | DAVID | 2007, Huang | DAVID Bioinformatics Resources: expanded annotation database and novel algorithms to better extract biology from large gene lists | 147 |
| 21 | FunRich | 2015, Pathan | FunRich: An open access standalone functional enrichment and interaction network analysis tool | 142 |
| 22 | topGO | 2006, Alexa | Improved scoring of functional groups from gene expression data by decorrelating GO graph structure | 130 |
| 23 | agriGO | 2017, Tian | agriGO v2.0: a GO analysis toolkit for the agricultural community, 2017 update | 126 |
| 24 | WebGestalt | 2017, Wang | WebGestalt 2017: a more comprehensive, powerful, flexible and interactive gene set enrichment analysis toolkit | 119 |
| 25 | WebGestalt | 2005, Zhang | WebGestalt: an integrated system for exploring gene sets in various biological contexts | 116 |
Top 25 most cited GSA methods or tools papers in the GSA field from May 2018 to April 2019, according to google scholar citations. The total number of GSA papers included in the analysis was 307 (for the full dataset, see: https://gsa-central.github.io/gsarefdb.html).
Genomic range data (from ChIP-x, SNP and methylation experiments) and ncRNA data (from miRNA, lncRNA and circRNA experiments) are the end products of a considerable portion of current omics experiments. However, after reviewing 53 papers with GSA methods and software tools applied to genomic range data and 28 papers with applications to ncRNA data, we found that there are fewer non-mRNA GSA methods and tools than their mRNA GSA counterparts, and such methods are also comparatively less cited (see Supplementary Material). Besides that, we found that, in most cases, such non-mRNA GSA methods are based on the most traditional GSA strategies (such as hypergeometric and GSEA) instead of the most recent developments. All of this shows how, despite its relevance, GSA for non-mRNA data has been less discussed and developed.
After a brief update on current mRNA-based methods and tools, we will review the current GSA approaches for genomic range and ncRNA data. We aim to categorize the existing methods according to their core approaches, as well as to describe them. Also, we will introduce a measure of each method’s popularity (in terms of citations) together with recommendations coming from benchmark studies (when available), so the reader may get a general idea of the methods that have been utilized and recommended. Finally, we will briefly discuss their limitations and some research trends.
GSA: an update
Khatri et al. (2) have reviewed many GSA tools/methods and classified them into three categories (or generations): over-representation analysis (ORA), functional class scoring (FCS) and pathway-topology-based (PT) methods. Such a classification has been followed by subsequent reviews, although alternative classification schemes can also be found (3–5). In recent years, network interaction (NI) and other types of methods have emerged and, consequently, they need to be added to the classifications mentioned above.
ORA evaluates the significance of the overlap between a query gene list and a reference dataset using a statistical distribution such as the hypergeometric, chi-squared or binomial distributions. A typical ORA workflow includes choosing up-regulated and/or down-regulated genes, choosing a pathway or gene set database, selecting a background, testing the query set against every pathway or gene set using the above-mentioned statistical tests, ranking the results according to p-values and applying multiple testing correction. The DAVID Functional Annotation Tool (6) is the most popular ORA tool in use, as it has a friendly website with multiple gene sets available, multiple test correction and ID conversion tools incorporated. Other popular ORA approaches are GOseq (7) and topGO (8) (see Table 1). However, numerous papers have pointed out a few important limitations of the ORA approach. First, it cannot be applied if there are no DE genes. Second, it will offer different results depending on the threshold used to select DE genes. Third, it does assume statistical independence between genes, which is not realistic due to the existence of gene–gene correlations. Fourth, it does assume that pathways are independent of each other and do not overlap.
FCS is based on the idea that thresholds for up- and down-regulated genes are arbitrary, and that not only large changes in gene expression may have significant effects on a pathway but also the contributions of multiple genes more modestly DE. Therefore, this approach uses all the genes ranked according to a measure of expression. The FCS approach has been summarized in three steps. The first step is to compute a specific statistic for each gene (such as signal-to-noise ratio, t-test and others). The second step is to combine all gene statistics into a gene set statistic (such as Kolmogorov–Smirnov, Wilcoxon sum rank or max–mean). The third and last step is to assess the significance of the gene set statistic (2, 9). Alternatively, some methods use multivariate statistics, while some others aggregate the values of gene univariate statistics. The first FCS method was Gene Set Enrichment Analysis (GSEA), which is still the most popular GSA method. Other FCS currently popular methods include GAGE (10) and globaltest (11). A 2013 comparison study (12) reported the best-performing FCS methods, including globaltest and PADOG (13). It has also been reported that the choice of gene-level statistics has a minimal effect on the results (2, 4), while the most critical component of an FCS method is the choice of the pathway or gene set-level statistic (14). Same as with ORA methods, FCS methods do not take into account pathway topological information.
PT methods work on the assumption that the specific organization of the reactions or interactions inside a pathway contains additional information that is useful to understand function. The most popular PT methods are Pathway-Express (15) and SPIA (16). Pathway-Express is a tool that works by computing two factors: a `gene perturbation factor’, which takes into account the fold change of a gene and the fold change of the genes upstream, and a `pathway impact factor’, which accounts for the gene perturbation factors of all the genes in a pathway. SPIA combines two types of factors: the over-representation of DE genes (using the hypergeometric approach) and a perturbation factor similar to the one in Pathway-Express, which includes the normalized expression change of a gene and the sum of perturbation factors of the genes directly upstream of the target gene, normalized by the number of downstream genes. Later developments have reported that many pathways can considerably affect each other's p-values through cross-talk both in ORA, FCS and PT methods, and the consequence is that different sets of significant pathways are found after a cross-talk correction (17). A new generation of PT methods, such as PathNet (18), PANA (19), PET (20) and SPATIAL (21), acknowledge the existence of pathway cross-talk. Bayerlova et al. (22) examined one ORA method (Fisher's), two FCS methods (Wilcoxon rank sum and Kolmogorov–Smirnov) and four PT methods (SPIA, CePa ORA, CePa FCS and PathNet) and concluded that PT-based methods only outperform FCS methods when there are no overlapping pathways, with PathNet being the best performer. A final group of related methods tries to find activated sub-pathways. They include SubpathwayMiner (23), sub-pathway-based approach (24), TEAK (25) and DEsubs (26). PT GSA has its own set of limitations. First, it is only for pathways (not applicable to general gene sets); second, it is restricted to pathways with known topology, and such information is only available for some organisms and common pathways; and third, pathway topology may change from cell type to cell type, and such information is scarce (2).
The most recent GSA group of methods addresses the problem of query genes that show no overlap with the gene set but interact with the gene set members through different types of relationships. This way, it replaces enrichment (or significant overlap) with significant interactions between the two sets of genes when located on a protein interaction network or a functional annotation network. Such significant interactions (also called `cross-talk’ in the literature) occur if the number of links between query and gene set nodes in the network is larger than the number of links expected by chance alone. Network Interaction (NI) methods are an interesting alternative because databases are highly incomplete; therefore, looking after interactions between gene sets in a network context can increase the GSA sensitivity. Examples of NI software are NEA (27), EnrichNet (28), CrossTalkZ (29), NetPEA (30) and BinoX (31). BinoX, for example, finds the number of observed links between a query list and a pathway, and then randomizes a functional annotation network a certain number of times and generates a distribution that can be used to estimate an empirical p-value, which is then corrected by multiple hypothesis testing. However, BinoX shares two limitations with ORA: First, gene lists are still generated using a subjective threshold value; and second, pathway topology is not taken into account.
Other types of GSA methods include Bayesian methods to join multiple gene sets, such as MAPE_I (32) and MetaOmics/MetaPath (33); dynamic methods for time-series data, such as STEM (34), TcGSA (35), timeClip (36), FUNNEL-GSEA (37) and Phantom (38); and single-sample (SS) methods. SS methods deal with sample-specific enrichment statistics, to find subject-specific (or patient-specific) responses. Examples include SSGSEA (39), PLAGE (40), PARADIGM (41), Pathifier (42) and GSVA (43). PARADIGM, for example, doesn't output a list of enriched pathways but a score for each sample-pathway pair. Such sample-pathway matrix can be subject to cluster analysis to group samples according to regulated pathways.
The two most popular ORA and FCS tools (DAVID and GSEA, respectively) are available on their websites (GSEA, for download). WebGestalt (44), Enrichr (45) and EnrichNet (28) are other websites with increasing popularity (see Table 1). There are also several species-specific websites (see some examples of plants, fungi, algae and prokaryotes, at the Supplementary Material and (1)) and even cross-species GSA websites (46). Other widely used tools are available as Cytoscape apps, with the most used being BiNGO (47) and ClueGO (48) (see Table 1). However, most GSA software exists as R packages. One R package (EGSEA) (49) gives us an ensemble of 12 methods, while another R package called ToPASeq (50) includes 7 PT methods. The GSVA package (43) consists of the GSVA, PLAGE, z-score and SSGSEA methods. Both DAVID and GSEA offer R packages as well. A complete list of published tools can be found at the Supplementary Material and reference (1). Figure 1 summarizes the GSA process.
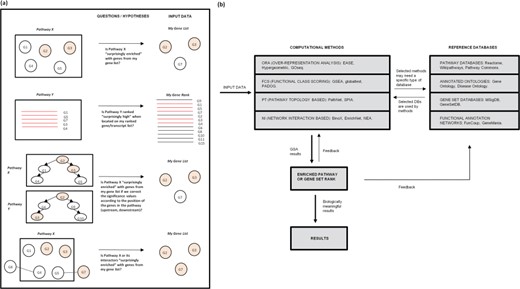
GSA in a nutshell. The goal of all GSA methods is to interpret some experimental results (DE genes, for example) by comparing them to a database with biological annotation that can increase our knowledge of the phenomenon under study. (a) The type of questions that give origin to the main GSA approaches. (b) A flow diagram of the general GSA process.
A review of GSA tools for non-mRNA datasets
Several tools have been developed to extend GSA from expression enrichment to other omics domains (Figure 2a).
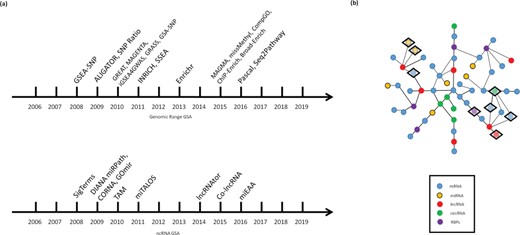
GSA for non-mRNA datasets. (a) The Past (a historical overview of the main GSA methods for non-mRNA datasets): the figure includes the main methods for both genomic range GSA and ncRNA GSA published until 2016. (b) The Future (network approaches to GSA): for genomic data, networks can be used either as links between chromatin regions related to transcription or as linkage disequilibrium clusters, which may redefine the mapping from peaks or SNPs to genes (non-depicted). For ncRNA data, multipartite ncRNA–mRNA correlation networks in tandem with community detection algorithms may become an avenue to understand the different correlation structures between ncRNAs and mRNAs and choose the right gene sets for GSA. Depicted: DE genes (inside a diamond) generate communities on an imaginary network, which may be used as gene sets for integrative GSA of RNA data.
Top 15 most cited GSA papers applied to genomic range data.
| Rank | Method | Year, author | Title | doi | Citations |
|---|---|---|---|---|---|
| 1 | GREAT | 2010, McLean | GREAT improves functional interpretation of cis-regulatory regions | 10.1038/nbt.1630 | 1743 |
| 2 | - | 2007, Wang | Pathway-based approaches for analysis of genomewide association studies | 10.1086/522374 | 824 |
| 3 | MAGMA | 2015, de Leeuw | MAGMA: Generalized gene-set analysis of GWAS data | 10.1371/journal.pcbi.1004219 | 402 |
| 4 | MAGENTA | 2010, Segre | Common inherited variation in mitochondrial genes is not enriched for associations with type 2 diabetes or related glycemic traits | 10.1371/journal.pgen.1001058 | 372 |
| 5 | ALIGATOR | 2009, Holmans | Gene ontology analysis of GWA study data sets provides insights into the biology of bipolar disorder | 10.1016/j.ajhg.2009.05.011 | 366 |
| 6 | GenGen | 2009, Wang | Diverse genome-wide association studies associate the IL12/IL23 pathway with Crohn Disease | 10.1016/j.ajhg.2009.01.026 | 266 |
| 7 | - | 2009, Yu | Pathway analysis by adaptive combination of P-values | 10.1002/gepi.20422 | 259 |
| 8 | - | 2010, Zhong | Integrating pathway analysis and genetics of gene expression for genome-wide association studies | 10.1016/j.ajhg.2010.02.020 | 246 |
| 9 | - | 2010, Peng | Gene and pathway-based second-wave analysis of genome-wide association studies | 10.1038/ejhg.2009.115 | 233 |
| 10 | - | 2007, Gauderman | Testing association between disease and multiple SNPs in a candidate gene | 10.1002/gepi.20219 | 201 |
| 11 | INRICH | 2012, Lee | INRICH: Interval-based enrichment analysis for genome-wide association studies | 10.1093/bioinformatics/bts191 | 167 |
| 12 | iGSEA4GWAS | 2010, Zhang | I-GSEA4GWAS: A web server for identification of pathways/gene sets associated with traits by applying an improved gene set enrichment analysis to genome-wide association study | 10.1093/nar/gkq324 | 165 |
| 13 | GSEA-SNP | 2008, Holden | GSEA-SNP: Applying gene set 0enrichment analysis to SNP data from genome-wide association studies | 10.1093/bioinformatics/btn516 | 163 |
| 14 | GRASS | 2010, Chen | Insights into colon cancer etiology via a regularized approach to gene set analysis of GWAS data | 10.1016/j.ajhg.2010.04.014 | 147 |
| 15 | SNP Ratio | 2009, O’Dushlaine | The SNP ratio test: pathway analysis of genome-wide association datasets | 10.1093/bioinformatics/btp448 | 139 |
Top 15 most cited papers introducing GSA tools or platforms related to genomic data (ChIP-Seq, SNP and methylation data), written between 2007 and 2018, according to google scholar citations. The total number of papers included in the category was 53 (for the full dataset, see: https://gsa-central.github.io/gsarefdb.html).
GSA of genomic ranges data
ChIP-x data
GSA has been applied to the functional interpretation of enrichment on DNA/chromatin binding or modifications, that is, ChIP-Seq, ChIP-exo, ChIP-chip, DamID, ChIP-PET and similar datasets (collectively called ChIP-x methods by some authors), but especially to ChIP-seq data, which provides information of transcription factor binding data, histone mark data or histone variant data. In essence, such `genomic GSA tools’ associate binding or modification on a genomic region to an annotated coding gene (mapping) and then perform GSA for that gene.
The most intuitive approach to the mapping problem is the `Nearest Gene Approach’, that is, to associate each genomic range to its nearest gene. Enrichr (45), for example, includes the option to upload either gene lists or bed files; in the second case, the genomic coordinates are mapped to the nearest coding gene. A second approach is to use a `window’ around each gene: GREAT (51) is a web tool that defines a `regulatory domain’ for each gene, building a `basal domain’ of 5 kb upstream and 1 kb downstream of the TSS and an `extended domain’ up to the basal regulatory domain of the nearest genes within 1 Mb. Then, it uses a binomial test (ORA) for the enrichment of each regulatory domain, to find out if the total number of loci within the domain is higher than expected.
ChIP-Enrich (52) is another window-based method, which uses a logistic regression approach and empirically adjusts gene locus length (length of the gene body and surrounding non-coding sequence). In summary, the method starts by assigning peaks to genes: either assign each peak to the nearest gene (either nearest TSS or nearest TES) or to the gene with the nearest TSS. Then, it does perform GSA using a logistic regression model (the variable is a binary vector: 1 if there are peaks assigned to the locus, 0 if no peaks are assigned) adjusted for locus length. ChIP-Enrich can be found both as a website and as an R package. Broad-Enrich (53) is a version of ChIP-Enrich for broad peaks (such as in some histone marks).
Other tools include CompGO and Seq2Pathway. CompGO (54) is a tool limited to coding regions and GO analysis, which uses ORA from the DAVID platform followed by the log odds ratio to determine GO enrichment. Seq2Pathway (55) is a window-based method that links sequences to genes in a radius of 100 kb; then, applies the FAIME method (Functional Analysis of Individual Microarray/RNA-Seq Expression) to detect pathways. CompGO and Seq2Pathway can be found as R packages as well.
A Venn diagram comparison of methods, performed by the authors of Seq2Pathway, states that ChIP-Enrich and Seq2Pathway make considerably more predictions than GREAT and share many predictions not found by GREAT. However, GREAT is still the most popular tool in the field (Table 2). We have calculated that an `agreement set’ built with all the results coming from at least two out of the three methods in the above-mentioned comparison, contains around 45% of the hits (the other 55% are cases found by only one method), which is a call for rigorous comparison studies of such tools. To our knowledge, there are no comparisons of the entire group of methods against benchmark data.
A group of related methods focuses on the enrichment of a particular group of genes inside the gene list generated from the ChIP-Seq track. TF2LncRNA (56) is a web tool that maps TF peaks to lncRNA's genomic coordinates and then computes if the TF has a statistically significant number of peaks within a window around the lncRNA gene, calculated using the hypergeometric test. Another method, focused on finding enrichment of miRNA targets regulated by a given TF, is mBISON (57). mBISON receives up to three ChIP-Seq datasets and maps peaks to genes choosing only the genes reported at least two times. miRNA targets are identified from computational predictions, and enrichment of miRNA targets in the gene list is then computed.
One of the problems with the current DNA-binding enrichment tools is that they make little or no use of the chromatin interactions that govern the 3D structure of the genome, such as topologically associated domains (TADs) and long-range interactions that link regulatory regions not necessarily to the closest gene. Such information should play a more critical role in the future (58).
SNP data
For SNP data, the main problem is to map SNPs (instead of peaks) to the corresponding genes. Different from ChIP-Seq GSA, SNP GSA must take into account Linkage Disequilibrium or LD (when alleles at two different loci are inherited together more often than it would be expected by chance).
Similar to ChIP-Seq, the mapping of SNPs to genes has been frequently done by either discarding SNPs in non-coding regions, mapping all SNPs to the nearest gene or, more generally, assigning the SNP to a gene if the SNP falls inside a given window around the gene. ALIGATOR, for example, is a method that assigns significant SNPs to genes when the significant SNPs fall within 20 kbp before the start of the first exon and after the end of the last exon, counting each gene only once no matter the number of SNPs (59). Other authors recommend using a 20–50 kbp window (60). Besides being arbitrary, such windows may bring the problem of overlapping regions that make SNPs belong to more than one gene and, therefore, additional methods are needed to deal with the multiple counting problem.
After the mapping step, different GSA methods have been used. A simple Fisher's exact test under the `competitive hypothesis’ would include four values: the number of significant and non-significant SNPs in a gene set and the number of significant and non-significant SNPs outside that gene set. The same Fisher's test under the `self-contained hypothesis’ would also include four values: the number of observed significant and non-significant SNPs in a gene set and the number of expected significant and non-significant SNPs in that gene set. Such tests have been implemented in methods such as GLOSSI and software such as GeSBAP (60). GeSBAP selects the p-value of the SNP with the minimum p-value per gene and then applies Fisher's exact test to the gene lists (61). The minimum p-value approach has been criticized because a larger gene is more likely to contain smaller p-values; therefore, alternatives have appeared either (a) summarizing all SNPs in a gene or (b) modeling the effects on the phenotype of all the SNPs in the gene. For the summarizing approach, methods such as Fisher’s method for combining p-values, the Gamma method, and the adaptive rank truncated product method have been proposed (62). Peng et al. (63), for example, start by combining the p-values of the SNPs in a gene (using Fisher's combination test and others) into a significance level for the gene, and then combining the genes in a pathway into a p-value for the pathway (using the hypergeometric test and others). Examples of joint modeling (using linear or logistic regression) will be discussed later.
A similar evolution of GSA methods (from minimum P-values to summary P-values) occurred to FCS methods as well. For example, Wang et al. (64) published a method using the SNP with the minimum P-value at the gene level, followed by GSA using the Kolmogorov–Smirnov test. Such strategy was modified by software such as GSEA-SNP (which introduced the max-test statistics and all the SNPs in a gene) (65) and GSA-SNP (which allows GSA using the Z-score statistic, maxmean statistic or GSEA) (66, 67). Also SSEA (68), which is a method that uses the adaptive truncated product statistic to identify all representative SNPs of each gene, rank such SNPs according to the significance of their association to a given trait and performs GSA using a weighted Kolmogorov–Smirnov test.
More sophisticated methods include principal component regressions and permutation of sample labels to control size and other confounding effects. ALIGATOR, for example, assigns significant SNPs to genes as explained above, maps each gene to GO terms and assesses the significance of each GO term by simulations, to correct for LD and variable gene size (59). Regression-based methods include GRASS, MAGMA, PCgamma, PAGWAS, SGL-BCGD and SPCA (62). For each gene set, GRASS starts by using PCA to define a group of `eigenSNPs’ that summarize the SNPs in a gene and account for correlations due to LD. Then, it finds representative eigenSNPs per gene and evaluates their joint association with phenotype (disease outcome), using group ridge logistic regression between the eigenSNP matrix and the phenotype. Phenotype permutations are also performed to compute observed and null association statistics, which lead to a P-value (69). SPCA, on the other hand, maps SNPs to gene sets, then selects the subset of SNPs most associated to phenotype, estimates a `latent variable’ using PCA and, finally, estimates the gene sets (latent variables) associated with phenotype using a linear model (70). MAGMA starts getting the principal components of the SNPs and performing multiple linear regression of principal components, then transforming the gene's P-values into z-values and building a second linear regression model for GSA under either the self-contained or the competitive hypotheses (71). MAGENTA is a method that assigns SNPs to genes according to a window and chooses the most significant SNP/P-value per gene. Then, the gene P-values are corrected for six specific confounding effects without using permutation analysis but applying a step-wise multiple linear regression to the z-scores obtained from the P-values. Such a regression method starts regressing out just the most significant confounding variable, and then adds the next significant variable, one by one, evaluating each time if the added variable should be kept in the model. After selecting only the P-values smaller than a specific cutoff, a GSEA-like method is applied (72).
Other interesting approaches, such as MRPEA (Mendelian randomization-based pathway enrichment analysis), do correct for the effect of environmental exposures, using both GWAS data from a target disease and GWAS data from an environmental exposure (73). Zhang et al. (74) identified expression-associated SNPs (eSNPs) from two eQTL databases and assessed the association of such SNPs with basal cell carcinoma's GWAS data, before applying a GSEA-like procedure; the authors claim that such an approach improves the detection of relevant pathways.
Contrary to other types of non-mRNA data, several comparison studies have been done between SNP GSA methods. Ballard et al. (75) compared seven methods and suggested that principal component regression is the best of them. Other studies suggest that using a subset of the most significant SNPs, which could be based on either a fixed truncation point or an adaptive threshold, is better than using the best SNP or all the SNPs (76). According to Fridley et al. (60), principal component methods perform better for a small number of markers, while the `truncated Fisher's method’ (using only P-values smaller than a threshold) outperforms PCA for a large number of markers. It has also been suggested that effects of SNPs are smaller than those of gene expression and, due to that, methods such as GSEA, Fisher's exact test and others lack statistical power (77). Finally, Leeuw et al. (78) have reported that self-contained GSA is not adequate to draw biologically meaningful conclusions, while competitive GSA is vulnerable to LD. Among competitive tests, the authors report that only INRICH and MAGMA display a good statistical performance.
Given the problems of mapping using the nearest gene or a window around the gene, it is interesting to explore alternative approaches that use information of the SNPs in LD, such as ProxyGeneLD (79) and INRICH (80). ProxyGeneLD uses a list of SNPs from a given study and the list of all SNPs from HapMap. The program detects all HapMap SNPs that are in LD to form `proxy clusters’, which are assigned to the nearest gene. A significance level for each gene is defined as the lowest P-value among the single SNPs from the study that are not present in any proxy cluster and those belonging to proxy clusters that include one or more study SNP assigned to that gene. In the end, the authors use GSEA, DAVID and IPA, to perform GSA. INRICH starts identifying the intervals containing both the SNPs and the SNPs in LD. Then merge overlapping intervals and overlapping genes inside a gene set, to avoid multiple counting. INRICH is a method that explicitly suggests its use for either SNPs or any other genomic regions (which they call `Intervals’) such as deletions or duplications. For SNPs, the enrichment statistic of each gene set is the number of intervals that overlap a gene in the gene set; for CNVs (which span large genomic regions), the statistic is the number of genes in the gene set that overlap an interval. In the end, INRICH uses a permutation approach to compute empirical P-values for each gene set.
Methylation data
Several GSA methods were applied to early methylation data to identify differentially methylated gene sets. They included topGO, GOstats and IPA. However, it has been now highlighted that such methods are biased, as genes with more probes (in microarrays) or more CpG sites (in sequencing) are more likely to appear as over-represented (81, 82). Geeleher et al. (7) suggested that the best strategy to solve such technological bias is the one followed by GOseq. GOseq faced the problem of RNA-Seq technologies' bias towards long genes and highly expressed genes, which leads to the fact that gene sets containing either long genes or highly expressed genes are more likely to appear. To attack this bias, they computed the likelihood of differential expression as a function of transcript length and incorporated it into the statistical test. Such incorporation was done by using Wallenius non-central hypergeometric distribution, which is an extension of the hypergeometric distribution to the case where the probabilities of success and failure differ. Such a strategy has been later adapted to methylation data by computing the differential methylation as a function of the number of CpG probes or CpG sites. It has been used in software such as the missMethyl R package (83) whose `gometh’ function is a modification of the GOseq method for the Illumina 450K array, which computes the probability of a gene being differentially methylated given the number of associated CpGs and applies a Wallenius-based test for each GO term or KEGG pathway. An R workflow for methylation array data analysis has recently been published (84). Such workflow also uses missMethyl for GSA.
For the analysis of high- and low-resolution methylomes, including bisulfite sequencing data, an alternative is using the methylPipe and compEpiTools R packages (85). compEpiTools, in particular, may start from the data processed by methylPipe and find both the annotation of the methylated regions and their GO terms, using topGO.
Table 2 shows a summary of the most cited genomic GSA tools.
GSA of ncRNA data
miRNA data
Several strategies have been developed to perform enrichment analysis of miRNA data. The first strategy is starting with a list of miRNAs from our experimental results, finding the mRNA targets of those miRNAs and then treating such targets as if they were DE genes, that is, using a GSA method/tool to find the over-represented pathways.
The second strategy is to use a software that already performs all the previously mentioned steps, such as SigTerms (86), CORNA (87), Gomir (88), miTALOS (89), miRSystem (90) or DIANA-miRPath (91). The DAVID web tool accepts miRNA lists as well (miRbase IDs). SigTerms, for example, includes the target predictions from miRanda (92) and other tools and computes the one-sided Fisher's exact test (ORA) for a set of targets for each miRNA. miTALOS also uses Fisher's exact test. The most advanced available tools add another level of complexity to target identification: as a set of miRNAs can cooperatively regulate a group of functionally related genes instead of a single gene, they search after gene sets enriched in miRNA clusters. These strategies have been reviewed by (93). In any case, target prediction is a crucial step in this approach, given that even a single difference in nucleic acid sequence can affect miRNA-target pairing (93). It is also worth noting that the most commonly used statistical enrichment methods are usually the oldest and simplest. One exception to this is miRNA target enrichment analysis (miTEA) (94), which develops an FCS method called minimum mHG (mmHG) that checks for mutual enrichment in two ranked lists.
There are several ways to find miRNA targets. Recent R packages include: targetscan. Hs.eg.db, RmiR.Hs.miRNA, CROME (http://www.maths.usyd.edu.au/u/vivek/), CORNA (87) and multiMiR (95). A recently published web tool, which allows tissue-specific miRNA-target studies in 23 different tissues, is IMOTA (96). Some other tools, such as multiMiR (95), miRnalyze (97) and miRwayDB (98), annotate miRNAs with associated gene sets but do not include proper enrichment analysis tools. multiMiR includes various sources of predicted and validated miRNA-target interactions, as well as links to three disease- and drug-related DBs: miR2Disease, Pharmaco-miR and PhenomiR. miRnalyze links miRNA-target predictions with KEGG pathway information, while miRwayDB links published experimental information of expression of 232 miRNAs with 122 associated pathways under 76 different disease conditions.
As a third option, instead of using KEGG, MSigDB and similar databases with little or no miRNA information, it is possible to use a database with miRNA annotation and skip the use of targets. One tool for that is TAM (99, 100): Here, miRNAs are stored in categories or `miRNA sets’ according to the miRNA family, genome locations, functions, associated diseases and tissue specificity. Information comes from databases such as miRBase (101) and the Human MicroRNA Disease Database (HMDD) (102), a database for miRNA–disease associations, while tissue specificity was obtained from one paper (102). TAM evaluates over-representation of each miRNA set (257 sets) among a `miRNA list’ using the hypergeometric test. Those miRNA sets are available for download, and therefore they could be used with different methods than the hypergeometric one. A second tool is miSEA (103). Here, most miRNA sets are targets from miRTarBase (104) and miRecords (105), followed by diseases (from HMDD) and transcription factors from TransmiR (106). miSEA uses GSEA instead of ORA (uses ranked lists of miRNA expression) and allows the user to use its own miRNA sets as well. Finally, there is miEAA (107), a web tool that provides more than 14 000 miRNA sets and offers both ORA and GSEA methods. In general, the disadvantage of the database approach is that there aren’t as many miRNA database resources as for protein-coding genes.
The fourth option is to use a platform with a full pipeline for miRNA analysis, such as miARma-Seq (108): this tool offers the identification of miRNA, mRNA and circRNAs, differential expression, miRNA–mRNA target prediction and functional analysis. The target prediction uses multiple algorithms, while the GSA uses the GOseq tool (7), with Gene Ontology (GO) and KEGG databases.
Godard et al. (109) have shown that usual enrichment analysis using miRNA targets and the hypergeometric test is biased for a subset of biological functions such as cell cycle and others. Particularly striking is the bias towards cancer compared to protein-coding genes. The authors suggest two alternative procedures: the first one is to modify the pathways and only keep the genes that are known to have at least one interaction with a miRNA and then search after target enrichment. The second one is to map the pathways to miRNA lists according to miRNA-mRNA interactions and perform enrichment analysis from miRNA query list to miRNA set; this way, a miRNA is only represented once in a pathway independently of the number of its target genes in this pathway. Besides that, the authors show that many pathways share a significant number of miRNAs, which leads to pathway co-identification. To avoid that (and decrease the amount of multiple hypothesis testing), such similar pathways are recommended to be aggregated before the enrichment analysis.
lncRNA data
The main current strategy for enrichment analysis of lncRNA data is to find correlations between lncRNA and mRNA expression data. To do that, we will review two alternatives.
The first option is to start with a lncRNA list and an mRNA list from the same experiment, find all the mRNAs correlated to the lncRNAs and then apply ORA to the found mRNAs (110). The second option would be to start with a lncRNA list and a database of mRNA–lncRNA correlated pairs in our specific tissue and then apply ORA. One resource that supports the second approach is LncRNA2Function (111), which stores expression correlation data between lncRNAs and protein-coding genes across 19 normal human tissues. It does use the hypergeometric test, with GO and 12 pathway databases (in total, 9625 human lncRNA mapped to GO terms and pathways). A significant correlation is defined as the one with an absolute value of the Pearson correlation coefficient of >0.9 and adjusted P-value of <0.05. Another resource is the LncRNAtor platform, which contains 208 RNA-Seq datasets (6295 samples) for six species, with lncRNA–mRNA co-expression data, protein–lncRNA interaction data and results of GSA analysis (GO and KEGG) (112).
Some recent improvements include Co-LncRNA (113) and lncRNAs2Pathways (114). Both of these tools take into account the combinatorial effects of a list of lncRNAs on biological functions. Co-lncRNA is a web tool that contains 241 human RNA-Seq datasets, lncRNA–mRNA co-expression and enrichment using GO and KEGG. Co-lncRNA explores the combinatorial effects of a group of lncRNAs; however, it does analyze the directly co-expressed pairs, while lncRNAs2Pathways explores the effects on the downstream genes in a lncRNA–mRNA network. lncRNAs2Pathways is a method and R package that starts by building a coding-non-coding network, whose edges were either expression correlation or protein–protein interactions. The query set of DE lncRNAs is mapped to the network as source nodes, and a global network propagation algorithm (random walk with restart) computes propagation scores for the coding genes, in order to find the closer coding genes to the lncRNA list. In the end, the procedure generates a protein-coding gene rank according to propagation scores, and such a rank is then subject to GSA by using KEGG pathways and a Kolmogorov–Smirnov-like statistical measure weighted by the propagation scores.
An interesting alternative is Linc2GO (115). Linc2GO is a web tool with functional annotation of long intergenic non-coding RNA (lincRNA), which employs a different approach to protein-coding co-expression. This tool is based on the competing endogenous RNA hypothesis (ceRNA hypothesis), which states that lincRNAs interact directly with miRNAs to prevent them from binding mRNA. Therefore, a lincRNA is predicted to have the same function as an mRNA if both of them interact with the same miRNA. This way, they can build a database of 7202 lincRNAs with GO biological process annotation. As a complement, a recently published database, LncCeRBase (116) collects 432 experimentally verified human lncRNA–miRNA–mRNA interactions.
Top 15 most cited GSA papers applied to ncRNA data.
| Rank | Method | Year, author | Title | doi | Citations |
|---|---|---|---|---|---|
| 1 | miRNApath | 2008, Cogswell | Identification of miRNA changes in Alzheimer's disease brain and CSF yields putative biomarkers and insights into disease pathways | 10.3233/JAD-2008-14103 | 685 |
| 2 | DIANA miRPath | 2012, Vlachos | DIANA miRPath v. 2.0: investigating the combinatorial effect of microRNAs in pathways | 10.1093/nar/gks494 | 450 |
| 3 | DIANA miRPath | 2015, Vlachos | DIANA-miRPath v3. 0: deciphering microRNA function with experimental support | 10.1093/nar/gkv403 | 418 |
| 4 | DIANA miRPath | 2009, Papadopoulos | DIANA-mirPath: Integrating human and mouse microRNAs in pathways | 10.1093/bioinformatics/btp299 | 280 |
| 5 | miRSystem | 2012, Lu | miRSystem: an integrated system for characterizing enriched functions and pathways of microRNA targets | 10.1371/journal.pone.0042390 | 160 |
| 6 | SigTerms | 2008, Creighton | A bioinformatics tool for linking gene expression profiling results with public databases of microRNA target | 10.1261/rna.1188208 | 136 |
| 7 | TAM | 2010, Lu | TAM: a method for enrichment and depletion analysis of a microRNA category in a list of microRNAs | 10.1186/1471-2105-11-419 | 108 |
| 8 | lncRNAtor | 2014, Park | lncRNAtor: a comprehensive resource for functional investigation of long non-coding RNAs | 10.1093/bioinformatics/btu325 | 87 |
| 9 | LncRNA2Function | 2015, Jiang | LncRNA2Function: a comprehensive resource for functional investigation of human lncRNAs based on RNA-Seq data | 10.1186/1471-2164-16-S3-S2 | 75 |
| 10 | multiMiR | 2014, Ru | The multiMiR R package and database: integration of microRNA–target interactions along with their disease and drug associations | 10.1093/nar/gku631 | 73 |
| 11 | LncRNA2Target | 2015, Jiang | LncRNA2Target: a database for differentially expressed genes after lncRNA knockdown or overexpression | 10.1093/nar/gku1173 | 72 |
| 12 | Linc2GO | 2013, Liu | Linc2GO: a human LincRNA function annotation resource based on ceRNA hypothesis | 10.1093/bioinformatics/btt361 | 69 |
| 13 | Co-LncRNA | 2015, Zhao | Co-LncRNA: investigating the lncRNA combinatorial effects in GO annotations and KEGG pathways based on human RNA-Seq data | 10.1093/database/bav082 | 62 |
| 14 | CORNA | 2009, Wu | CORNA: testing gene lists for regulation by microRNAs | 10.1093/bioinformatics/btp059 | 62 |
| 15 | GOmir | 2009, Roubelakis | Human microRNA target analysis and gene ontology clustering by GOmir, a novel stand-alone application | 10.1186/1471-2105-10-S6-S20 | 55 |
Top 15 most cited papers introducing GSA tools or platforms related to ncRNA data (miRNA, lncRNA and circRNA data), written between 2008 and 2018, according to google scholar citations. The total number of papers included in this category was 28 (for the full dataset, see: https://gsa-central.github.io/gsarefdb.html).
It is also known that lncRNAs display several other molecular functions, such as DNA binding. Several studies have explored the gene expression changes after a given lncRNA knockdown or overexpression, and databases such as LncRNA2Target (117, 118) collect such lncRNA-target information. LncRNA2Target v.2.0 includes 72 102 of such interactions for human, plus 1465 interactions from immunoprecipitation assays, RNA pull-down assays and luciferase report assays. There are also multiple tools to predict lncRNA interactions with both DNA and other RNAs, which have been recently reviewed (119). Such information can also be used for GSA purposes.
More recent resources include the following: NeuraNetL2GO (120), which is a software that predicts lncRNA's GO function based on neural networks trained on the GO; LncFunNet (121), which infers lncRNA function from an integrative network of ChIP-Seq, CLIP-Seq and RNA-Seq data; and decodeRNA (122), which is a database providing inferred function for both lncRNAs and miRNAs in human cancer and normal cell types. A related non-GSA network-based method is lncFunTK (123), which starts from a lncRNA regulatory network built from ChIP-Seq, CLIP-Seq and RNA-Seq data, and computes a `Functional Information Score’ for each lncRNA to infer function from GO terms of neighbor genes.
Other ncRNA data
When studying other types of ncRNAs, such as circRNAs, similar procedures could be followed in principle. For example, the starBase database (124) uses RNA–RNA interactome data (such as LIGR-Seq, PARIS or SPLASH methods) to find all mRNAs interacting with ncRNAs; such mRNAs can be subject to GSA. In another example, Su et al. (125) start from the assumption that circRNAs are `miRNA sponges’, then proceed to computationally detect circRNA–miRNA interactions for all DE circRNAs and then to detect function from the corresponding miRNA targets. A similar analysis uses DIANA-miRTaR to find the miRNA target function, which they assume is the function of `the circRNA-miRNA axis’ (126). In contrast, it has also been suggested that circRNAs act as molecular scaffolds for RNA-binding proteins (RBPs) that regulate transcription (127), which would point to a different type of correlation. As we learn more about ncRNAs, it seems that circRNA-miRNA or circRNA-RBP correlations alone may be an over-simplification and we might expect very complex interaction networks of different types of RNAs.
Just as with other ncRNAs, it is also possible to avoid correlation studies and directly use specialized circRNA databases with functional annotation such as CircFunBase (128).
According to data collected for this review, the most popular ncRNA GSA methods are miRNApath, DIANA miRPath and miRSystem for miRNAs and lncRNAtor, LncRNA2Function and LncRNA2Target for lncRNAs (see Table 3 and Supplementary Material).
Discussion
It is evident that genomic range GSA methods have been mainly based on their simpler mRNA counterparts (ORA and FCS methods), with a few differences due to the needs of combining multiple peaks/SNPs in the same gene and mapping peaks/SNPs falling in the non-coding regions. It is also noteworthy that the development of ChIP-x, SNP and methylation GSA methods seems mostly independent from each other, even though all genomic range-based GSA software may be closely related (as suggested by the authors of INRICH). Indeed, the clustering approach used by ProxyGeneLD and INRICH to join regions in LD is analogous to the approach we have suggested for linking peaks in chromatin interactions for ChIP-x data, and therefore network analysis could be a useful framework for unifying genomic GSA methods. However, it is important to keep in mind that chromatin interaction domains and linkage disequilibrium blocks do not seem to correlate, suggesting that the networks of physical (regulatory) interactions and genetic interactions are independent (129).
Regarding ncRNA GSA, we want to highlight the possibility of building complex interaction networks involving all types of RNAs, as we mentioned in the previous section. The starBase database, for example, reports interactions between miRNA–mRNA, miRNA–lncRNA, miRNA–circRNA, RBP–mRNA, RBP–lncRNA, RBP–circRNA and others, from which we could expect a network containing RBPs, mRNAs, miRNAs, lncRNAs, circRNAs, sncRNAs and other RNAs. Therefore, network methodologies (such as those used by lncRNAs2Pathways) seem adequate and promising for functional interpretation studies under the correlation approach. Correlation network methodologies seem even more relevant when we acknowledge the existence of resources to link both genomic range and ncRNA data. For example, Lnc2Meth (130), a database for regulatory relationships between lncRNAs and DNA methylation and lncRNASNP2 (131), which is a database with the effects of SNPs on lncRNA structure and function. Figure 2b illustrates the idea of using integrative correlation networks on ncRNA GSA.
Conclusion
A landscape of the existing GSA methods and tools outside of the mRNA realm has been portrayed. On the positive side, it raises awareness of the existence of multiple less-known alternatives for functional interpretation of omics data and how they are evolving, which is useful to the biomedical researcher. On the negative side, it shows that the non-mRNA tools follow a few steps behind the mRNA-based tools, and many of the new and the currently popular methods still wait to be used. Therefore, it is necessary to work on the application of the new PT cross-talk, SS and NI methodologies (beyond ORA, FCS and SPIA) to genomic range and ncRNA datasets. We have also identified and highlighted a few desired future directions, such as the use of chromatin interaction data for genomic range GSA and the use of integrative interaction networks (instead of pairwise correlations/targets) on ncRNA GSA (Figure 2b) and also the need of a comprehensive functional annotation of ncRNAs to be used in databases.
In addition, non-mRNA-based tools share some additional limitations and open problems with their mRNA counterparts. For example, the lack of databases that annotate pathways, gene sets and ontologies with the different experimental conditions in which those datasets were generated, moving from a general to a more personalized approach. Also, the need for benchmark data and comprehensive comparative studies between tools, to identify the best performing tools, which currently is a difficult task.
Due to lack of space, we have failed to discuss GSA of metabolomics, metagenomics and integrative (multi-omics) data. All those fields report similar levels of progress to the ones discussed above, and we plan to address them in the future.
The discussion of the different available functional interpretation methods and their limitations is essential because it does give arguments to researchers, reviewers and the general public to be more critical regarding the functional interpretation analyses performed inside any biomedical studies and the validity of their conclusions. The author hopes that this paper helps in that direction.
Based on a sample of 307 papers related to GSA methods and software (coming from the mRNA realm), we present an updated review of current GSA methods. We also review 53 papers with methods and tools applying GSA to genomic range data (ChIP-x, SNP and methylation data) and 28 papers with applications to ncRNA data (miRNA and lncRNA). In comparison to mRNA methods, we find that non-mRNA methods have been less discussed and developed.
GSA of genomic range data is based on mapping genomic ranges to genes. Methodologies to achieve this goal include mapping ranges to the nearest gene and mapping ranges inside a window around the gene. Such methodologies need to be enriched with biological knowledge regarding chromatin organization (for ChIP-x data) and linkage disequilibrium (for SNP data), among others.
GSA of miRNAs is mainly based on either determining miRNA targets or using databases of miRNA sets, while GSA of lncRNAs is based on either lncRNA–mRNA expression correlation or other pairwise correlations. Given the complex structure of correlations between RNAs and RBPs, current methodologies need to be enriched with efforts such as integrative correlation networks.
According to our data, GREAT is the most popular tool for GSA of ChIP-x data, while MAGMA is the most popular tool for SNP data in recent years. Regarding ncRNAs, DIANA miRPath is the most popular tool for miRNA data, while lncRNAtor and LncRNA2Function are the most popular tools for lncRNA data.
Data Availability
All datasets generated for this study are included in the manuscript and the supplementary files. Updated versions of the datasets will be available at https://gsa-central.github.io/gsarefdb.html
Conflict of interest
The author declares that the research was conducted in the absence of any commercial or financial relationships that could be construed as a potential conflict of interest.
Author contributions
A.M. wrote the full review and built the reference database.
Acknowledgments
The author thanks the support of both colleagues and students at the Joint School of Life Sciences, Guangzhou Medical University and Guangzhou Institutes of Biomedicine and Health (Chinese Academy of Sciences).
Funding
This work was funded by the Joint School of Life Sciences, Guangzhou Medical University and Guangzhou Institutes of Biomedicine and Health (Chinese Academy of Sciences).
Antonio Mora is an associate professor at the Joint School of Life Sciences, Guangzhou Medical University and Guangzhou Institutes of Biomedicine and Health–Chinese Academy of Sciences. His research focuses on methods and software for the functional interpretation of omics data.
