


Abstract
Biologists very often use enrichment methods based on statistical hypothesis tests to identify gene properties that are significantly over-represented in a given set of genes of interest, by comparison with a ‘background’ set of genes. These enrichment methods, although based on rigorous statistical foundations, are not always the best single option to identify patterns in biological data. In many cases, one can also use classification algorithms from the machine-learning field. Unlike enrichment methods, classification algorithms are designed to maximize measures of predictive performance and are capable of analysing combinations of gene properties, instead of one property at a time. In practice, however, the majority of studies use either enrichment or classification methods (rather than both), and there is a lack of literature discussing the pros and cons of both types of method. The goal of this paper is to compare and contrast enrichment and classification methods, offering two contributions. First, we discuss the (to some extent complementary) advantages and disadvantages of both types of methods for identifying gene properties that discriminate between gene classes. Second, we provide a set of high-level recommendations for using enrichment and classification methods. Overall, by highlighting the strengths and the weaknesses of both types of methods we argue that both should be used in bioinformatics analyses.
Introduction
Given a predefined set of genes (or gene products) associated with some known process or disease (the seed set), a common bioinformatics task is to find biological properties shared by the genes, or gene products like proteins, in the set. This gene set could be, for instance, the set of over-expressed genes from an RNA-Seq differential expression analysis or a compilation of genes associated with some disease of interest. Common characteristics can help biologists understand the underlying biological process being studied and also help identify other genes, not present in the original set, that may be also associated with the phenotype of interest.
The most common approach to achieve this goal is to use enrichment analysis techniques to identify significantly over-represented gene properties in the seed set. Most enrichment methods work by using a set of seed genes that are associated with a phenotype (e.g. are differentially expressed, genetically associated with a disease or linked to a target phenotype). Next, some type of statistical analysis is performed to find gene properties that are over-represented in the set of ‘seed’ genes with respect to some ‘background’ set of genes at a statistically significant level. Sometimes, another set of genes called ‘candidate genes’ is also defined; these are genes that might be candidates for the phenotype of interest. The candidate genes can be filtered using the enriched properties (or some other descriptor derived from these properties, e.g. biological pathways associated with the enriched properties) as an inclusion criterion and used as possible targets for further research.
Enrichment analysis techniques have several layers of complexity; they are usually based on tests of statistical significance that are, by themselves, nuanced and difficult to interpret [1]. Also, commonly used gene/protein descriptors have their own set of caveats and complexities [2]. The Gene Ontology (GO), for instance, can be easily misused by inexperienced users [3] that fail to take its hierarchical structure into account. In addition, selecting the appropriate statistical test to find common patterns in the set of enriched genes is a problem in itself, as each technique has its own biases and limitations [4], as discussed in the next section. Some authors even recommend trying several types of statistical tests and selecting the results of the ones that make more biological sense [2], which is a highly controversial approach due to unintentional ‘|$p$|-hacking’ risk [5, 6]. In this approach, all statistical tests that were not discarded due to issues with their underlying assumptions should always be reported to the readers, and this approach should be limited to exploratory studies.
The objective of this paper is to contrast commonly used enrichment method types with the increasingly popular (but still relatively less popular) approach of using classification algorithms from the area of machine learning to find candidate genes for further analysis and extract useful knowledge from the available data [7, 8], such as a list of predictive gene properties or rules that predict a phenotype of interest defined by the user. Classification algorithms work by using a ‘training set’ to learn a classification model that predicts the value of a class variable. The training set comprises instances (genes) usually represented as a numerical feature vector and a class variable with two (or more) possible class labels (the gene phenotype). In the binary case, usually one class label is considered the ‘positive’ label (the gene is associated with the phenotype), whereas the other label is the ‘negative’ one (the gene is not associated with the phenotype). The classification algorithm treats the class variable as the ‘ground truth’, meaning that it assumes that each instance is deterministically associated with a class label, which is not always the case due to the complex nature of biological processes. In any case, the classification model can then be used to classify instances in a ‘test set’ that have an unknown class label (e.g. to classify a new gene as ‘associated with disease‘ or not). The reader should be aware that the machine-learning nomenclature is not completely standardized; what we call ‘test set’ here is sometimes called ‘validation set’.
We stress that in this work we assume that the genes under study are pre-labelled with discrete class labels. Ranked gene lists (e.g. expression ranks), genes with continuous target variables (e.g. absolute expression values) and unlabelled gene lists are out of the scope of this paper.
Note that the training set used by classification algorithms is conceptually similar to the union of the ‘seed’ and ‘background’ genes in the enrichment setting, since both sets are used as input knowledge by the methods. In the case of enrichment methods, the ‘positive’ instances (the instances annotated with a positive class label) come from the ‘seed’ set, and the ‘negative’ instances come from the ‘background’ set. Note, however, that classification algorithms assume that instances annotated with the negative class label are necessarily not associated with the phenotype, while the background set is often the whole genome. Also, the ‘test set’ can be thought of as being similar to the ‘candidate genes’ set, which, like the ‘test set’, is a set of genes with unknown class labels that may or may not be associated with the phenotype of interest (the positive class label), with two differences, as follows. First, the intersection between the test set and the training set in the classification setting is necessarily empty, while in the enrichment setting there may be some candidate genes in the background set [2]. Second, it is assumed that the genes in the test and training sets are random samples from the same gene population, whereas the candidate genes are normally chosen because they are more likely to have the phenotype of interest than the other genes in the genome, according to expert knowledge.
In this work, we compare classification and enrichment methods by analysing their approaches for finding over-represented gene properties, contrasting the underlying assumptions of both methods. We also comment briefly on the use of classification algorithms to perform gene prioritization tasks, which is a direct by-product of the machine-learning workflow studied here. The contribution of this paper is twofold. First, we discuss the advantages and disadvantages of applying classification algorithms and enrichment methods to identify biological patterns—in particular, identifying gene properties that discriminate between gene classes. Second, we provide high-level recommendations for using enrichment and classification methods.
The remainder of this paper is organized as follows: The Background section gives an overview of both enrichment and classification methods for bioinformatics. The Enrichmentmethods versus classification methods from machine learning section discusses the advantages and disadvantages of classification and enrichment methods in bioinformatics (our 1st contribution). Lastly, the Conclusions and recommendations section presents our conclusions and gives high-level recommendations for using enrichment and classification methods in bioinformatics (our 2nd contribution).
Background
Overview of enrichment methods for bioinformatics
Enrichment analysis methods are popularly divided into three categories [2, 9, 10]: Singular Enrichment Analysis (SEA), Gene Set Enrichment Analysis (GSEA) and Modular Enrichment Analysis (MEA). Briefly, these categories group enrichment methods based on the type of statistical tests used and what corrections, if any, are made.
SEA methods calculate an enrichment |$p$|-value for each tested term based on its representation in a user-defined seed gene set, often using the hypergeometric distribution [2]. Next, the subset of terms with statistically significant |$p$|-values (after correcting for multiple hypothesis testing) is considered ‘enriched’ in the gene set.
GSEA methods do not require a user-defined seed gene set, instead calculating an ‘enrichment score’ for each term based on its distribution along a list of all the genes studied in the experiment, ranked by some experimental measure such as fold change or significance of differential expression. The original GSEA method used a Kolmogorov–Smirnov-like statistic as the enrichment score [11], whereby the algorithm walks down the ranked list of genes, increasing a running statistic each time a gene is annotated with the term of interest and decreasing it each time a gene is not. The enrichment score is then given as the maximum deviation from zero that the Kolmogorov–Smirnov-like statistic reaches.
MEA methods build on the SEA and GSEA approaches by incorporating corrections for the network structures of the data, for instance by accounting for the hierarchical nature of GO terms or correlations between genes themselves [2]. A subset of MEA, introduced by [4], is pathway topology-based approaches (PTA). These methods focus on incorporating network and pathway interaction information from knowledge bases such as KEGG [12], Reactome [13] and RegulonDB [14]. PTA, similarly to GSEA methods, use a ranked list of genes instead of using a predefined score cutoff, with the difference that the structure of the biological pathways is taken into consideration when computing gene-level statistics, not just the fact that the gene is in the pathway.
Recently, an ensemble method has been developed that combines methods from all three categories, referred to as the ensemble of gene set enrichment analyses [15]. This approach calculates a range of gene set statistics using multiple methods and then computes a score based on these statistics with which to rank the gene set. Although this is only one approach, it does constitute a potentially new ensemble category of enrichment analyses.
Although MEA is the most sophisticated non-ensemble approach, given its incorporation of knowledge on the complex networks common to biological systems, it is not necessarily the best option. SEA methods have been shown to give equally good or better results in real data sets [16], while GSEA may be more appropriate for experimental designs where it is difficult to provide user-defined gene sets. Examples of this could be an RNA-Seq experiment producing very few significantly differentially expressed genes, which would likely result in very few (or no) significantly enriched GO categories when testing by MEA, or conversely an RNA-Seq experiment producing thousands of significantly differentially expressed genes, which would result in a large number of significantly enriched GO categories when testing by MEA and thus leave the biological interpretation of the results open to a large amount of bias based on the expertise of the researcher analysing them [11].
All of these approaches have proved popular in the analysis of high-throughput data. SEA methods have been used to good effect for focusing investigations into differentially expressed gene lists, for instance focusing a study on multiple sclerosis principally onto the differentially expressed genes involved in oxidative phosphorylation and synaptic transmission [17]. Further, SEA methods have been used to link high-throughput results to an observed phenotype, as in an analysis of a colon and rectal cancer data set that was able to link the enrichment of ’response to wounding’ proteins to poor prognosis in these cancers [18]. GSEA methods were instrumental in establishing the pathways affected by resveratrol, a drug of interest for its effects on metabolism and lifespan [19, 20], and along with MEA methods continue to see wide use, for instance in the determination of pathways involved in cancer [21, 22].
Overview of classification methods (from machine learning) for bioinformatics
The classification task is the computational problem of inducing a classification model that maps given instances to classes using the (typically) numerical features of each instance (Box 1 gives a complete glossary of the main machine-learning terms used in this paper). We will now illustrate this with a hypothetical computational experiment wherein the instances are genes, the features are the GO terms associated to each gene and the class label to be predicted is ‘change in expression with age’. Thus, the purpose of the experiment is to induce a model that, for a given gene, predicts whether that gene will be differentially expressed with age based on its associated GO terms.
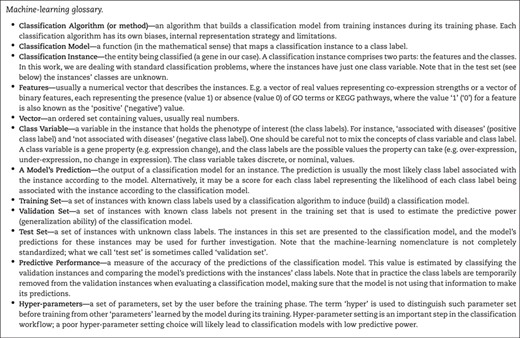
Glossary of machine-learning terms.
To perform this experiment, two sets of genes are required—a training set and a test set. The training set contains genes for which the class label is already known; in this case, it would be a set of genes known to either be differentially expressed (the positive class label) or not differentially expressed (the negative class label) with age. The test set, on the other hand, contains genes for which the class label is not known, so in this case, it would be all the genes for which the expression change with age was not known.
Once these sets are established, the classification model can be constructed based on the training data—a model is created that predicts whether a given gene will be differentially expressed with age based on its annotated GO terms. Before applying this model to the test set, however, it should first be validated. Validation is an important step to estimate the predictive performance (generalization ability) of the model and thus estimate its accuracy. In this case, a validation set should be used consisting of genes with known class labels that were not present in the training set. It is important that the validation set does not overlap with the training set to prevent overestimation of the accuracy of the model.
Once the model has been validated, if its estimated predictive performance is satisfactory then it can be used to classify the test set and thus predict hitherto unknown expression changes with age that can later be validated experimentally (the task is selecting the genes for further validation is called ‘gene prioritization’). Note that, in academic studies, very often there is no test set in the aforementioned sense, there is no ‘real’ prediction and conclusions about predictive power are based on the validation set only with no empirical confirmation. In addition, machine-learning terminology is not completely standardized, and what is here called the validation set is often called the test set in the literature.
Classification methods have been extensively used in bioinformatics [8, 23, 24]. In this context, usually both the training and validation sets contain a list of genes with the phenotype of interest (instances with the positive class value) with a list of genes without the phenotype of interest. Note that, usually, the latter list is actually a list of genes that are not known to be associated with the phenotype. The test set is usually a set of genes that could be associated with the phenotype of interest (e.g. the whole genome excluding the genes in the training and validation sets or a subset of genes selected using expert knowledge).
Another important aspect of using classification algorithms for gene prioritization is how to define the numerical features describing the instances (genes). Popular approaches include the use of experimentally derived gene properties, such as GO terms [25], Protein–Protein Interactions from BioGrid [26], functional protein associations from STRING [27] and pathway information from databases like KEGG [12]. The features encoding these properties are normally binary, where a feature value of ‘1’ (the positive feature value) indicates that the property is associated with the gene, while a value of ‘0’ (the negative feature value) means that the property is not currently known to be associated with the gene. Note that these features suffer from a high level of ‘research bias’, that is, highly researched genes tend to have more positive annotations than less popular genes. In addition, the negative value of a feature is much less informative than the positive value, since the negative value usually indicates ‘lack of evidence’ rather than ‘evidence of absence’ [28]. There are ‘lower-level’ features, which are less impacted by research bias, e.g. unbiased gene descriptors, such as physicochemical gene properties [29], gene co-expression scores measured using genome-wide methods [30, 31] and gene-expression levels across tissues [32]. The values of these lower-level features, however, are harder to interpret, i.e. usually it is more useful to know that a gene is involved in a given biological pathway (higher-level feature) than to know its expression level (lower-level feature).
In principle, the issues of research bias and uninformative negative values affect both enrichment and classification methods. Standard classification methods, however, seem more vulnerable since they tend to compound these effects while making a prediction, potentially using several unreliable feature values. Decision trees, for instance, may use several properties with negative values to predict the class of a single instance, perhaps with no property being a reliable predictor. Also, the ‘enrichment’ statistics, as the name suggests, are focused on calculating how probable the observed gene properties are (the properties with positive feature values) given the null hypothesis and not the unobserved gene properties (the properties with negative feature values).
Some classification models, besides being useful for predicting the class labels of unknown-function instances (genes), can also be used to gain knowledge about the underlying classification problem. For instance, decision-tree models are relatively easy to interpret, being capable of generating rules involving several features to classify instances, and have been used in bioinformatics to generate potentially interesting biological knowledge [23]. Note that the kind of knowledge extracted from classification models depends on the type of model being used; while decision trees are capable of generating easily interpretable rules, other types of classification models (e.g. Bayesian networks) generate models that can be interpreted with some effort [33]. Other types of classification models (e.g. deep neural networks) are hardly interpretable at all, requiring post-processing methods to be analysed [34].
One can also use the output of feature selection methods to get insights about important features (gene properties) [35]. Feature selection methods are typically used to rank the features (or feature subsets) in terms of discriminative power, placing redundant features and features with low discriminative power lower in the rank than more discriminative ones. Note, however, that the insight that feature selection methods can provide is limited. Analysing a simple list of ranked features does not explicitly show complex feature relationships or value-dependent conditions, which is the kind of more detailed insight provided by analysing classification models such as sets of IF-THEN prediction rules or decision trees. For instance, in [36] the authors report the following classification rule:
IF GO:0050896 (response to stimulus) = yes
ANDGO:0048518(pos.reg.ofbiologicalprocess)=yes
ANDnumber_of_protein_interacting_partners>15
THEN class is aging-related DNA repair gene
which means that if a gene satisfies all three conditions in its IF part (i.e. a case of feature interaction), the gene is classified as an ageing-related DNA repair gene.
In recent years, the use of deep-learning neural networks has been growing significantly in almost every field where labelled data is abundant, including biology [37]. Deep neural networks differ from traditional neural networks mainly in their highly flexible model, capable of automatically creating higher-level representations of the data that, in many cases, result in very good predictive performance. However, one should note that this potential is usually realized when the training sets are considered ‘large’. As a rule of thumb, training sets should have more than 20 000 instances, and each class label should annotate at least 5000 instances [38], which is much more data than available in many biological data sets.
A good example of the practical limitation of deep learning when the number of instances per class is not large can be found in [39]. In that work, deep learning was applied to a more complex variation of the classification task called hierarchical classification [40], where there is a large number of class labels organized into a hierarchical structure, with generalization/specialization relationships among the class labels. More precisely, in [39] two hierarchical classification tasks were addressed, where the class labels to be predicted are GO terms and protein families (as defined in the UniProt database). However, instead of trying to predict all possible class labels, deep learning was used to predict only the labels associated with at least 200 instances (genes) in the case of GO terms and at least 150 genes in the case of UniProt (super/sub) families. This reduced the number of class labels to be predicted to ‘only’ 983 for the GO terms and 698 for UniProt families. Although these are large numbers of class labels, they represent a relatively small proportion of the available class labels, and importantly, in general, they represent the class labels at higher levels of the class hierarchy, i.e. more generic GO terms or UniProt families. These are, broadly speaking, the easiest class labels to be predicted because there are so many instances annotated with those class labels. It would be much harder to predict the numerous most specific GO terms and UniProt families, which are annotated with less (often much less) than 200 and 150 instances.
The studies [28, 41] are examples of classification techniques applied to find biological patterns. In [28] the authors proposed an approach to identify important features to predict ageing-related classes using random forests (an ensemble of decision trees). The authors interpreted the biological meaning of the extracted patterns and concluded that they are indeed related to ageing. In [41], a relatively simple classification model (also based on decision trees) was able to achieve high predictive performance while classifying human genes as ageing related or non-ageing related. The authors identified new candidate proteins having strong computational evidence of their role in ageing and also found a small set of highly predictive features to classify the genes as ageing related.
Enrichment methods versus classification methods from machine learning
Enrichment analysis is strongly based on the concept of statistical significance. This concept is related to the concept of predictive power in the classification task of machine learning since both enrichment and machine-learning approaches tend to give more importance to gene properties that are over-represented in one of the experimental conditions (or class labels). Rule-induction algorithms, for instance, in general will choose to use a predictive feature value that is over-represented in one class, rather than choosing an under-represented feature value in that class, since the former has better predictive power. However, a high degree of enrichment (significance) does not necessarily imply high predictive power, and vice versa, high predictive power does not necessarily imply statistical significance. An example of each of these two cases is discussed next.
Suppose we have two classes of genes, say overexpressed (positive class) and not overexpressed (negative class), each gene annotated with many GO terms that can be used as features. Suppose these classes have prior probabilities (before observing any GO term) of 10% for the positive class and 90% for the negative class. Hence, if a certain GO term shows no correlation with the class variable, we would expect, by chance, that out of the genes annotated with that GO term, 10% belong to the positive class, and 90% belong to the negative class. Suppose now that we observe, in the data, that 50% of the genes annotated with that GO term belong to the positive class, and the other 50% belong to the negative class. Assume the actual number of genes with these annotations is large enough for this result to be statistically significant, indicating a significant enrichment of that GO term in the positive, over-expressed, class. Now, if we use only the presence of that GO term annotation to predict the class of a gene, that occurrence of that GO term has low predictive power; given the information that the gene is annotated with that GO term, there is a 50% chance of the gene belonging to each class.
Note that this does not mean that the GO term is completely useless for classification. After all, the probability of observing that GO term in the over-expressed class is five times higher than by chance. So, if we combine the occurrence of that GO term with the occurrence of other GO terms that are also significantly enriched for the over-expressed class, it is quite possible that a combination of those GO terms increases the probability of the over-expressed class to substantially higher than 50%. This is why it is important to consider GO term interactions by doing a multivariate analysis.
In the above example, the problem is that the relatively large increase in the probability of the class given that we observe an enriched GO term is not enough to compensate for the very low relative frequency of the positive (over-expressed) class. That is, despite statistical significance, the ‘signal’ is not strong enough to predict the over-expressed class. Also, broadly speaking, the result of a statistical significance test tends to be quite sensitive to the size of the sample. Even if the data is nearly random (with a very small effect size), if an extremely large sample is used, the test will tend to return a significant result anyway [5].
The above example shows that a statistically significantly enriched GO term may not have a strong predictive power by itself. Let us now consider the opposite case. Suppose that in the data set there are only 20 genes annotated with a certain GO term, and 18 of these genes belong to the positive class (overexpressed), with two genes belonging to the negative class. Assume these small numbers are not enough to achieve statistical significance, so the GO term would not be considered to be (significantly) enriched in the positive class. Despite that, this GO term has a high predictive power; given that we observe the occurrence of that GO term in a gene to be classified, if we classify that gene based just on that GO term, there is a 90% probability of the gene having the over-expressed class, a 9-fold increase in the prior probability of the class. The small number of genes with that GO term clearly means that only that GO term, by itself, would not be able to classify many genes, so again we would need to do a multivariate analysis of the data (considering many other GO terms as features) in order to reliably classify many more genes. However, the example showcases that, when looking at each GO term separately, without considering interaction with other GO terms, a non-enriched (i.e. not statistically significant) GO term can have a lot more predictive power than an enriched (significant) GO term. Figure 1 illustrates the above two cases graphically.
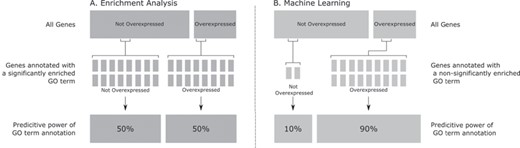
Graphical representation of a hypothetical statistically significantly enriched GO term with poor predictive performance (Subfigure A, on the left-hand side) and a non-statistically significantly enriched GO term with high predictive performance (Subfigure B, on the right-hand side). This figure shows that although the hypothetical GO term is significantly enriched in Subfigure A, it has poor predictive power (only 50% of the genes annotated with the GO term are over-expressed). On the other hand, the non-significantly enriched hypothetical GO term in Subfigure B (that annotates fewer genes) has good predictive power (90% of the genes annotated with the hypothetical GO term are overexpressed). This shows that significantly enriched gene properties are not necessarily good predictions and vice-versa.
It is clear that the importance given to gene properties by enrichment and classification methods are misaligned. This is not surprising, as the objectives of these methods are, although related, fundamentally different. Enrichment methods are designed to, given two or more sets of genes, find properties that are significantly over-represented in one of those sets, with respect to the other set(s). Classification methods, on the other hand, seek to ‘explain’ how the gene sets associated with the classes given by the user were created. In other words, a classification algorithm aims to create a model that reproduces the division of the genes into mutually exclusive classes given by the user as close as possible using gene properties. This model can be used to classify previously ‘unseen’ genes into the groups (classes). For this reason, a gene property that correctly classifies 18 out of 20 genes (as in the previous example) is much more valuable to the classification model than properties that are over-represented in many genes but misclassify the majority of them. Recall that, even though a rare highly predictive GO term is not enough to correctly classify many genes, the combination of many such relatively rare GO terms can correctly classify many genes, as mentioned earlier.
In summary, the main similarity between enrichment and machine-learning methods to find biological patterns rests on their principles for finding gene properties (features) that are over-represented in the class label (phenotype) of interest. That is, both types of methods tend to rank or select features based essentially on their degree of over-representation in the class of interest. However, enrichment and machine-learning methods have different biases when ranking the features. Enrichment methods rank features (gene properties) according to their statistical support independent of their predictive power, while machine learning tends to give more importance to features (gene properties) with greater predictive power. In concrete terms, this means that highly predictive features (features that can differentiate the instances among the classes with high predictive accuracy) will tend to be considered more important than features with high statistical support (features whose correlation with the class variable is statistically significant but that do not necessarily have high predictive power).
Also, these methods differ greatly on how they search for over-represented features and how they measure the feature’s over-representation score. Machine-learning methods usually employ some type of optimization procedure to search for over-represented features that, when taken together, are good predictions of the class label, whereas enrichment methods usually follow a simpler procedure that considers only one feature (gene property) at a time, ignoring feature interactions. For this reason, machine-learning methods are capable of providing richer results than a list of gene properties ranked by their importance. Decision tree algorithms, for instance, can return classification rules involving several gene properties that can be much more predictive than any individual feature taken in isolation. Enrichment methods, on the other hand, have the advantage of having a more grounded statistical support for their findings.
In Table 1 we show a real example contrasting the results of using traditional enrichment methods and machine-learning approaches to identify biological patterns. These results were taken from the supplementary material of [35] (Supplementary files ‘GO-Terms-rankings-biological-process.xls’ and ‘Pro longevity.xlsx’, available at https://github.com/maglab/genage-analysis/blob/master/Dataset_2_data_mining.zip and https://github.com/maglab/genage-analysis/blob/master/Dataset_1_functional_enrichment.zip (respectively)), where the authors used traditional enrichment methods and also a feature selection method that takes into consideration the hierarchical structure of the GO to find the GO terms most related to pro-longevity in the Caenorhabditis elegans model organism. Feature selection is a widely used machine-learning technique that seeks to find a subset of highly predictive features, eliminating the uninformative ones. It is clear from Table 1 that the top 10 GO terms identified by the ‘traditional’ enrichment approach contain several redundancies (e.g. positive regulation of growth is a type of regulation of growth), whereas the results of the feature selection method contain more distinct terms. This is expected, as removing redundancies among features to improve predictive power is one of the aims of feature selection algorithms.
Comparison of the top 10 GO terms associated with ‘pro-longevity’ genes in the worm model organism according to enrichment and machine-learning (feature selection) methods. Each sub-table shows the GO term identifier, the full GO term name and the |$p$|-value used to rank the GO terms (note that these |$p$|-values are not directly comparable since they are testing different hypotheses). The results were taken from the supplementary materials of [35]. Note that although the two GO term sets are distinct at first glance, they have important similarities. For instance, GO terms that appear both in the machine-learning gene set (GO:0001708, GO:0045138, GO:0010172) and in the enrichment method set (GO:0010259, GO:0007568, GO:0002119, GO:0002164, GO:0040024) are related to developmental processes
| Rank | Machine-learning method | Enrichment method | ||||
|---|---|---|---|---|---|---|
| GO Id. | GO term name | |$p$|-value | GO Id. | GO term name | |$p$|-value | |
| 1 | GO:0006914 | autophagy | 1.53E-03 | GO:0010259 | multicellular organismal aging | 1.69E-48 |
| 2 | GO:0051094 | positive regulation of developmental process | 3.56E-03 | GO:0008340 | determination of adult life span | 1.69E-48 |
| 3 | GO:0001708 | cell fate specification | 5.19E-03 | GO:0007568 | aging | 1.69E-48 |
| 4 | GO:0008285 | negative regulation of cell proliferation | 2.46E-02 | GO:0002119 | nematode larval development | 4.49E-39 |
| 5 | GO:0044262 | cellular carbohydrate metabolic process | 2.46E-02 | GO:0002164 | larval development | 4.97E-39 |
| 6 | GO:0045138 | tail tip morphogenesis | 2.46E-02 | GO:0009791 | post-embryonic development | 8.13E-39 |
| 7 | GO:0070265 | necrotic cell death | 2.46E-02 | GO:0040007 | growth | 4.05E-25 |
| 8 | GO:0018991 | oviposition | 4.77E-02 | GO:0040024 | dauer larval development | 2.76E-21 |
| 9 | GO:0010172 | embryonic body morphogenesis | 6.21E-02 | GO:0040008 | regulation of growth | 1.81E-19 |
| 10 | GO:0006352 | DNA-templated transcription, initiation | 6.21E-02 | GO:0045927 | positive regulation of growth | 2.88E-19 |
Note also that, overall, the top 10 GO terms identified by the enrichment and feature selection approaches are quite different, although there is some overlap (e.g. for GO terms related to development). This difference reinforces the motivation to use both approaches, since they make different assumptions and have, to some extent, complementary pros and cons, as discussed next. Using both approaches we have more opportunities to discover biological patterns, and patterns identified by both approaches (like development-related GO terms in the above example) can be considered particularly strong.
Advantages and disadvantages of classification methods from machine learning
The main advantages of classification methods are as follows.
First, most modern classification methods are non-parametric in the statistical sense—i.e. they do not assume that the data are distributed in a certain way. Instead, they adapt the learned model to the characteristics of the problem automatically during their training phase. Therefore, in principle, most classification algorithms can be used to discover very different types of relationships among variables in the data, including the discovery of highly non-linear correlations between the features (gene properties) and the class labels (the phenotype of interest). Most enrichment methods, on the other hand, are parametric in the statistical sense, and each method performs the same statistical calculations regardless of the extent to which the data satisfies the assumptions of the statistical test used.
Second, some types of classification models (e.g. decision trees) are relatively easily interpretable by users [42]. Such models can be used both for predictions and to gain insights about how the class label is related to the features in a relatively human-friendly fashion.
Third, most classification methods consider multivariate interactions between the features and the class label. On the other hand, most enrichment methods analyse one feature at a time, ignoring the fact that, sometimes, two or more gene properties, when taken at the same time, can be much more predictive (or enriched) than the individual properties.
The main disadvantages of classification methods are as follows.
First, some classification methods lack formal statistical basis—several classification algorithms cannot make principled statistical assessments regarding the data. That is, the predictions are made without confidence intervals or |$p$|-values.
Second, many classification methods are very computationally intensive. For instance, deep neural networks are very computationally demanding, often requiring the use of specialized hardware to run in reasonable times [7]. Note, however, that some well-known classification methods, like most decision tree algorithms and Naive Bayes, are relatively fast [43].
Third, hyper-parameter setting is not trivial. Recall that most classification algorithms have settings (hyper-parameters) that control important aspects of the learning process. A poor hyper-parameter choice can lead to low (even close to random) predictive performance. Many classification algorithms are very sensitive to these settings, requiring either expert knowledge or computationally expensive hyper-parameter tuning methods. These tuning methods usually work by running the classification algorithm several times, with different hyper-parameter settings, estimating the predictive performance of the constructed models to determine which hyper-parameter setting is the best one. One must be careful while performing this hyper-parameter tuning to not measure the predictive performance in the ‘validation set’, where the final predictive performance estimation will be carried out, but rather in a subset of the ‘training set’. The predictive power of classification algorithms will very likely be grossly overestimated if one uses the ‘validation set’ to tune the algorithm’s hyper-parameters.
Fourth, bioinformatics data sets often have two important particularities that can negatively impact the predictive performance of traditional classification algorithms: high class imbalance and structured biological descriptors. Regarding the issue of class imbalance, the data sets are often very unbalanced towards the negative class label—most whole-genome enrichment analyses involve thousands of genes without the phenotype of interest and only a few dozens with the phenotype of interest. Most classification algorithms do not cope well with this high level of class imbalance. However, there has been extensive research on methods for improving the performance of classification algorithms in this scenario, including the use of over(under) sampling of the minority (majority) class to create a more balanced training set [44]. Regarding the issue of structured biological descriptors, some descriptors (e.g. GO and FunCat terms) have a hierarchical structure. However, most classification algorithms treat them as unstructured, which may lead to problems due to the high correlation between terms. Exceptions are classification algorithms for hierarchical classification [40] and hierarchical feature selection methods for classification [45].
Advantages and disadvantages of enrichment methods
Enrichment methods are an extremely popular approach to summarize the functional characteristics of seed gene sets. These methods present several advantages when compared to other approaches, as follows. First, they are quick and computationally light, often able to analyse large gene sets using only a laptop computer, especially given the large number of web tools available. This makes enrichment analysis very suitable for small labs that may not have access to high-power computing clusters or machine-learning experts or for situations where a quick summary of gene set functionality is sufficient and a more sophisticated method would be unnecessary and overly time consuming.
Second, there are a wide variety of tools available covering multiple statistical methods. Many of these tools (for instance the highly popular DAVID tool [46]) are very user friendly with good documentation and clear explanations of their methodology to allow users to determine the best method for their data. These tools tend to use methods based on classical statistical tests that non-statisticians are likely to have at least some understanding of.
Finally, although less popular, Bayesian statistical methods have been incorporated into some enrichment analysis tools, allowing a more sophisticated statistical approach. The oldest of these is BayGO, which uses a Bayesian inference method to incorporate Goodman and Kruskal’s Gamma score of association. The association of differential expression to each GO term is measured, and Monte Carlo simulations are employed to determine the probability of randomly observing a stronger level of GO term enrichment than the measured level [47]. Other Bayesian tools are GO-Bayes [48], model-based gene set analysis [49] and multi-level ontology analysis [50], which all attempt to infer the probability that a given GO term is associated with a supplied gene set. These methods alleviate some of the concerns affecting most enrichment analysis methods, since the probability estimations account for some of the network characteristics inherent in biological data, while also considering all terms simultaneously thus removing the need for multiple hypothesis testing correction. Most Bayesian methods also have the advantage of not relying on classical tests of statistical significance, whose limitations were discussed earlier. Instead, they are based on the prior probability (before building the model) and the probability of observing the data given the model, which are, arguably, easier concepts for most people to grasp than |$p$|-values.
The main disadvantages of enrichment methods are as follows.
First, most enrichment methods are heavily based on tests of significance using |$p$|-values as the decision criterion. However, |$p$|-values by themselves are not adequate as the main basis for scientific conclusions, since they do not measure the effect size, importance and reproducibility of a result. For this reason, they should not be taken as definitive evidence for the existence or size of an effect [1, 51]. Instead, researchers should use |$p$|-values to help guide a broader analysis, avoiding absolute conclusions based on them.
In [2] the authors point out that the |$p$|-values of enrichment methods are often treated as a score of ‘interestingness’, and seldom the sensitivity and specificity of the list of ‘interesting’ properties are estimated. That is, little importance is given to the actual predictive power of the properties, giving more value to differences in relative frequencies instead. The authors also make the interesting point that the definition of the seed genes (for SEA methods) and gene rankings (for GSEA methods) are based on the assumption that the higher the differential expression of a gene, the more important the gene should be considered in the analysis. This is often a valid assumption but not always; a small change in expression of a regulatory gene may be much more biologically relevant than larger changes in, for instance, a metabolism-related gene.
Second, most ‘traditional’ statistical tests assume that the sampling units are independent. This is clearly not the case in most gene-expression experiments (where the sampling unit is usually a gene), a common application of enrichment methods. There are several regulatory genes that modulate the expression of other genes. When this assumption is not satisfied, the tests tend to make more type I errors than what would be expected (incorrectly rejecting the null hypothesis of ‘no differential expression’) [52].
Third, SEA and GSEA enrichment methods (see the Overviewof enrichment methods for bioinformatics section) ignore correlations between gene properties, analysing their enrichment significance independently. However, normally there are strong correlations among the gene properties; it is common that if a gene is annotated with a property, it is much more likely to be annotated with a 2nd property. This is particularly common when using GO terms, which are hierarchically structured (e.g. every gene annotated with the term ‘detection of stimulus’ is, by definition, also annotated with the term ‘response to stimulus’). Arguably, this fact is not so detrimental to the enrichment methods as high gene correlation (mentioned in the previous paragraph) [53], but it is still an important source of bias.
Table 2 lists the advantages and disadvantages of classification and enrichment methods to identify gene properties.
Summary of advantages and disadvantages for classification and enrichment methods to identify biological patterns
| Method type | ||
|---|---|---|
| Classification | Enrichment | |
| Advantages |
|
|
| Disadvantages |
|
|
| Method type | ||
|---|---|---|
| Classification | Enrichment | |
| Advantages |
|
|
| Disadvantages |
|
|
Conclusions and recommendations
Conclusions
Given a list of genes associated with a phenotype of interest (seed genes), enrichment methods have been extensively used by biologists to retrieve properties associated with the seed genes and sometimes to retrieve non-seed genes for further investigation. Enrichment methods have several desirable characteristics; they are usually computationally inexpensive to run, produce principled statistically based scores of importance, are easily accessible and are popular among bioinformatics researchers.
However, in some scenarios, machine learning–based classification algorithms may be more suited to deal with the task of identifying patterns in genomic data. Unlike enrichment methods, classification approaches aim to maximize ‘predictive performance’, that is, building a classification model to discriminate between gene classes by maximizing measures of predictive performance estimated using different gene sets for training and validation. Most enrichment methods, on the other hand, aim at finding statistically significantly enriched properties in the seed genes. These properties by themselves may not have good predictive power.
Besides the focus on maximizing predictive power, some classification models, like decision trees, are able to output an interpretable classification model, which can be analysed by the user, potentially giving insights about the underlying biological processes. Also, most machine-learning methods are capable of finding non-linear relationships and are capable of combining different gene properties to make a prediction.
Summary of recommendations for classification and enrichment methods to identify biological patterns
| Method type | |
|---|---|
| Classification | Enrichment |
|
|
| Method type | |
|---|---|
| Classification | Enrichment |
|
|
Summary of recommendations for classification and enrichment methods to identify biological patterns
| Method type | |
|---|---|
| Classification | Enrichment |
|
|
| Method type | |
|---|---|
| Classification | Enrichment |
|
|
Recommendations
One of the main practical challenges faced by biologists when applying machine-learning techniques to biological problems is how to construct the classification data sets. While most enrichment tools have built-in data sources, machine-learning algorithms often require file inputs. Note that having a built-in data source clearly facilitates the use of the tool but, on the other hand, may lead to the unintentional use of low-quality data (due to an out-of-date data source or to the use of low-confidence annotations). Fortunately, most bioinformatics databases have a link for downloading the entire database or Web APIs that can be used to extract the desired data. Also, there are Python (https://github.com/biopython), R [54] and Perl (https://www.ncbi.nlm.nih.gov/books/NBK25501/) libraries that can be used to obtain gene and protein data from several online resources. Biologists should also keep in mind the characteristics of the data they are using. For instance, not all gene annotations have the same level of confidence, and the lack of an annotation does not guarantee the absence of that property [3, 28]. These aspects should be carefully weighted when building and interpreting the results of both enrichment tools and classification models.
Choosing the right type of classification method for the task at hand is essential. For instance, classification model interpretability is often desirable when working with biological data [42]. If that is the case, the user can focus on interpretable classification models. Note that ‘interpretability’ is subjective and highly dependent on the background knowledge of the user of the classification system. Having said that, decision trees, rule-based classifiers, naive Bayes and logistic regression classifiers are commonly considered ‘interpretable’. When high predictive power is more important than interpretability, we suggest using ‘black-box’ models, which are very difficult to interpret but tend to have better predictive performance. Support Vector Machines and Deep Neural Network classifiers are popular examples of such models.
It is common to use ensembles of classification algorithms [55] to improve the predictive performance of the classification system. Ensemble methods combine the prediction of several ‘base’ classification models to output the final prediction of the ensemble. Ensembles tend to have a better predictive performance than the base models but have the drawback of increased training and testing times and reduced interpretability [56]. Random forests (ensembles of a type of decision tree), in particular, are a popular approach in bioinformatics that usually have high predictive performance [57] and are still somewhat interpretable, having a good compromise between predictive power and interpretability.
For readers with no machine-learning expertise who are interested in more information about these (and other) machine-learning topics, we recommend the comprehensive book of [43], which covers these topics providing an accessible theoretical basis and practical examples in the Java programming language using the popular WEKA software tool [58]. The newer scikit-learn software tool (https://scikit-learn.org/) is another option for readers interested in applying machine learning to their data using the Python programming language. The scikit-learn tool has several extensions that implement advanced machine-learning approaches and is arguably a better option for users looking for state-of-the-art algorithms.
When possible, we recommend testing a range of classification algorithms and hyper-parameter settings for the problem at hand. This can be done either manually, using expert knowledge, or automatically, using Automated Machine Learning approaches (Auto-ML) [59, 60]. In either case, it is important to compare the predictive performance of the models using statistical tests of significance, always being careful to apply the correct test and adjust the alpha (significance) values if multiple hypothesis comparisons are made [61]—in order to avoid the risk of unintentional p-hacking. Note that these statistical tests can be applied regardless of the underlying assumptions of the classification algorithms; the tests treat the models as ‘black boxes’ capable of making predictions.
Choosing the right enrichment method is equally important. It is essential to consider carefully which method to use, checking the assumptions of the method, rather than trying multiple approaches, and choosing the method that gives results that ‘make sense’—which would lead to over-optimistic |$p$|-values (|$p$|-value ‘hacking’ [5, 6]). The first consideration that should be made is whether to use an approach requiring a seed gene set or an approach that tests all genes simultaneously based on a ranked list. Seed gene set–based approaches have been shown to perform better in many cases [62, 63] and so should be used when possible. However, the creation of a seed gene set is not always easy. Seed gene set–based approaches can be extremely sensitive to the thresholds used for inclusion in the seed gene set [64, 65]. Creating a seed gene set based purely on statistically significantly different expression changes, for instance, often requires setting arbitrary cut-off values. E.g. when dealing with large sample sizes, ‘popular’ |$p$|-value cut-offs will lead to inflated seed gene sets, so using fold-change cut-offs is also necessary. However, choosing a fold-change cut-off has its own problems, as genes with low mean expression and high expression variance may erroneously meet the cut-off (note that there are methods to alleviate this issue [66]). If there is not strong evidence behind a seed list, then consider using either a GSEA approach that tests all genes simultaneously, or test for enrichment using MEA methods using multiple thresholds for inclusion in the seed gene set, with enriched terms overlapping between the tests being likely true positives.
Enrichment analysis is mainly descriptive (rather than predictive) in nature, and so the results should be interpreted as such. Being able to describe the characteristics of a seed list or ranked gene list is useful for understanding the mechanisms behind a response to a perturbation, drug treatment or disease; however, it is not sufficient evidence for the prioritization of candidate genes for further study. For this purpose, there are a wide range of further tools, ranging from guilt-by-association methods [13, 31, 67] to the machine-learning methods previously discussed. Combining enrichment analysis with predictive analysis tools is thus a powerful way to identify the biological response to a perturbation and subsequently identify potential novel candidates for manipulating that response.
Overall, we reinforce that none of the approaches discussed here is the best for all problems. Nonetheless, we recommend the addition of machine-learning classification methods in the toolset of biologists when exploring their data. In addition, machine-learning principles (such as the concept of separate training and validation sets for predictive performance estimation, see the Glossary in Figure 1) should be considered when extracting candidate genes from the data. Finally, if enrichment methods are used, one should be aware of the limitations of the underlying statistical methods and how to properly interpret the |$p$|-value statistics [1], which are not easy to fully grasp.
A summary of the above recommendations is provided in Table 3.
If enrichment methods are used, the limitations of null hypothesis significance testing should be considered. Also, |$p$|-value statistics, which are not easy to fully grasp, should be properly interpreted.
We recommend the addition of machine-learning classification methods in the toolset of biologists when exploring their data.
No single machine learning or enrichment method approach is the best for all problems.
Funding
This work was supported by a Leverhulme Trust Research Grant (Ref. No. RPG-2016-015).
Fabio Fabris is a postdoctoral research associate applying data mining to ageing research. He completed his doctoral thesis on graphical models applied to ageing-related classification tasks under the supervision of Alex A. Freitas.
Daniel Palmer is a postdoctoral research associate currently working in the Integrative Genomics of Ageing Group at the University of Liverpool. He has previously studied the mechanisms of longevity in long-lived strains of Drosophila melanogaster.
João Pedro de Magalhães is a reader at the University of Liverpool where he leads the Integrative Genomics of Ageing Group (http://pcwww.liv.ac.uk/aging/). The group’s research integrates experimental and computational strategies to help decipher the human genome and how it regulates complex processes like ageing.
Alex Freitas is a Professor of Computational Intelligence at the University of Kent, UK. He has a PhD in Computer Science (1997) and a master’s degree (MPhil) in Biological Sciences (2011). His main research interests are machine learning and the biology of ageing.
References
